

October was characterized by the decline in value of many altcoins. Due to political tensions in the Middle East, the global cryptocurrency market capitalization plummeted by 6% over the past 10 days.
However, as the market sentiment starts to recover and fears subside, analysts point to early signs that the altcoin season may be approaching.
Analysts "Forming the Strongest Pattern in 3.5 Years"
In a post on X on October 11, anonymous analyst Mustache mentioned that the Altcoin Season Index has formed one of the strongest bullish patterns in over 3.5 years, the inverse head and shoulders.
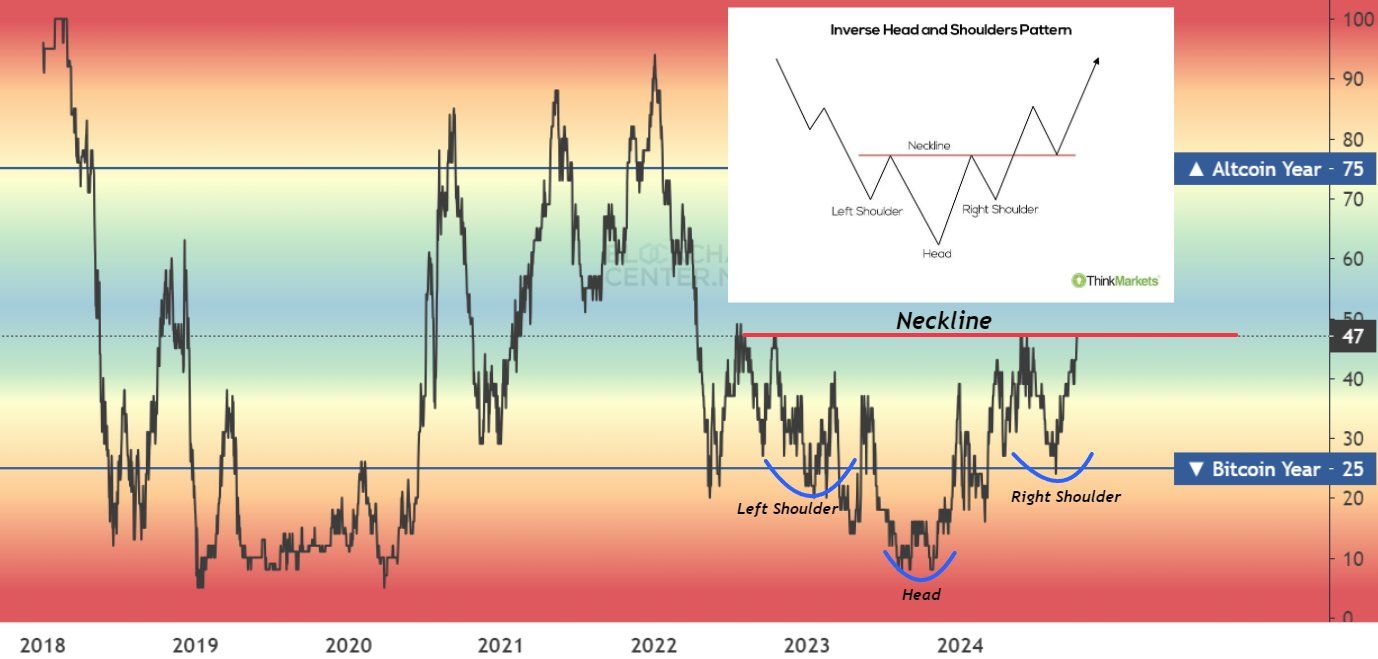
This index measures market trends to determine whether altcoins are outperforming Bitcoin. Mustache's observation suggests the possibility of a shift towards altcoins, as indicated by the index's inverse head and shoulders pattern. This bullish pattern signals that the downtrend in the sector is weakening and buyers are taking control of the market.
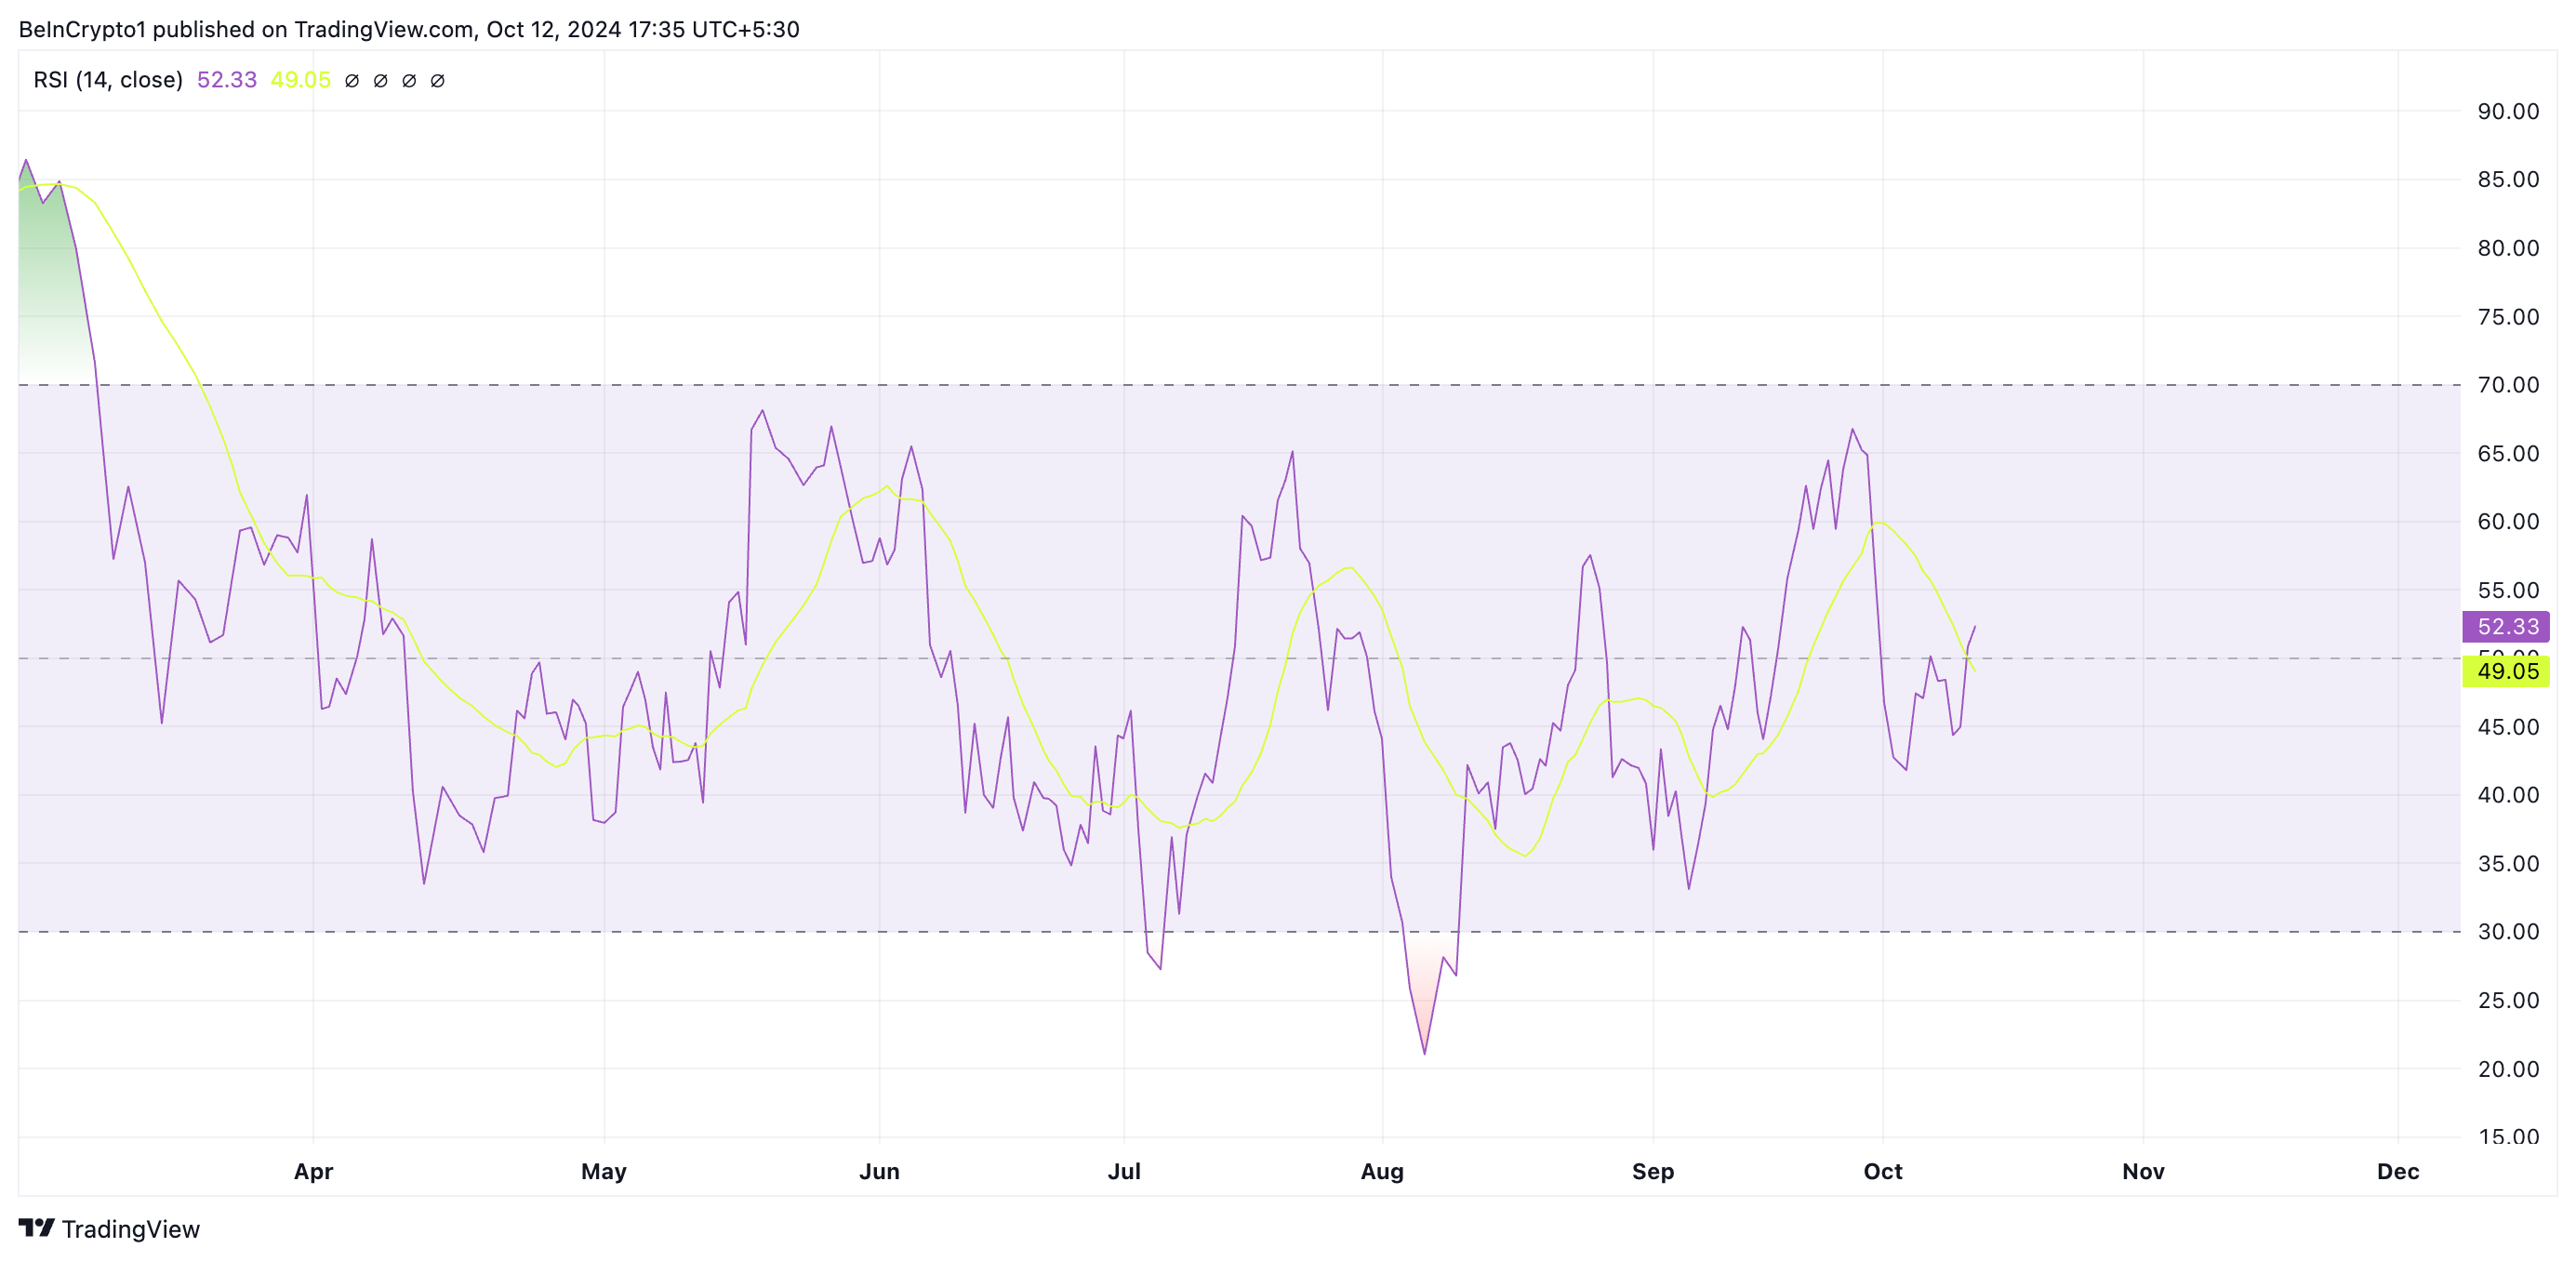
The gradual rise in the Relative Strength Index (RSI) of TOTAL2 (the combined market capitalization of all altcoins) supports this outlook. TOTAL2's RSI is currently at 53.15, in an uptrend, indicating continued accumulation in the altcoin market.
Read more: 9 Safest Cryptocurrency Exchanges in 2024
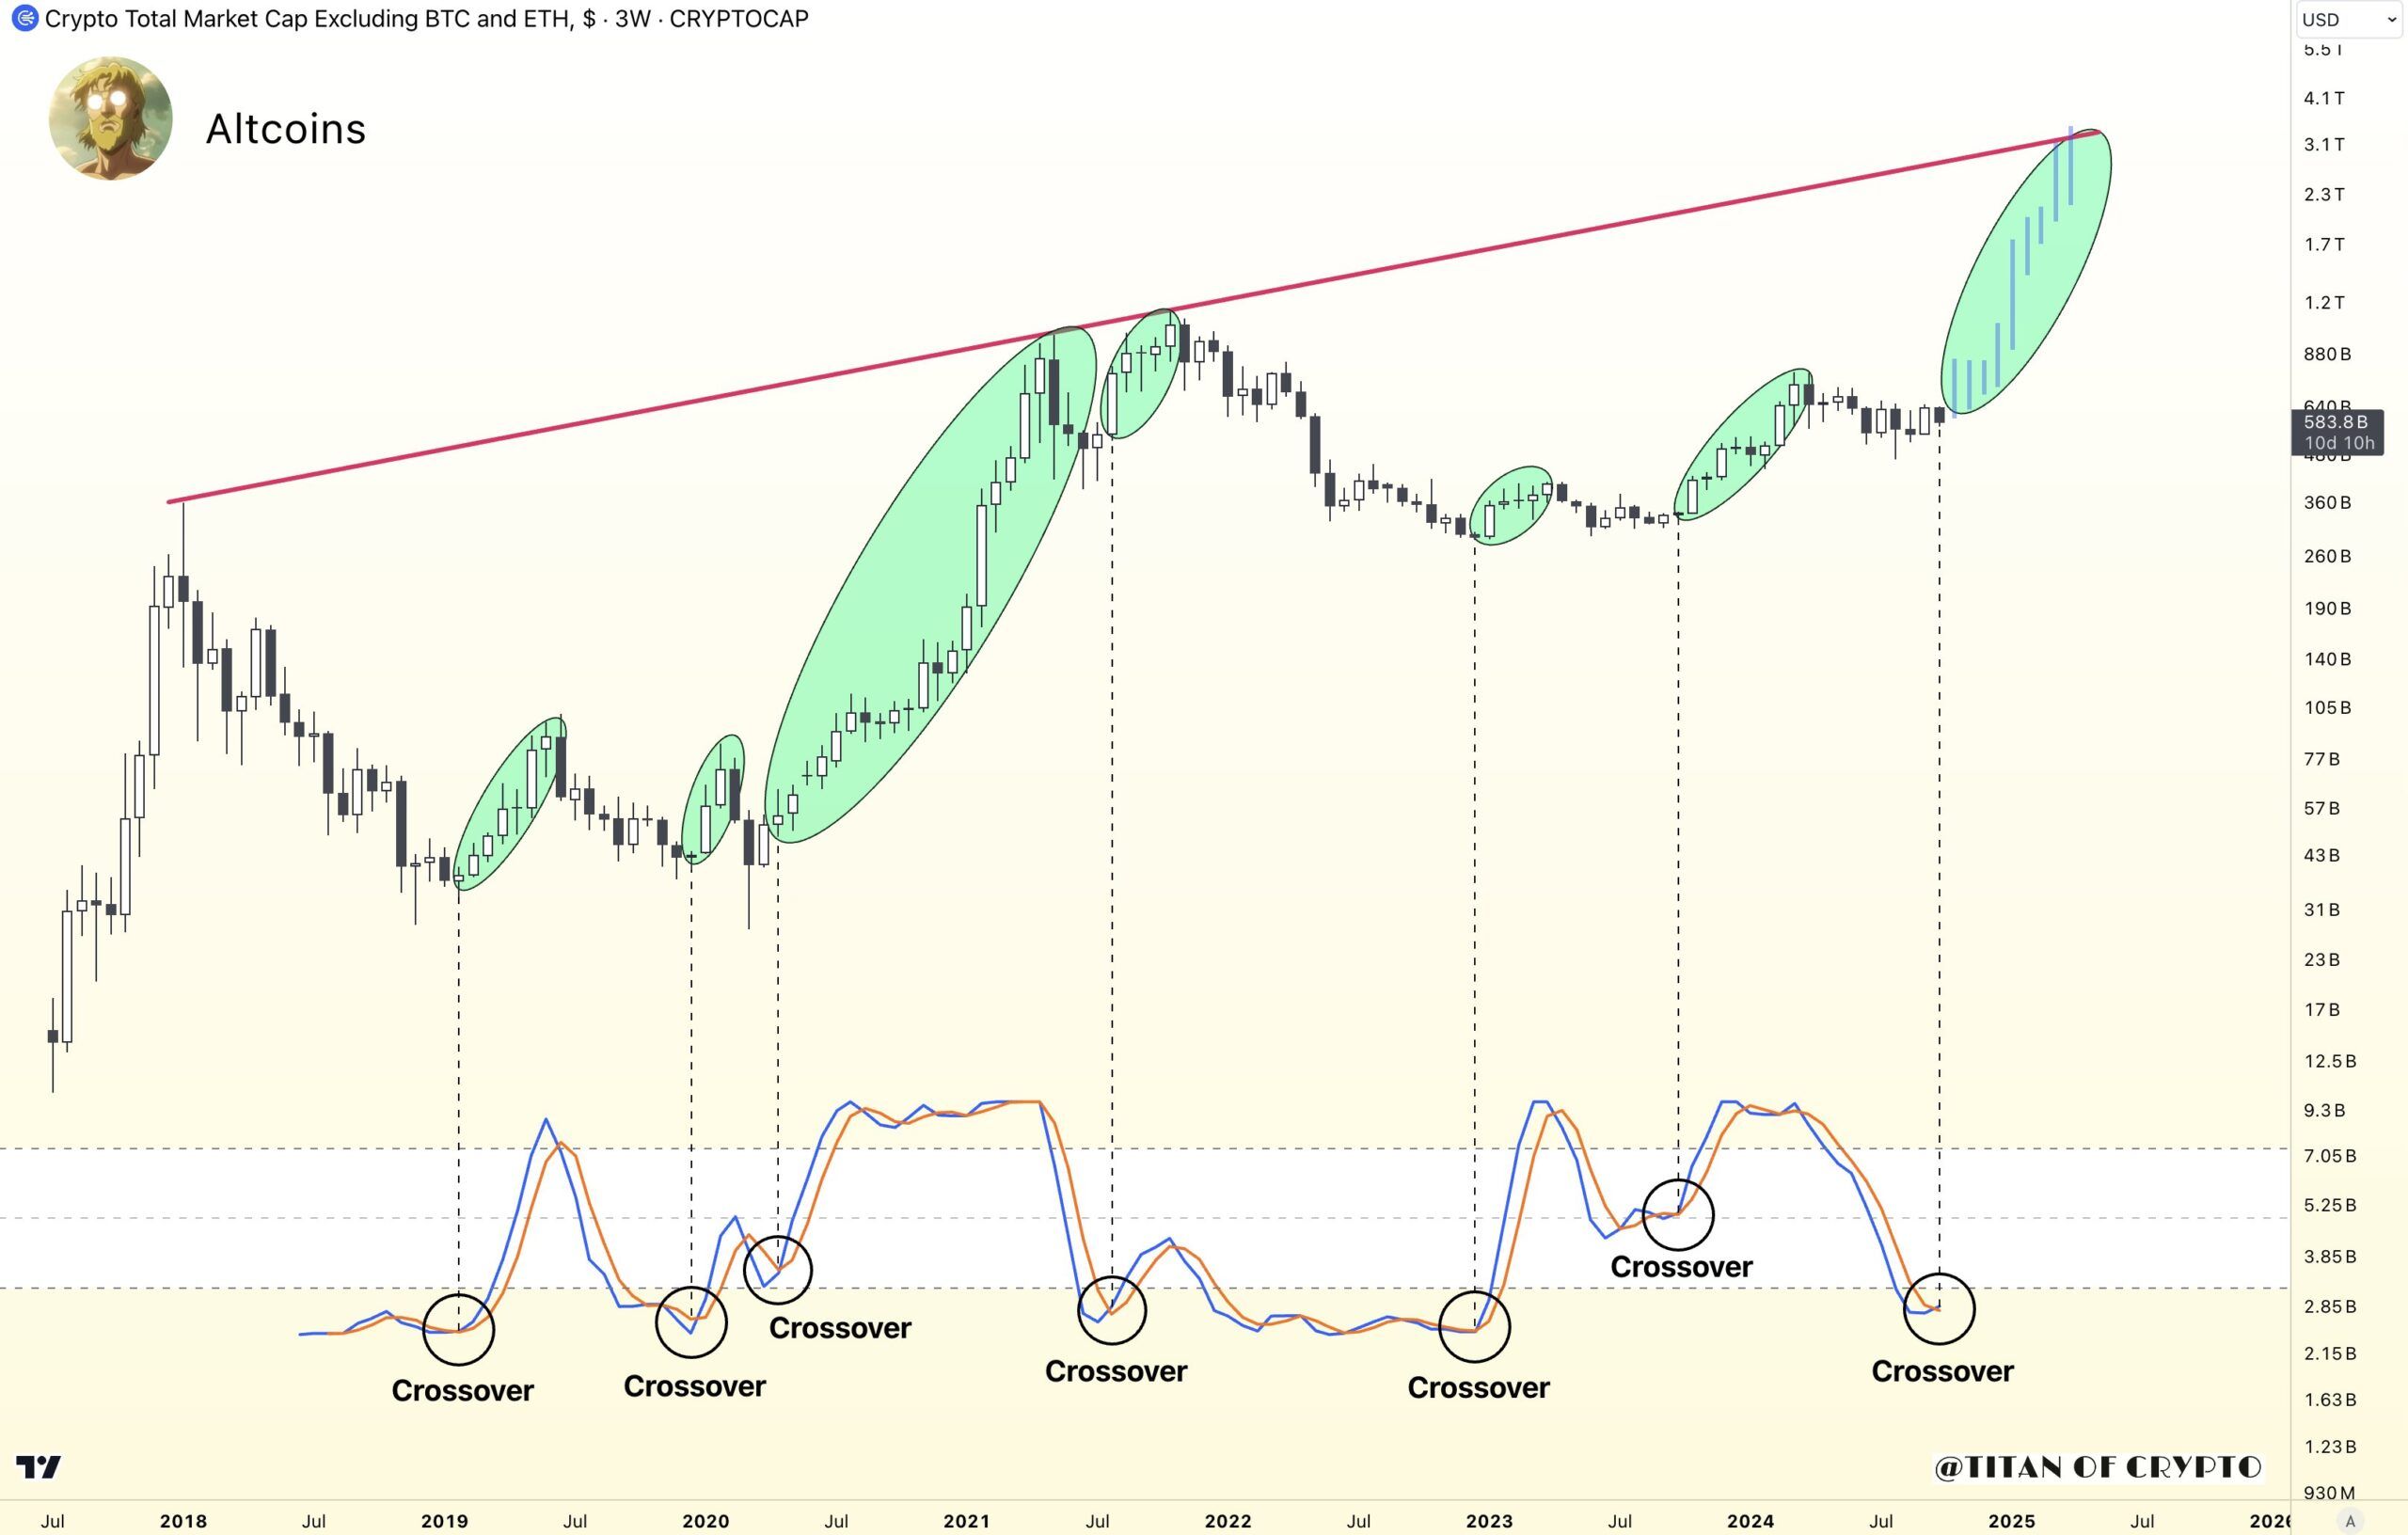
Another anonymous analyst also agrees with Mustache's view. In a recent post on X, Crypto Titan emphasized that the market's Stochastic RSI has formed a bullish crossover on the 3-week chart.
"Generally, when a bullish crossover forms on the 3-week Stochastic RSI, it is followed by a strong upward movement," added Crypto Titan.
The Altcoin Market is Showing Strength
The revival of the market is also evident in the momentum indicators of TOTAL2. For example, the Balance of Power (BoP), which measures the strength of buying and selling pressure on a daily chart, is at a positive 0.48.
A positive BoP value indicates that the buyers (bulls) are in control and suggests upward momentum. If this sentiment persists in the market, TOTAL2 could break above the $931.5 billion resistance and rise to $1.06 trillion.
Read more: 11 Cryptocurrencies to Add to Your Portfolio Before Altcoin Season
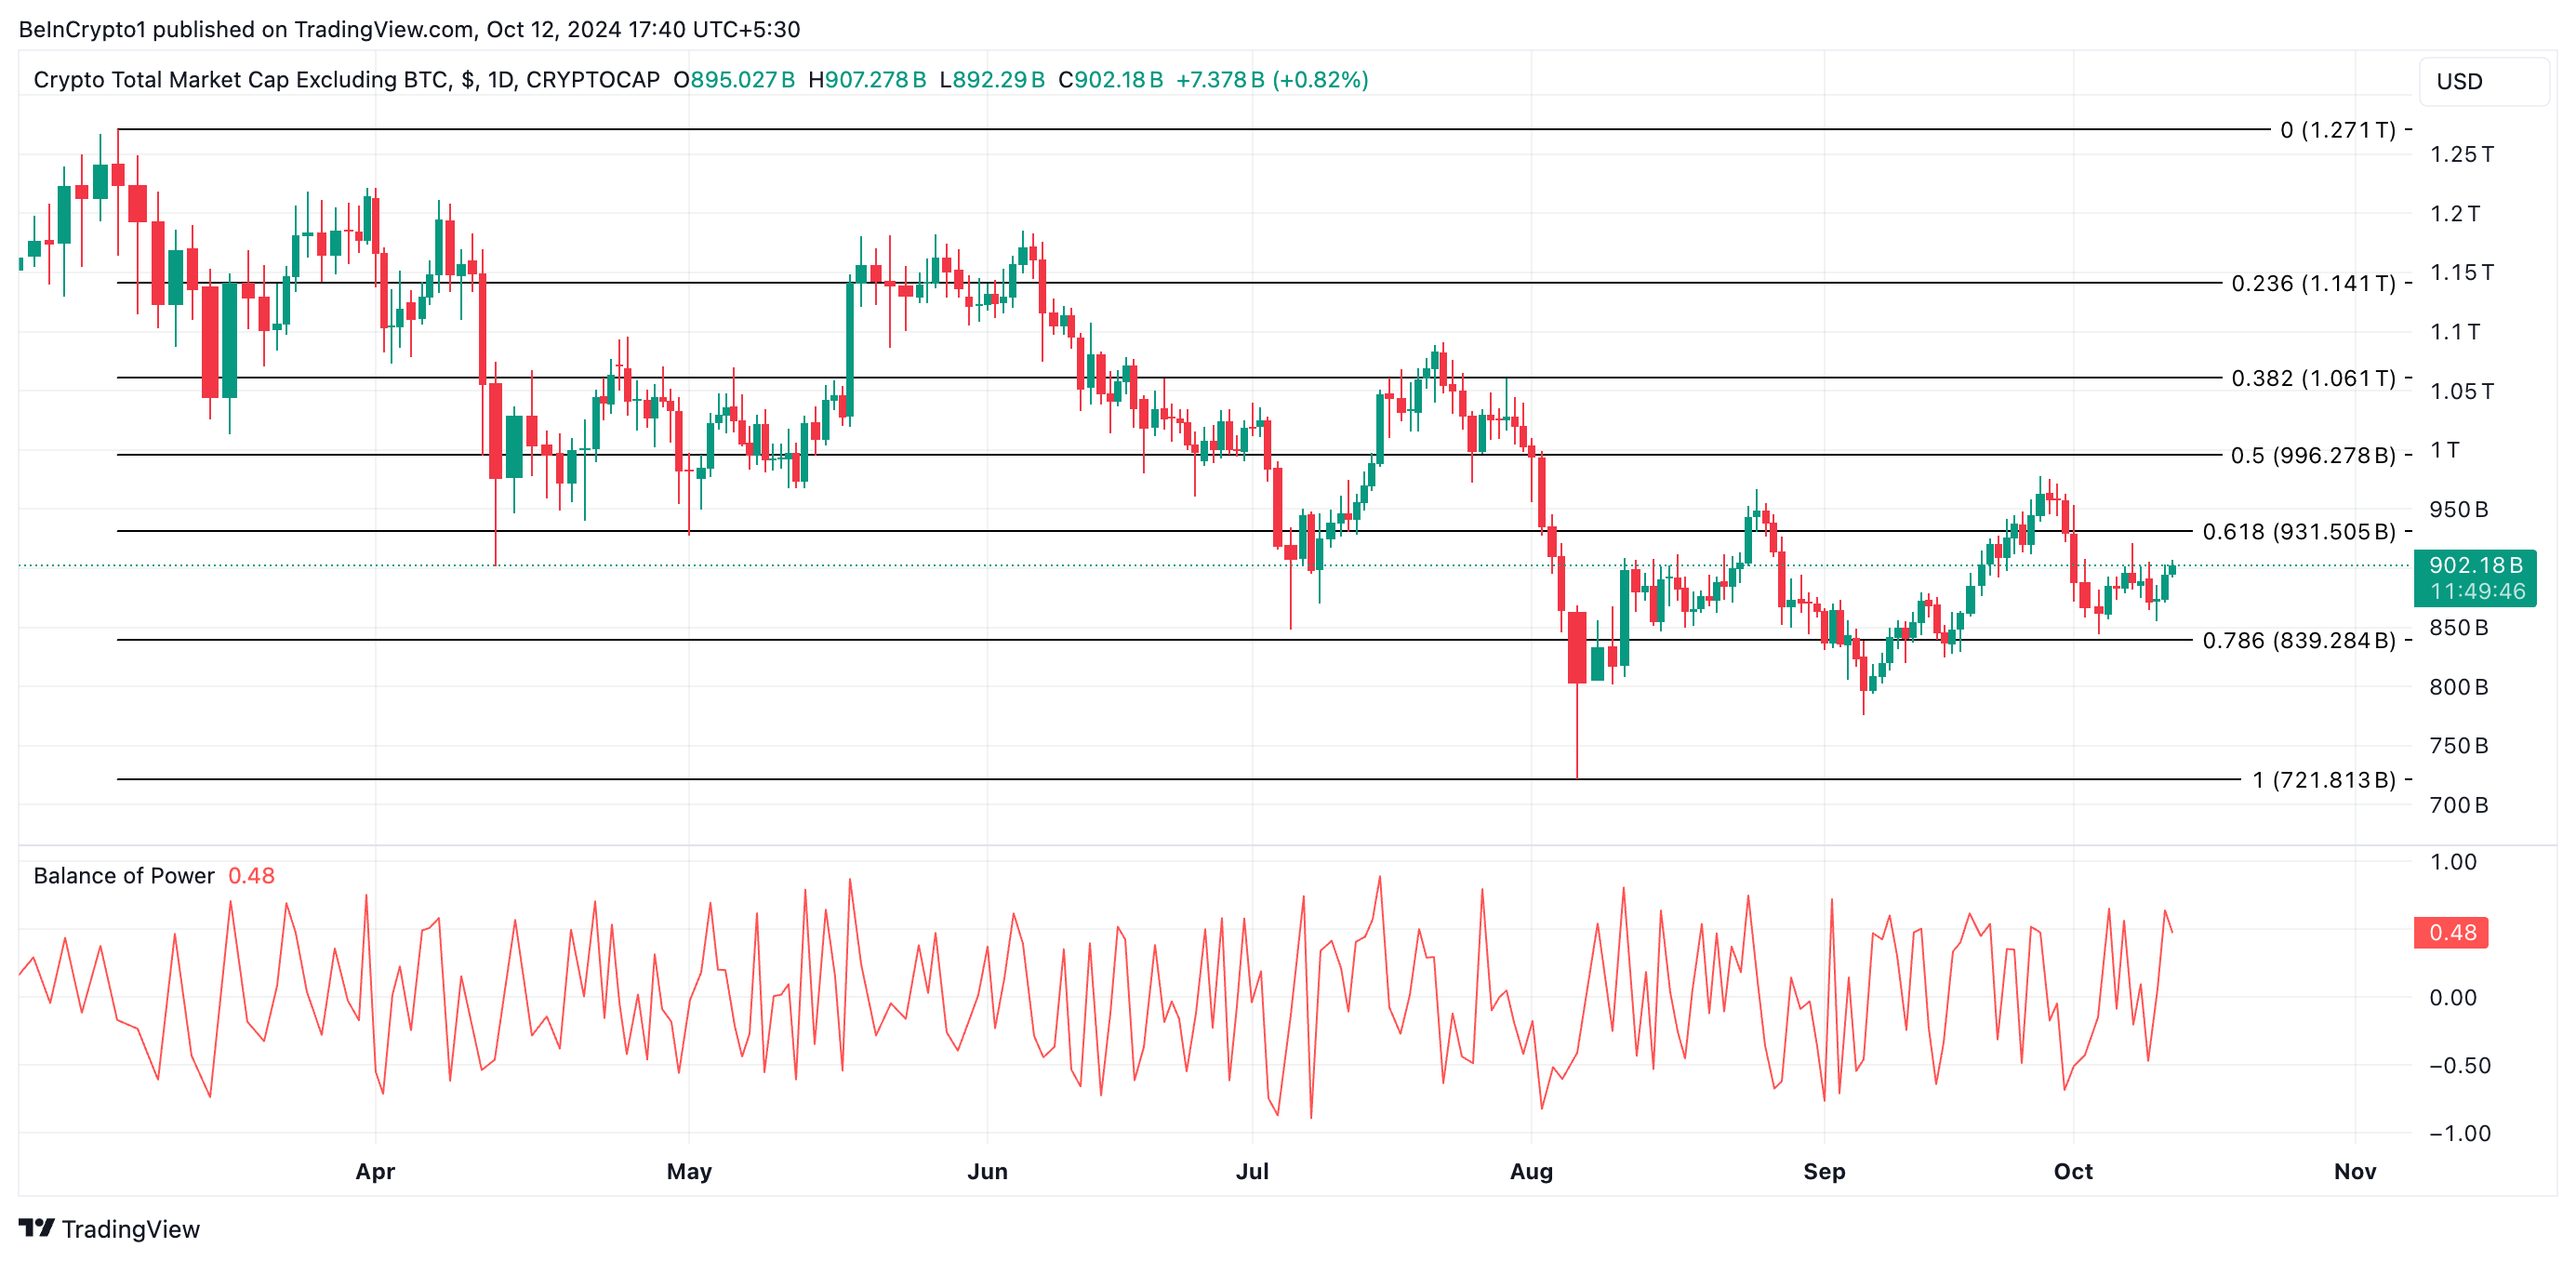
However, if Bitcoin regains dominance and diverts attention from altcoins, TOTAL2 could decline to $839.28 billion.


