Author: Omkar Godbole, CoinDesk; Translated by: Wuzhe, Jinse Finance
Summary
The "three-line break chart" of BTC indicates that the seven-month corrective trend has been resolved bullishly and is expected to set a new all-time high.
The candlestick chart shows resistance around $70,000.
Traders focused on the daily BTC candlestick chart may feel bored, as the price has been locked in a long-term directionless channel, despite a rise on Monday. However, a less-tracked "three-line break chart" now suggests a bullish outlook for a new all-time high.
According to CoinDesk Indices data, the leading cryptocurrency rose over 5% to $66,000, marking the largest single-day gain since August 23.
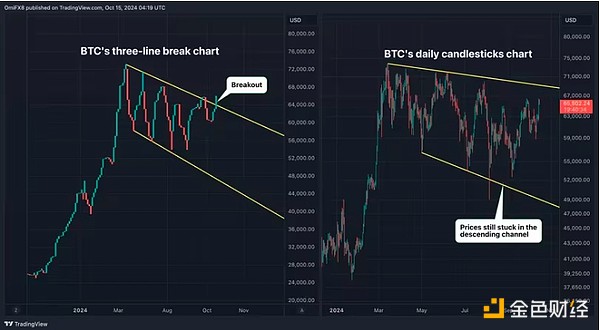
Nevertheless, the daily candlestick chart indicates a neutral outlook, as BTC remains trapped within a seven-month descending channel defined by trend lines connecting the highs of March and June and the lows of May and July.
However, the three-line break chart shows that the breakout from the long-term downtrend occurred on Monday, and the larger uptrend from around the October 2023 low of $30,000 has been resumed. A bullish victory could lead to a new high above $73,000.
The three-line break chart may look like a candlestick chart, but it focuses on price movements and trend changes, ignoring time, helping traders filter out volatile price fluctuations and noise while assessing the current trend and potential trend reversals.
"A Japanese trader described the three-line break chart as a more subtle form of a point-and-figure chart, where reversals are determined by the market, not arbitrary rules, meaning we can tune it to the strength and vitality of the market," says chartered market technician Steve Nison in his book "Beyond Candlesticks".
The three-line break chart consists of vertical blocks called lines or bars (green and red). A bullish reversal occurs when the price rises above the highest point of the last three red lines, represented by a new green bar. A bearish reversal occurs when the price falls below the lowest point of the previous three green lines, represented by a new red line.
Bullish continuation occurs when the price rises above the previous green lines, confirming the continuation of the established uptrend. This is precisely what happened on Monday, with the green bar breaking through the trend line connecting the March and April highs, as shown below.

BTC's three-line break and candlestick charts. (TradingView)
While the breakout on the three-line break chart suggests a rally to new highs, traders should note two things: first, the candlestick chart, which shows that the bulls have failed to firmly hold above $70,000 since March. The price may encounter strong resistance around this level again.
The second thing to watch for is a bearish invalidation of the bullish breakout on the three-line break chart, represented by a new red bar, which would pull the price back into the channel. Failed breakouts often lead to further downside, as observed in late September.


