

Author: Shang2046
The market, project, cryptocurrency and other information, opinions and judgments mentioned in this report are for reference only and do not constitute any investment advice.
BTC is expected to end the longest high-volatility period in history, and maintaining patience is the best strategy to welcome the second half of the bull market
Market of the week
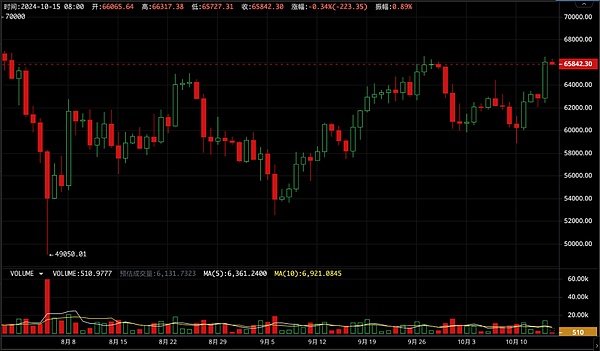
This week, BTC opened at $62,811, and as of the early morning of October 14, it hovered around $62,500, recording a weekly Doji with a range of nearly 9%. In the afternoon of Monday, BTC quickly surged to around $64,500, and then broke through the 66,000 mark in the evening.
Ignoring the rapid movement on Monday, BTC's overall performance in the past week continued the relatively weak trend that has been in place since the beginning of October. This is consistent with the net capital outflow from the crypto asset world in October. During the same period, the monetary policies of the two superpowers, China and the United States, have undergone huge changes, which has also had a certain impact on BTC.
On September 23, China issued what may be the most intense market rescue policies for the stock market and real estate industry in history. The market tends to believe that this is related to the 50-basis-point rate cut initiated by the United States in the previous week. Within two weeks after China's market rescue policy, the United States subsequently announced strong employment data and relatively neutral inflation data, and the market quickly changed its expectation of the Federal Reserve's continued 50-basis-point rate cut to 25 basis points, and some institutions even believe that a no-rate-cut scenario cannot be ruled out. This has cast a shadow on Bitcoin, which is negatively correlated with the US dollar.
BTC's recent bull market is highly correlated with the US stock market, especially the Nasdaq, and as the spot ETF is directly linked to the two, the recent market trend is also highly related to the capital inflow and outflow of the ETF.
A recent article by BlackRock pointed out that the market tends to draw an analogy between BTC and US tech companies, but this clearly misunderstands the special asset attributes of BTC. In the medium and long term, the situation of BTC being "dragged" by the US stock market must be broken out of.
Looking back to the crypto asset world, after 7 months of high-volatility adjustment, BTC has established solid support in the current range, and the chips have also been fully washed, so once the second half of the bull market is launched, it will see rapid development.
Federal Reserve and economic data
On October 10, the US announced a CPI year-on-year rate of 2.4%, slightly higher than the expected 2.3%. On October 14, the US announced that 254,000 new jobs were added in September, higher than the expected 147,000, and significantly revised up the employment data for July and August.
The continued escalation of conflicts in the Middle East has also increased the risk of a rebound in inflation. As Federal Reserve officials continue to turn hawkish, the market has ultimately lowered the magnitude of rate cuts for this year, and the current FedWatch probability is highest for two 25-basis-point rate cuts.
Accompanied by the decline in the magnitude of rate cuts within the year, the US dollar index has rebounded strongly, rising to 102.89. Currently, the various parties in the market are gradually pushing the stock index to rise slowly under the expectation of a "soft landing", with the Nasdaq approaching its previous high, and the Dow Jones and S&P 500 reaching new highs. After adjusting, gold has started to stabilize and rebound, with London gold rising 0.17% for the week. Government bonds have been sold off again, with the 2-year yield rising to 3.953 and the 10-year yield rising to 4.073.
Stablecoins and ETFs
This week, capital overall showed an outflow, with a loss of $330 million, mainly due to the withdrawal of funds from the USDC channel. Specifically, USDT inflow was $65 million, USDC outflow was $750 million, resulting in a net outflow of $687 million from the stablecoin channel. The ETF channel contributed positive capital inflows: there were two trading days with large inflows in the 5 trading days, with a net inflow of $357 million for the whole week.
The large outflow of on-chain capital is the main reason why BTC broke through $60,000 again this week, but with the support of the Nasdaq's rise, the capital inflow into the ETF channel allowed BTC to recover to the $63,000 level after falling below $60,000. The rapid breakthrough on Monday was also directly related to the $470 million inflow into the ETF on the 14th.
Supply analysis
After a brief "short-to-long" movement the week before last, this week saw a return to "long-to-short" movement. We previously analyzed that the second round of chip dumping by long-term holders after they have re-accumulated positions is one of the main signs of the start of the second half of the bull market.
The cost basis of short-term investors is currently around $62,500, and the price with the largest chip accumulation is $61,800. The BTC accumulation on exchanges remains at a low level, within 3 million.
BTC on-chain data
The change in new addresses is not much, Transactions increased, active entities and transferred value are rising, entering an expansionary phase in the medium term. Bitcoin mining power is operating near historical highs.
Ecosystem analysis
The active addresses and new addresses in the Ethereum ecosystem are entering an expansionary phase, and Transactions have hit a new high, driven by Layer2 Base.
Solana's new addresses and Transactions have remained at high levels, with the 30-day average reaching a new high, and active addresses remaining at historical highs.
Cycle indicators
The EMC BTC Cycle Metrics indicator is0.25, and the bull market signal needs to be further activated.


