

For the first time since July, the price of the Book of Meme (BOME) has recorded $0.011. This happened after the Solana meme coin price increased by 62% over the past 7 days.
However, this is not all. The recent uptrend of BOME shows no signs of slowing down, and key indicators suggest this could be the start of a much bigger breakout.
Book of Meme Records Highest-Ever Speculative Activity
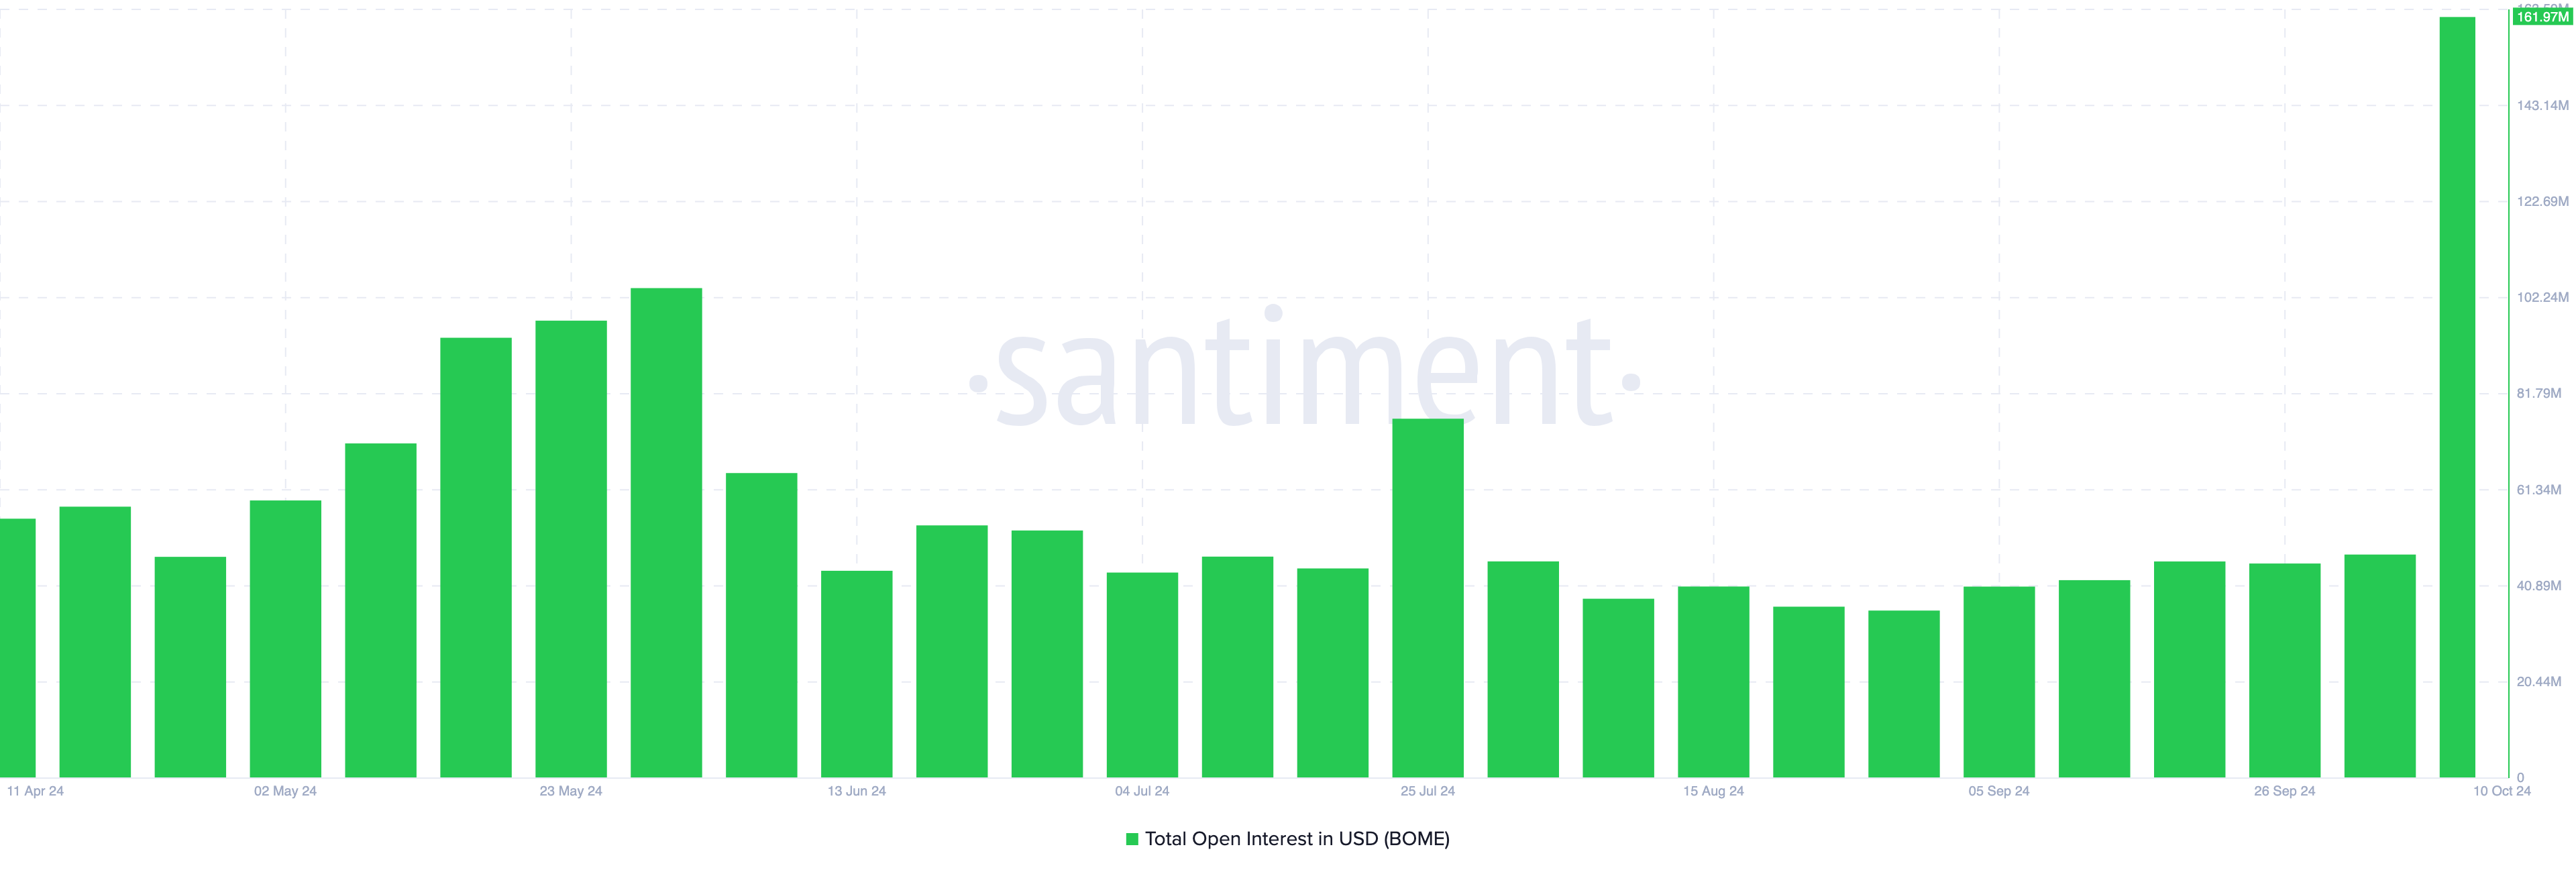
BOME is attracting attention not only for its price but also for its Open Interest (OI). According to the crypto online data platform Santiment, the token's OI hit a new all-time high of $161.97 million. This surge in OI alongside the remarkable price increase is a key indicator of speculative activity in the derivatives market, suggesting growing investor interest in the meme coin.
In simple terms, Open Interest (OI) represents the total value of active contracts in the market. An increase in OI means traders are taking on more exposure to the cryptocurrency and adding more liquidity to the contracts.
Conversely, a decrease in OI signals positions are being closed and capital is being removed from the market. In the case of the Book of Meme, traders have opened more contracts, indicating increased buy-side pressure in the derivatives market and fueling BOME's impressive price momentum.
Read more: How to Buy Book of Meme (BOME) and Other Information
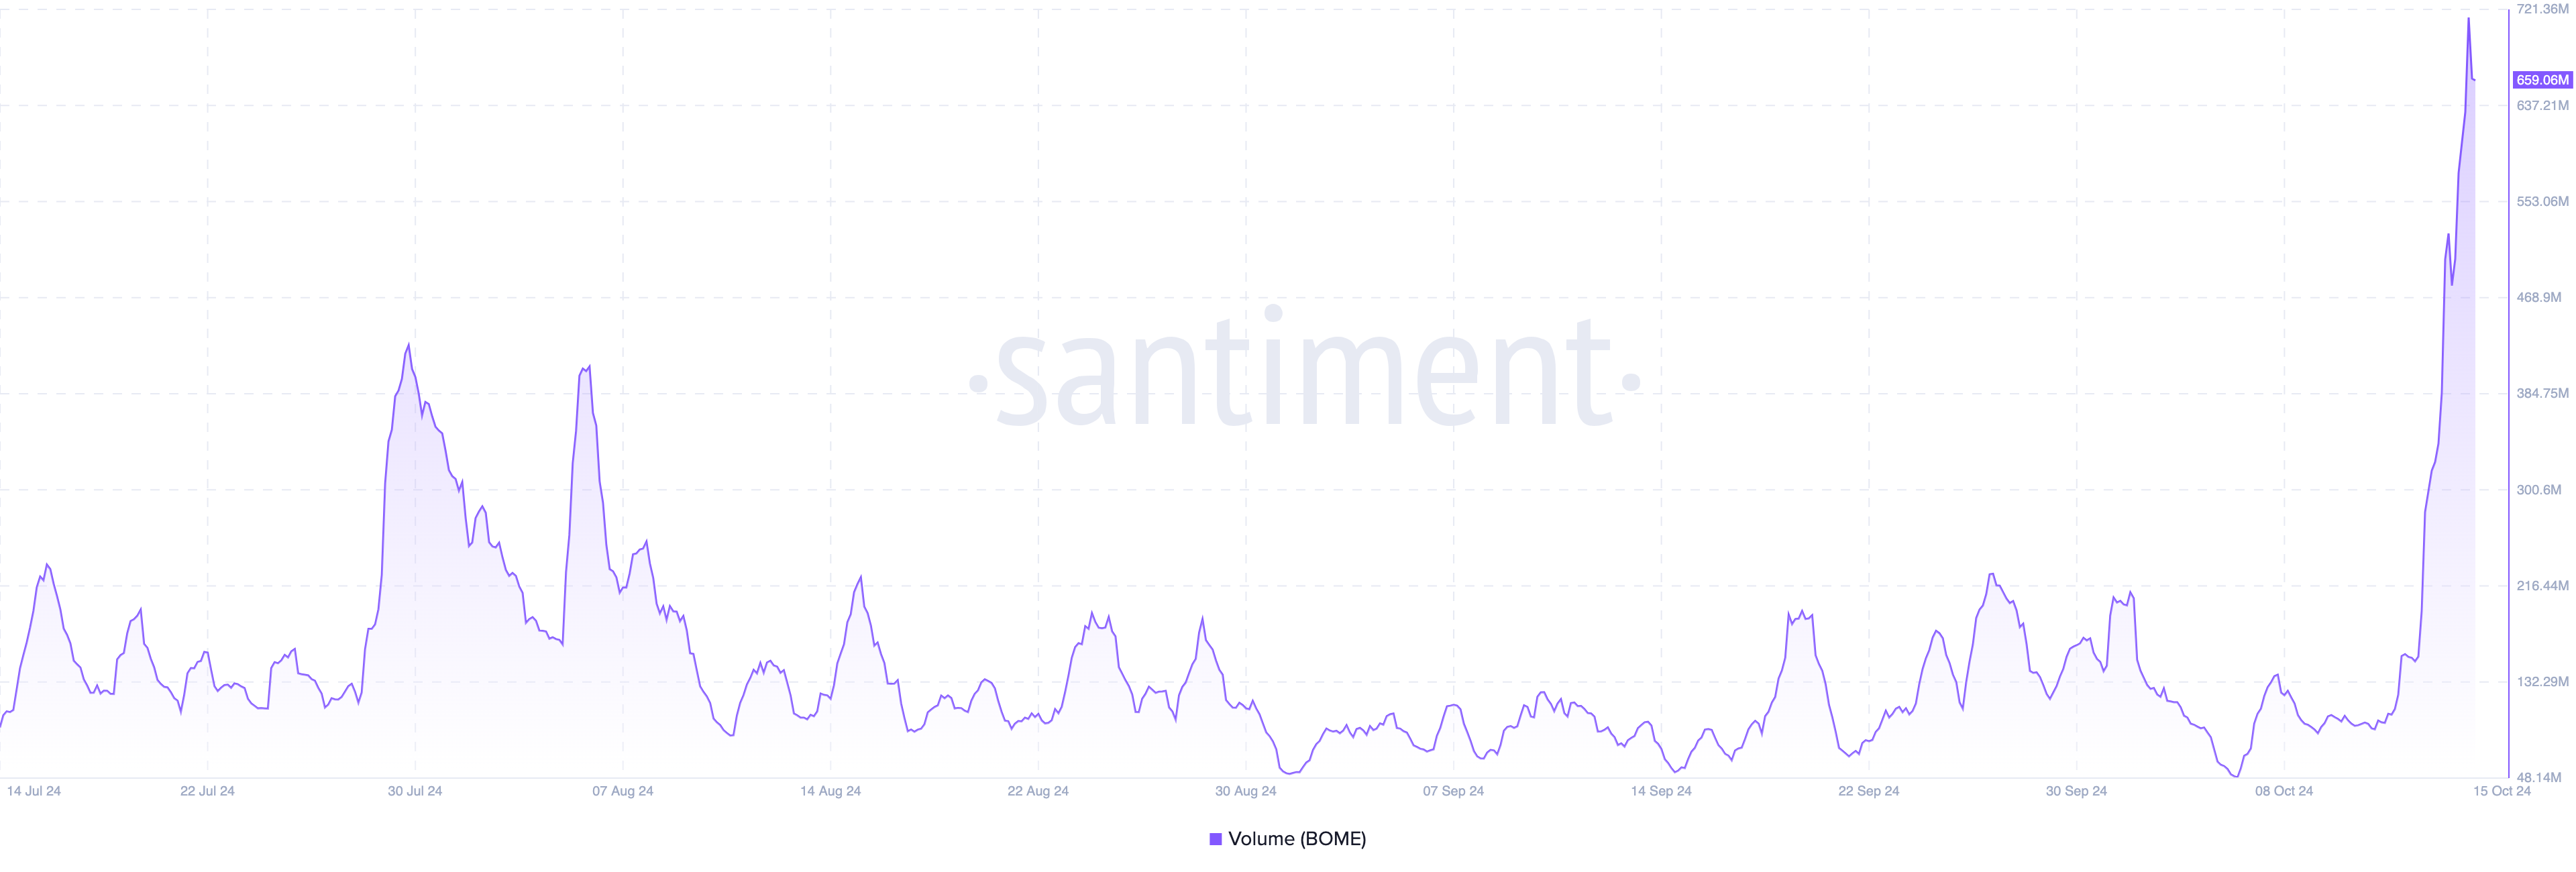
In addition to OI, the trading volume of BOME has also increased. The current volume stands at $659.06 million, the highest since May 23rd.
Trading volume represents the value of buy and sell transactions during a specific period. The rise in both price and volume suggests increased interest and liquidity, which often leads to further price appreciation.
Currently, BOME's price has increased by 20% in the last 24 hours. If this uptrend continues alongside the volume increase, the meme coin's price could soon surpass $0.11.
BOME Price Prediction: Potential for Further Upside
Looking at the BOME/USD chart, the meme coin has finally broken out of the descending triangle pattern formed in June. The descending triangle, characterized by a downtrend line and a horizontal support line, is a technical chart pattern, and this breakout suggests a potential shift in market sentiment, which could drive further upside momentum for BOME.
Typically, when the price falls below the support line of a descending triangle, a bearish trend is expected, but in this case, BOME's price has risen above the support line. This suggests a potential bullish reversal, and the token's value could see further appreciation.
Another important technical development is the state of the Exponential Moving Averages (EMAs). Specifically, the 20 EMA (blue) has crossed above the 50 EMA (yellow) for the first time since May, which could indicate that the bullish momentum for BOME is gaining strength.
Read more: Top 5 Best Book of Meme (BOME) Wallets to Consider in 2024
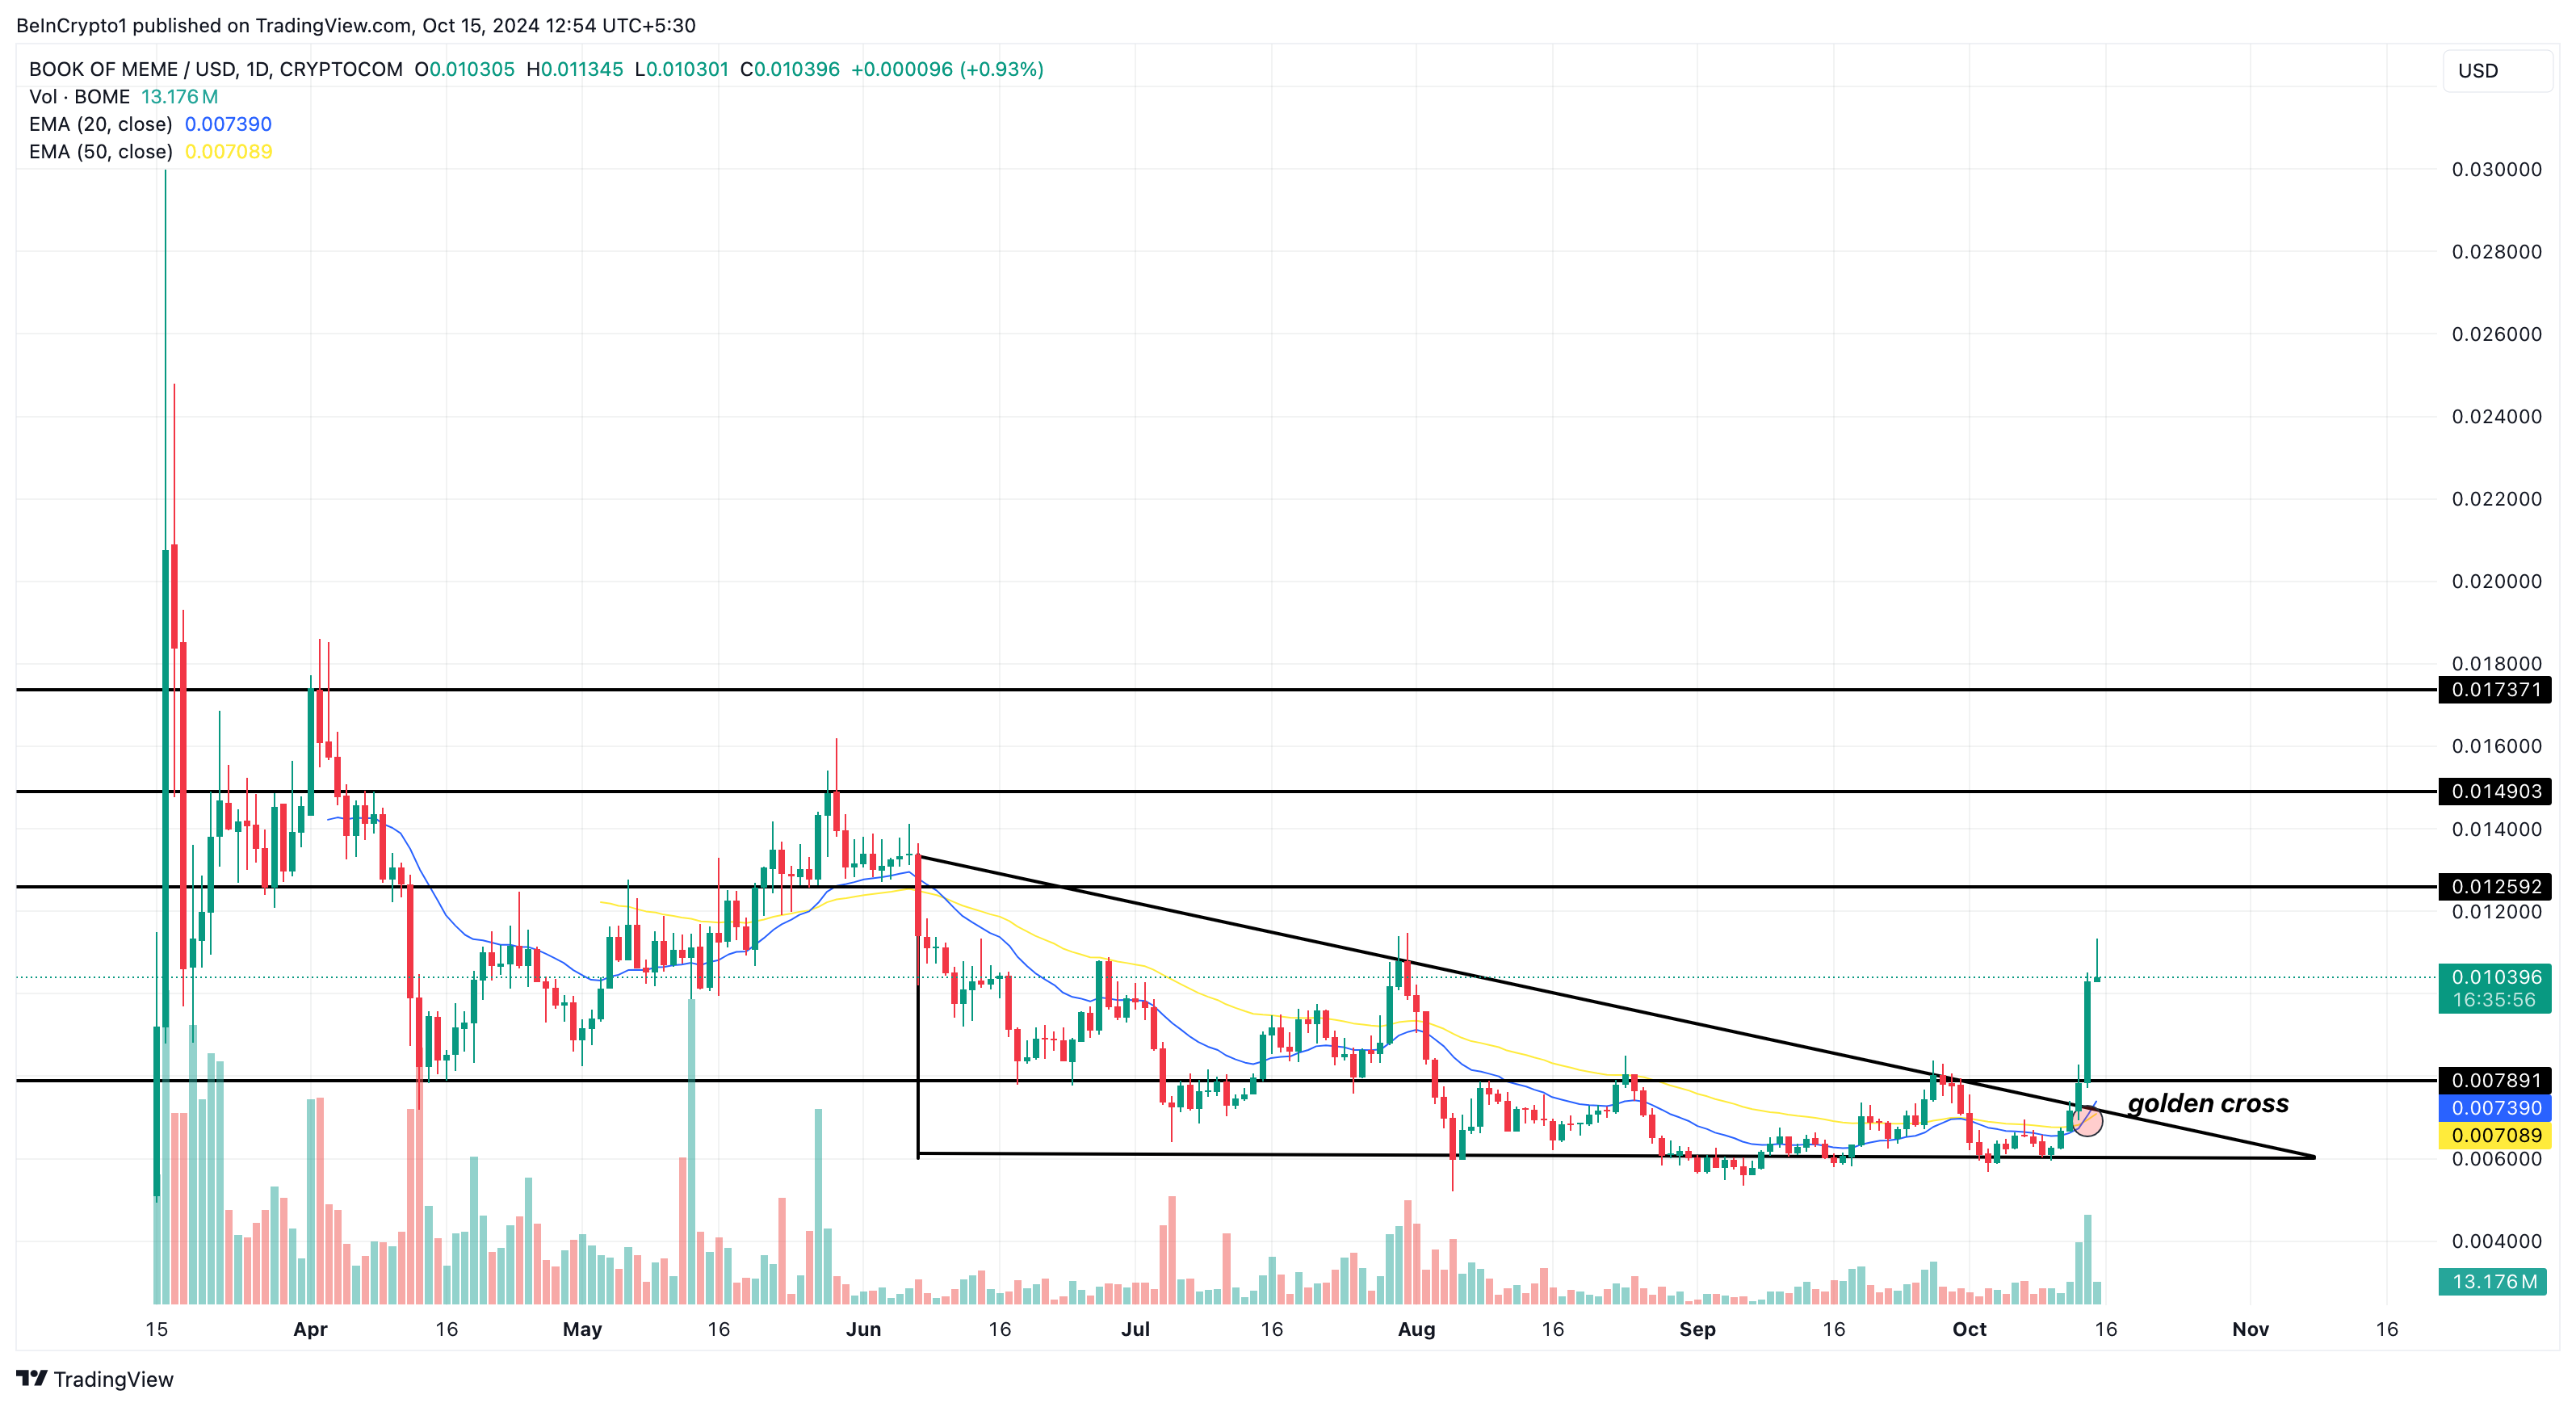
This position is generally considered a bullish signal, known as a "golden cross." If this state is maintained, BOME's price has a high likelihood of breaking through the $0.013 resistance level. In that scenario, the meme coin could surge to $0.015 or even $0.017.
However, traders will need to closely monitor the meme coin. If BOME fails to maintain its current momentum or profit-taking increases, this prediction could be invalidated. In that case, BOME could drop to $0.0079.


