

The Bit price has rebounded by more than 25% since hitting around $52,546 on September 6. On-chain data and technical indicators suggest that BTC may continue to recover and reach a new all-time high.
Table of Contents
ToggleBit open interest reaches all-time high
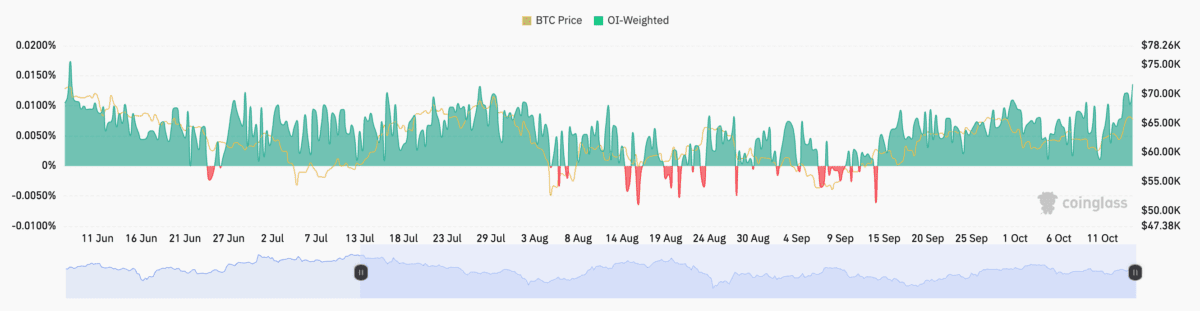
The weighted perpetual futures funding rate of Bit open interest (OI) has reached its highest level in several months, suggesting that the bullish sentiment in the market may continue in the short term.
According to data from CoinGlass, the current weighted Bit OI funding rate is 0.0136%, a level last seen on June 7, when Bit briefly reached $71,950. Positive funding rates usually reflect bullish sentiment in the market, but given the volatility of the crypto market, these data still need to be interpreted with caution.
Data from CryptoQuant shows that as of October 15, the total Bit open interest on the network reached a new all-time high of $19.7 billion, indicating that with more capital flowing into the market, there may be more price volatility in the future.
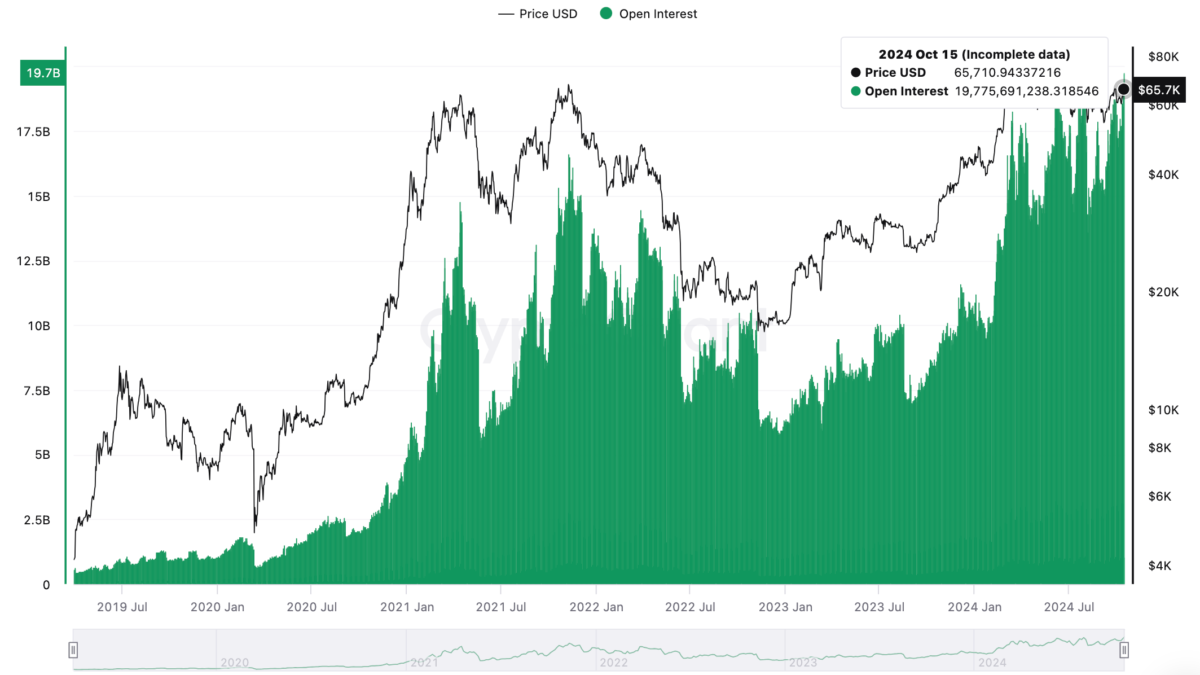
A CryptoQuant analyst posted on X:
"The upward trend in the derivatives market indicates a significant increase in liquidity, and the crypto market is receiving more attention. The rise in funding rates further confirms the bullish sentiment of traders."
While the increase in open interest indicates increased investor attention, this does not necessarily mean bullish, as long and short positions in the futures market always match. The increase in open interest will bring market volatility, not a clear price direction.
Bit exchange supply continues to decline
According to CryptoQuant data, the supply of Bit on exchanges has decreased significantly and reached the lowest level in nearly five years.
As of October 15, the amount of Bit held by centralized crypto exchanges was around 2.68 million, down 20% from the historical high of 3.37 million in July 2021. This coincides with a 55% increase in the Bit price since the beginning of the year.
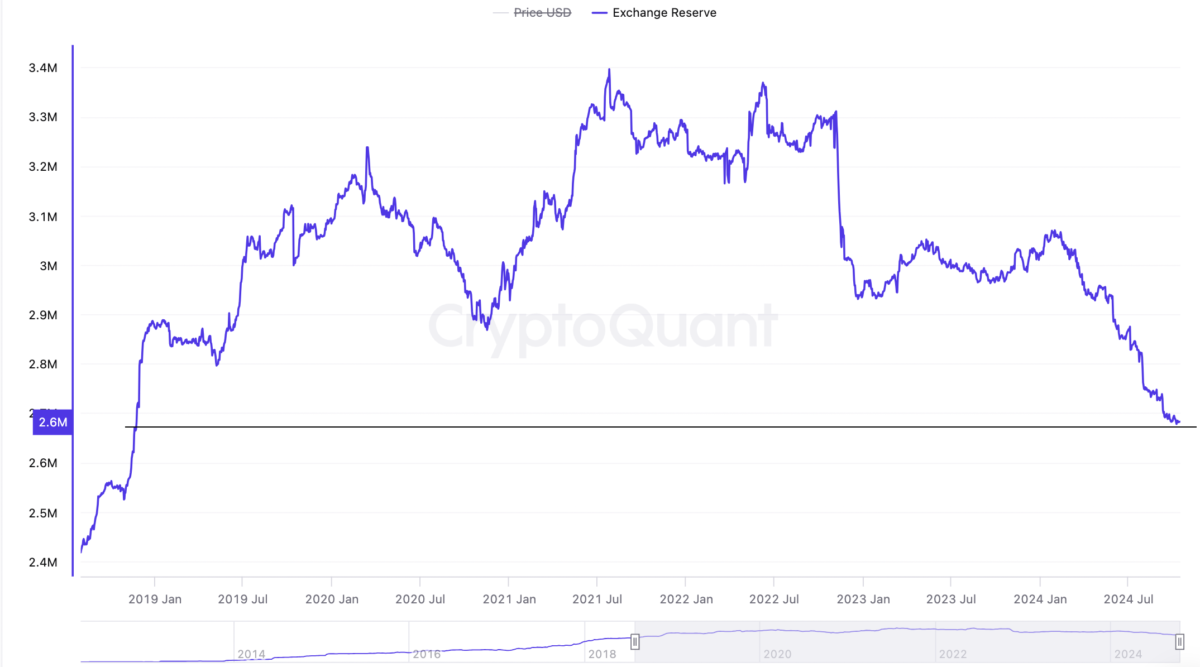
The decrease in exchange supply indicates that traders are more inclined to hold Bit rather than sell it for fiat or other digital assets. This also enhances the potential for Bit to continue its bull market in 2024.
Spot Bit ETF demand rises
Demand from institutional investors continues to drive Bit prices, as they continue to pour capital into Bit spot ETFs. According to data from SoSoValue Investors, Bit spot ETFs in the US recorded net inflows on four out of the past seven trading days, indicating that institutional investors' interest in these investment products continues to grow.
On October 14, these investment products recorded their highest single-day net inflow since June 4, with over $558 million in inflows.
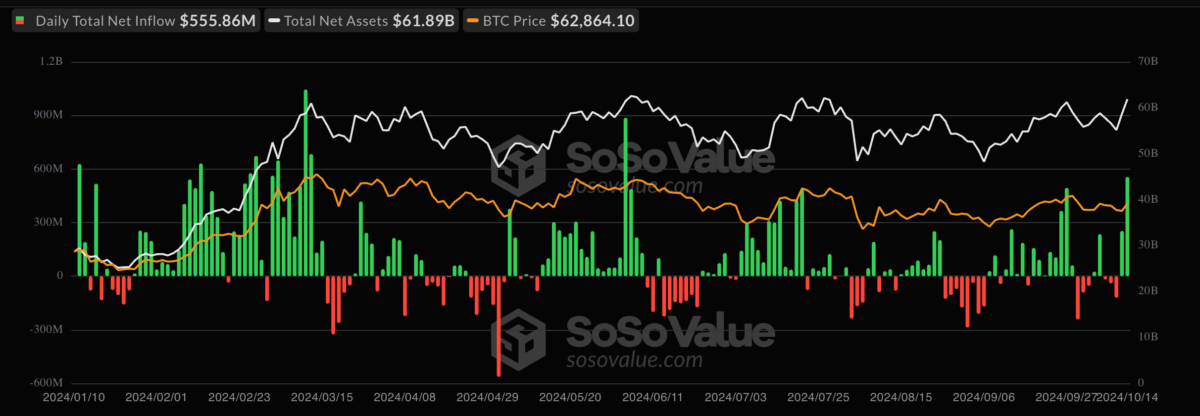
ETF Store president Nate Geraci called it a "bumper crop day" for Bit spot ETFs on X, and added that the total net inflows into these ETFs over the past 10 months have approached $20 billion, far exceeding all expectations.
"This reflects the ongoing adoption process by investment advisors and institutional investors."
Bit RSI suggests price could reach $233,000
Bit prices have remained below the 2021 all-time high of $69,000 for the past four months, but the monthly Relative Strength Index (RSI) suggests a potential rebound in the coming weeks.
On October 14, independent analyst Bitcoindata21 posted a Bit analysis on X, applying standard deviation to the monthly RSI, suggesting that Bit prices could reach around $233,000 at the current bull market peak. The analyst cited historical highs in the monthly RSI, which often correspond to cycle peaks in Bit prices. Bitcoindata21 wrote:
"So the question is, do you think the chances of the monthly RSI reaching 88-90 are high? If you think the answer is yes, then why is a $250,000 target price impossible?"
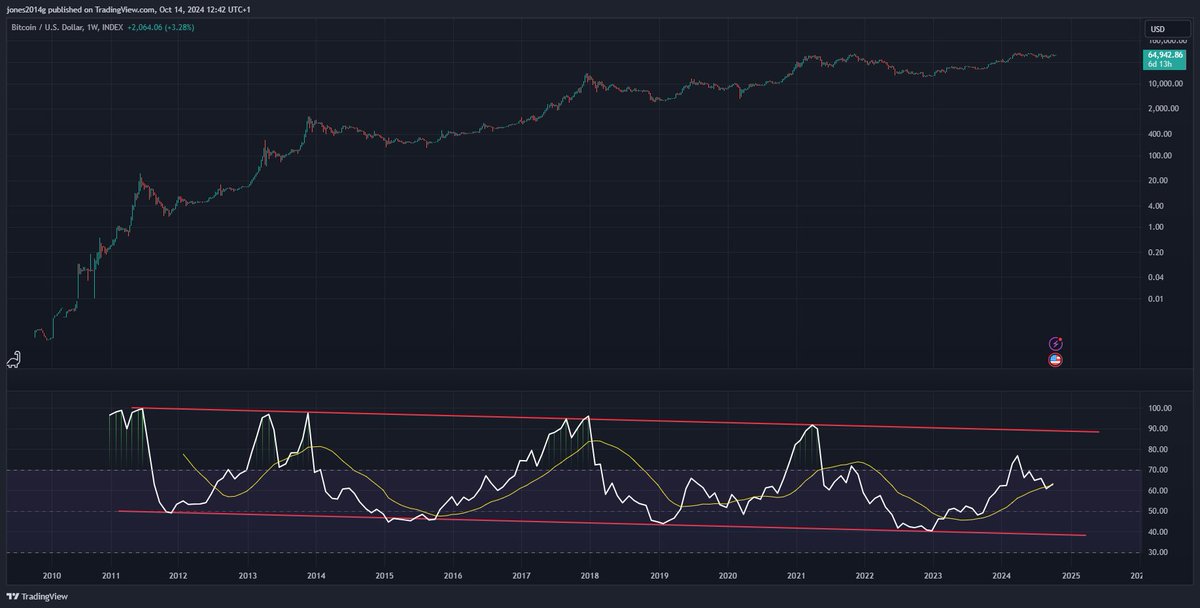
The analyst stated that Bit prices could potentially reach this level as early as the first quarter of 2025.
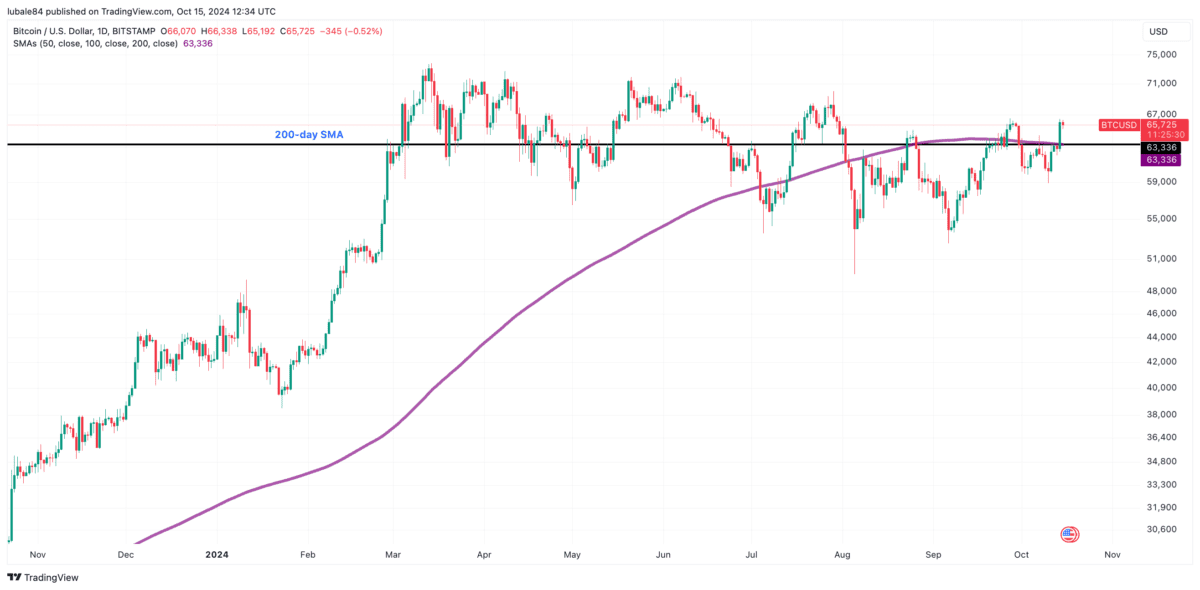
Bitcoin Finds Strong Support Above the 200-Day SMA
On October 14, the price of Bitcoin broke through a key technical level, the 200-day Simple Moving Average (SMA), currently at $63,335, driving a broad market recovery.
Previous attempts to reclaim this level have failed to ignite a more significant price uptrend. Notably, Bitcoin's price has seen parabolic rises after breaking above the 200-day SMA on three previous occasions. At the time of writing, Bitcoin's price has firmly established itself above this critical technical support.
Data from IntoTheBlock shows that the 200-day SMA is within a demand zone between $61,770 and $63,728, where around 2.5 million addresses have purchased approximately 1.1 million BTC.
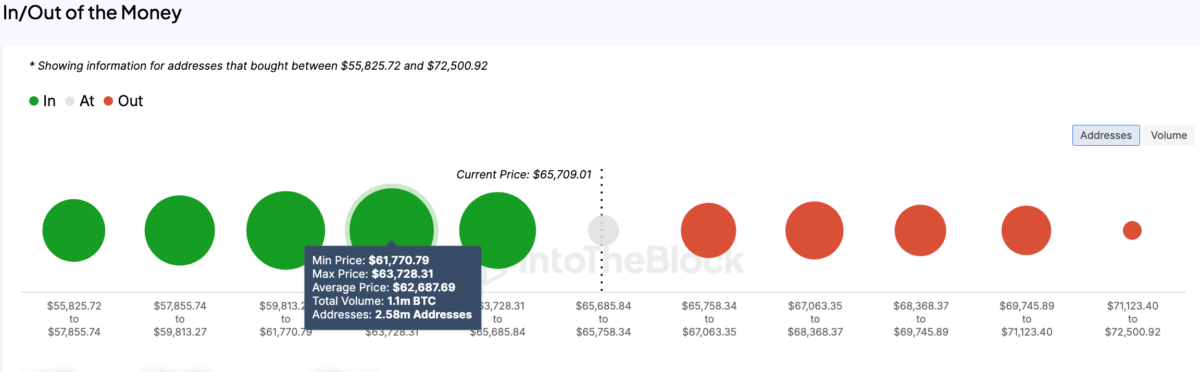
The chart also indicates that Bitcoin's current support is relatively strong, while the resistance on its recovery path is weaker, suggesting a clear path for Bitcoin's upward movement.


