On the evening of October 21st, BTC broke through upwards, officially breaking through the 69,000 mark, reaching a high of $69,500. The entire weekend, BTC was basically in a sideways state, with lack of liquidity. Why did a surge suddenly appear during the US market time on Sunday? Was this surge driven by futures or spot buying?
Recently, there have been frequent positive news about altcoins, starting from APE, to DYDX, SUSHI, and after the positive news was released, many altcoins saw an increase of more than 20%. The bottom altcoins have gradually shown some movement. Can the metaverse sector that led the altcoin bull market in October last year lead the altcoins to another bull market this time? Has the bull market really returned this time? Let's take a look at the views of the traders from various angles.
Technical Analysis Camp
@leon_li2

Looking at the candlestick chart, BTC seems to have broken through the downward trend line of the past half year, and it seems to be setting new highs every day, but the trading volume of the new highs has shrunk significantly. On the other hand, ETH has broken through the previous high, but it has just reached the real resistance zone around $2,800. ETH's gains yesterday brought high market sentiment, and the contract price was higher than the spot price for the first time, so I think the bull market is in the late stage, and the building is about to collapse.
Many people compare the current situation with October 2023, believing that both have a weekly MACD golden cross and a weekly green candle breaking through the previous high. However, I believe that the current market sentiment and the market sentiment at that time are completely different. At that time, it was a consensus to be bearish, but now it is a consensus to be bullish. I don't think the MACD golden cross here has any practical operational significance, because it can immediately turn into a death cross after the golden cross. Who is right and who is wrong, let's see if it will replicate the 2023 situation and continue to set new highs this week.
As for when I will stop being bearish, it will probably be when ETH effectively breaks through $2,820 after consolidation. Currently, I do not have a short position, I am looking for the right timing to short on the right side.
@Crypto_Painter_X
From the ASR-VC4 hourly channel, the current price behavior is a bit similar to the pattern at the end of September, continuously executing around the average pressure band, which may be either accumulating strength or exhausting momentum. From the perspective of spot premium, this is a bit like the situation in early June, a long-term bullish trend under negative premium. The key price level for determining the full transition to a bullish trend channel is 71,000. If it breaks through the average pressure area strongly, the first target may be around the overbought line, which is currently around $77,500.

@Patrade_Buer
From the weekly perspective, the market is continuing the upward trend. Currently, bsl is waiting to be plundered. This upward trend must break a new high, and my initial target is to see 9 digits. Currently, it is still within the range (within the oscillation range, the fvg gap is generally filled), pay attention to whether there is a wfvg opportunity, which is around $64,500.

From the daily perspective, it is continuing the oscillating upward trend, mainly waiting for the bsl to be plundered. If BTC has a pullback opportunity, it will probably be around $645, and it must be bought.

From the hourly perspective, it is oscillating upwards, continuously creating new highs. If it pulls back without breaking the ob, it can be traded long within the day. If it falls below the ob, you can expect a pullback buying opportunity.

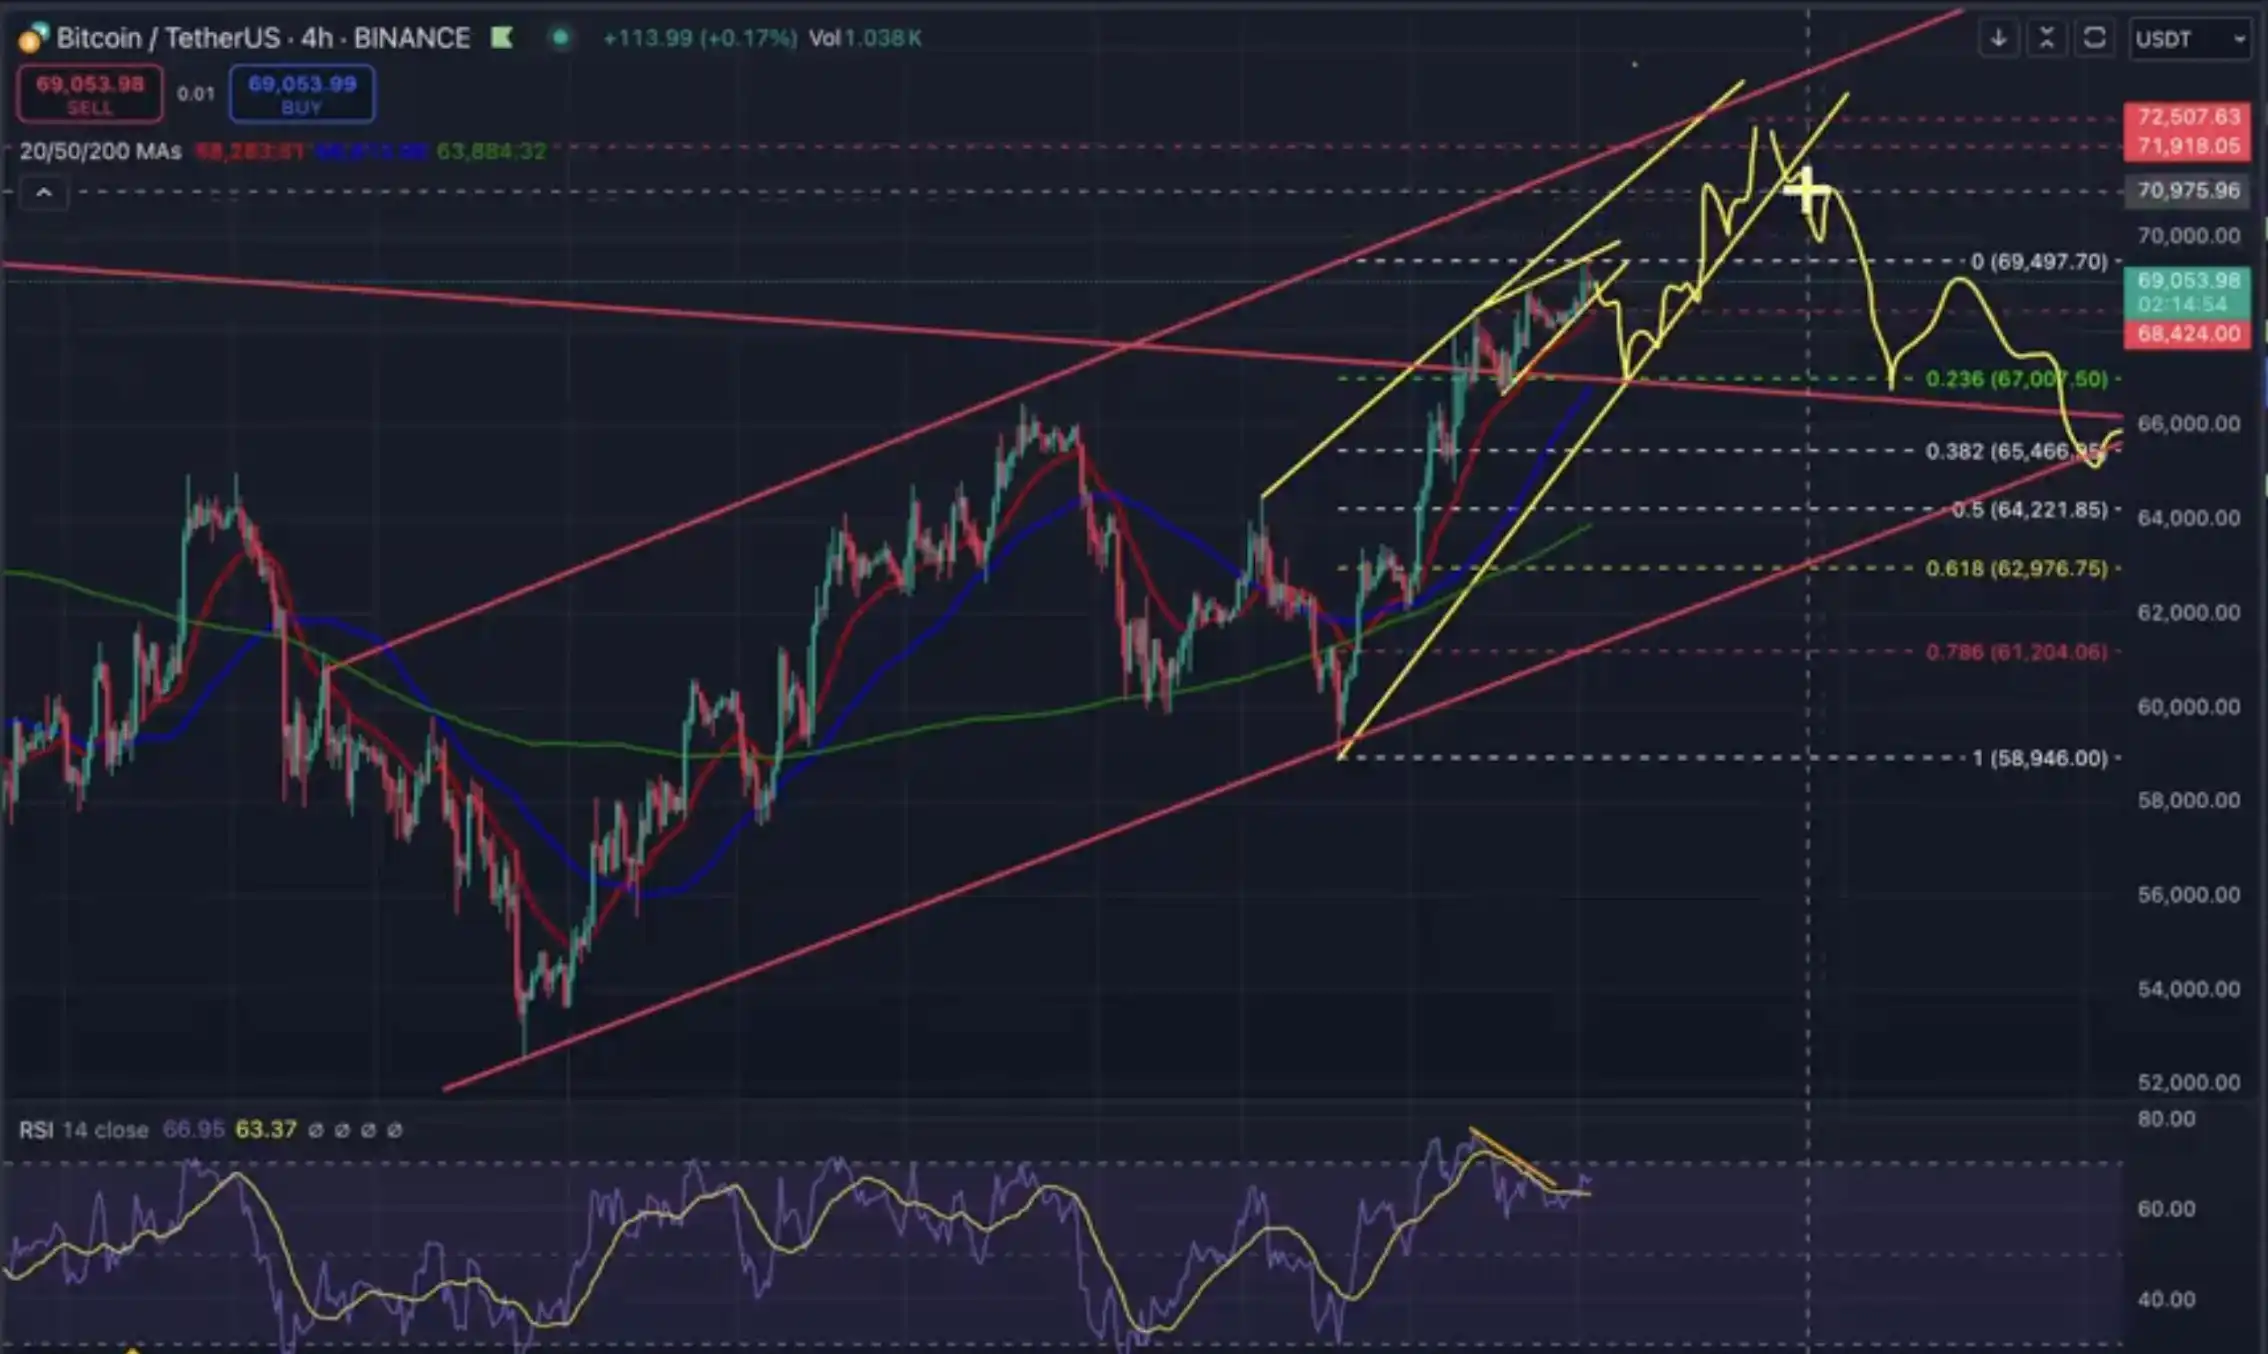
First, it is believed that the downward trend line of this round of the big cycle has been broken through, and the retracement has been successful, forming a bearish rising wedge pattern at the small level, and it is believed that the short-term will be weak, falling back to retest the downward trend line of the big cycle and the 0.236 Fibonacci retracement level of this round of the trade war, which is roughly around $67,000, forming a large-scale rising wedge pattern, and the first target of this round of the upward movement is still around $72,000.
Data Analysis Camp
@Kbeast.eth

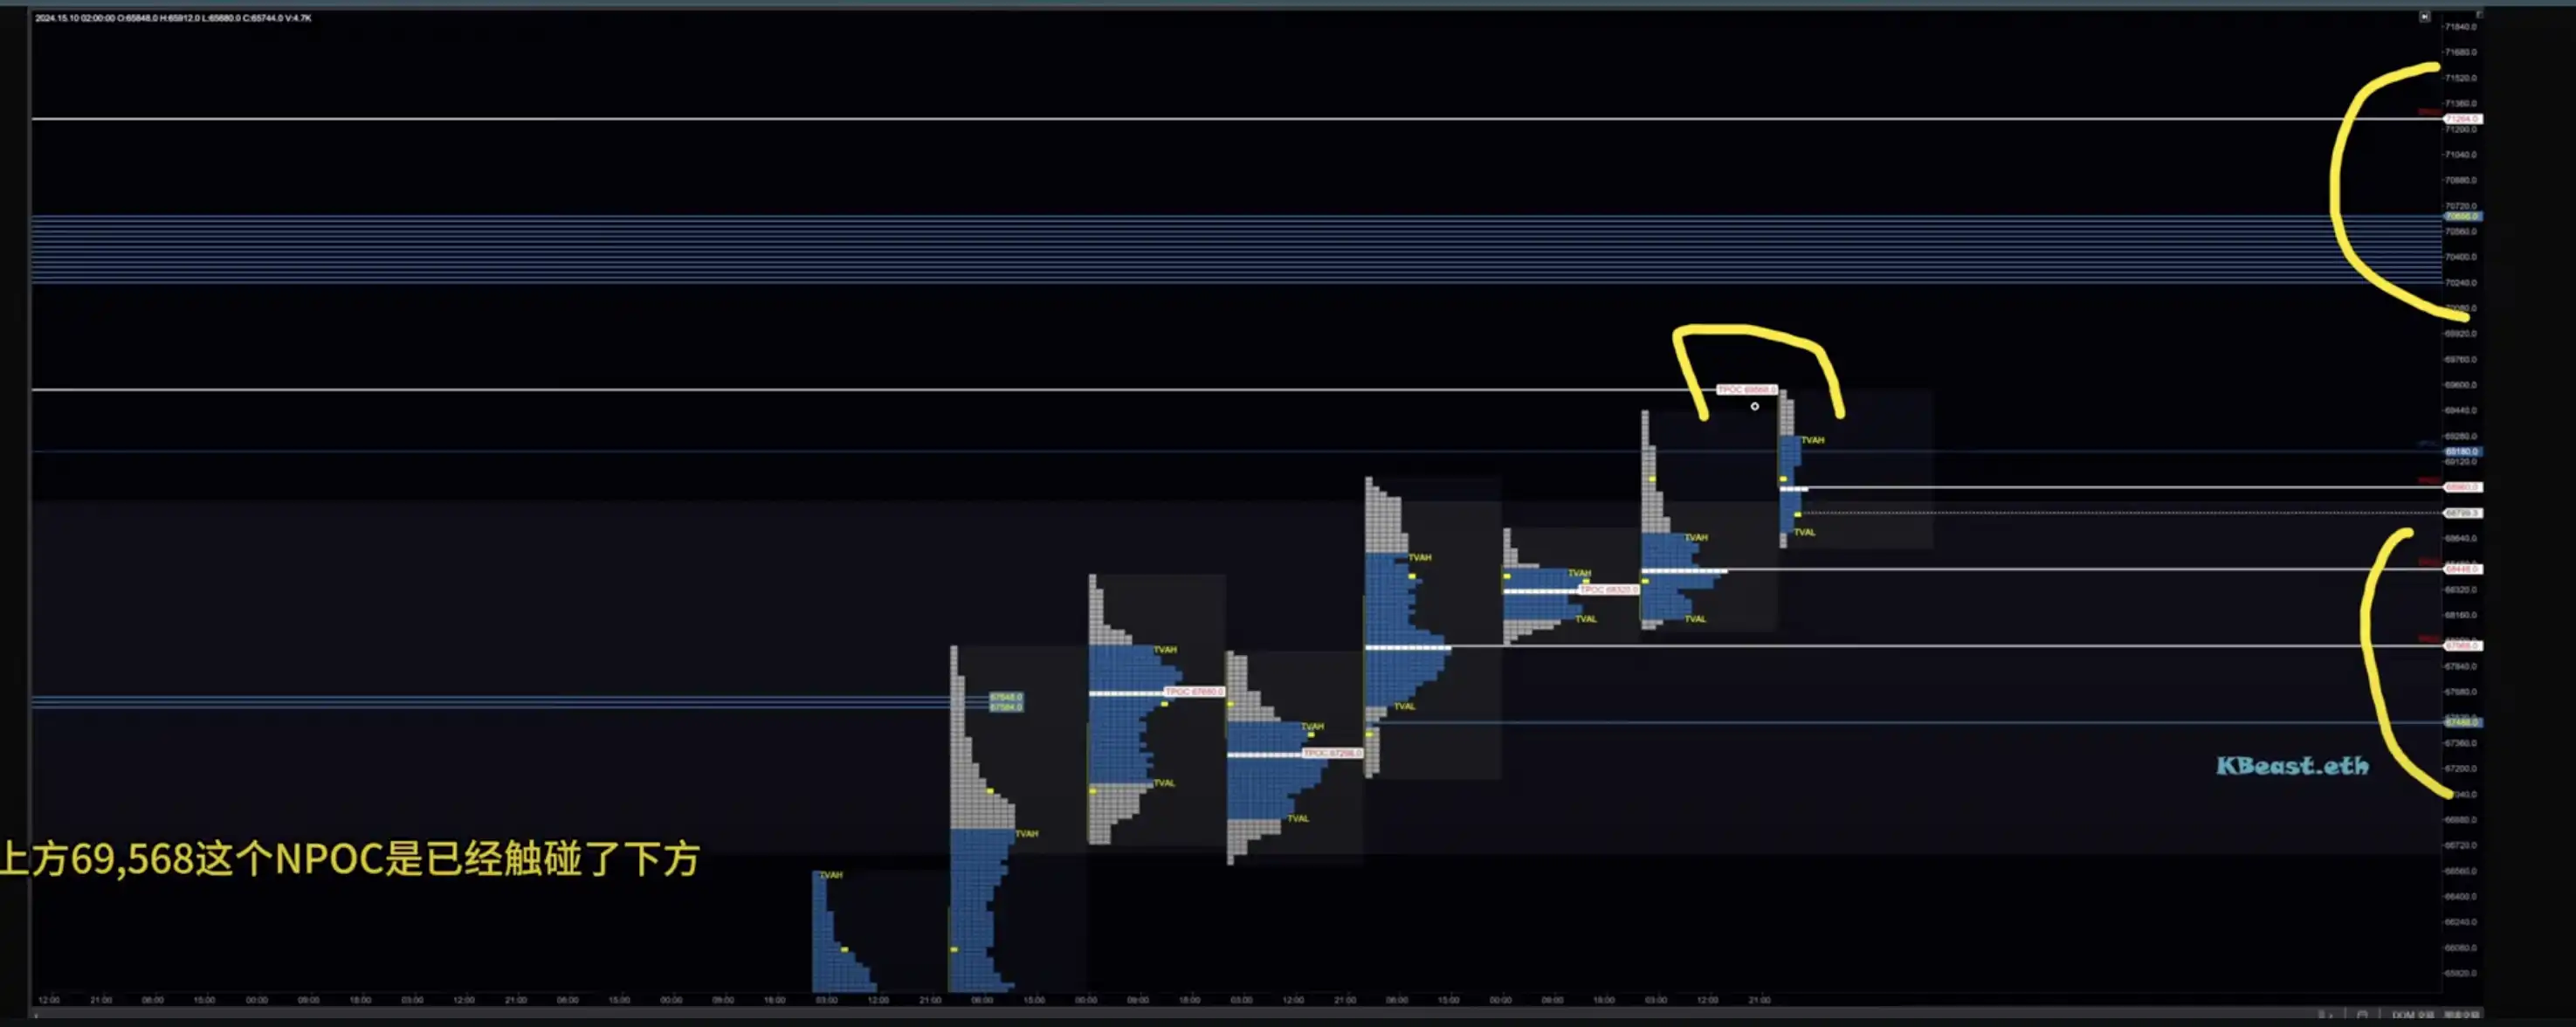
According to the value range of BTC's wide range fluctuations in the past half year, yesterday's upward breakthrough did not break through the VAH of this half year, and the thickest distribution area, which is the largest supply area, is at 70900. If it can continue to rise, and there is no upward auction rejection, the next upward target will be 70900.
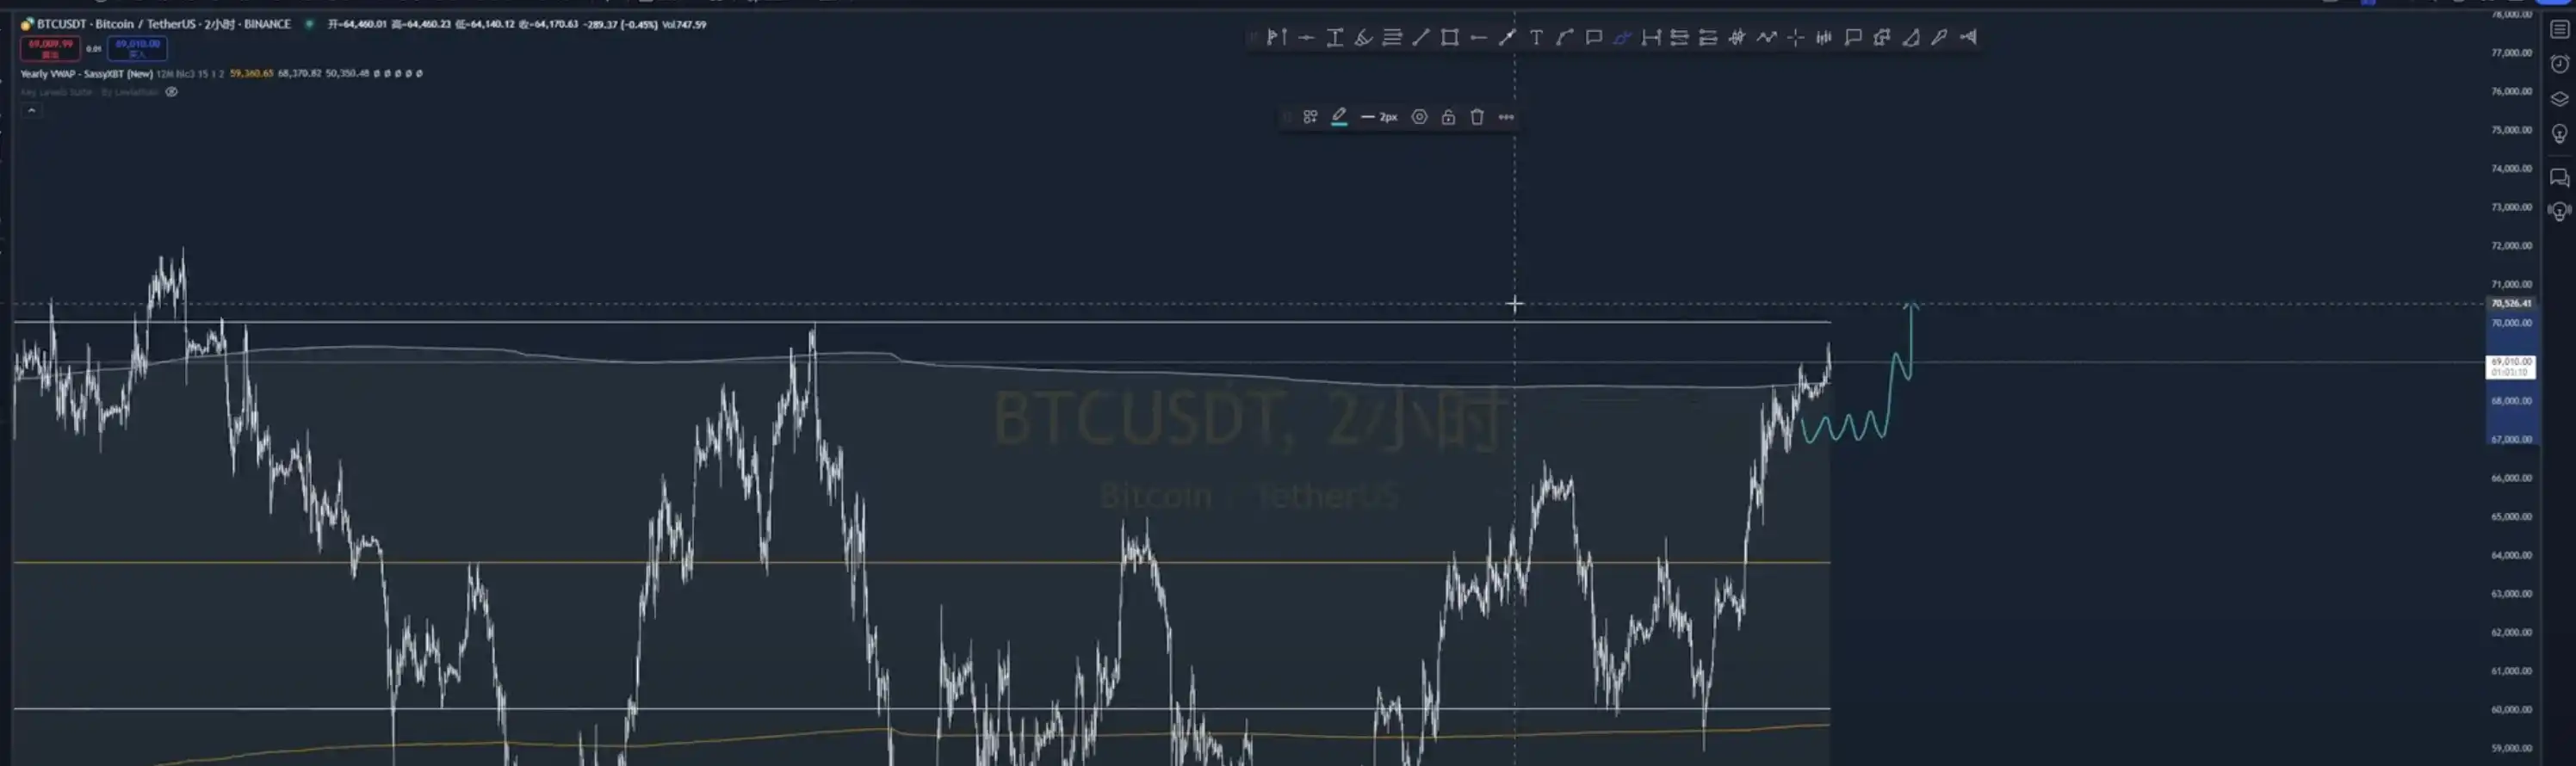 From the perspective of the annual VWAP, it has gone through the accumulation and breakthrough, and there is no obvious downward driving force, but a retracement without breaking through, so it is believed that it will continue to break through upwards in the short term. According to the buyer's liquidity depth chart and the liquidation heat map, a key position for the downward adjustment is around $65,000 - $67,000.
And observing the auction form during the day, it is a very obvious upward auction structure. It also fits the view of continuing to break through upwards, so it can continue to be bullish.
@LinChen91162689

@Crypto_Painter_X
From the data perspective, spot: the aggregated spot maintained a slight sell-off on Sunday evening, but started to surge with increased volume on Monday morning, with the surge occurring in 2 stages; futures: the aggregated futures first saw continuous small-scale sell-offs from Sunday evening to Monday morning, and were still in the process of reducing long positions and shorting during the first stage of the spot surge, but fully switched to long positions after the second stage of the spot surge breaking through $69,000; it seems that the bears first entered the market on the left side based on the possibility of a false breakout of $69,000, and were then stopped out by the strong buying pressure in the spot market.
It is worth noting that Coinbase has changed its previous state of continuous outflows since Sunday, and has started to make small-scale buy-ins, which is a relatively big change; but Binance Futures, apart from three volume-driven surges, have been in small-scale long position reduction/shorting for the rest of the time; in summary, buying pressure in the spot market has started to emerge! Although the volume is not very large, if it can absorb the supply from the profit-taking sell-offs in the futures, the price can stabilize at $69,000.

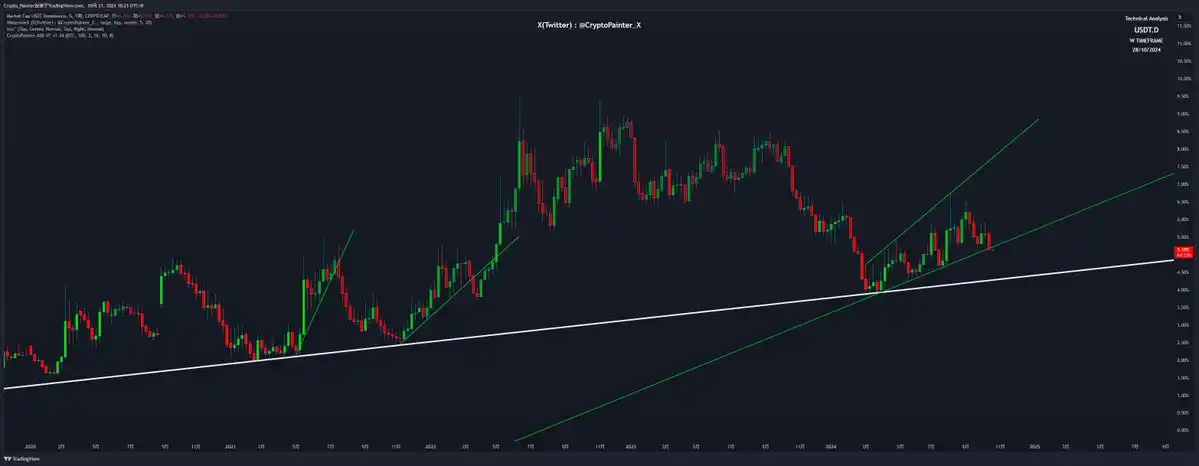
From the perspective of USDT market share, the USDT market share has slightly broken below the upward trend line of the past half year, if this is indeed a confirmed breakdown, it means that idle funds are entering the market, and the more likely performance is that BTC dominance will temporarily peak, and Altcoins and small-cap projects will see broad liquidity in the next 2-3 weeks.
From the perspective of total futures positions, the total BTC futures positions across the network have been above the $40 billion mark for 3 consecutive days, while the price has seen a $1,500 increase with the positions remaining at a high level, indicating that spot funds have entered the market in small amounts; but compared to BTC's previous oscillation between $68,000 and $69,000, the current total positions are $2.5 billion more, which means that although the sentiment of the spot bulls is very good, there has not been a large selling pressure yet.
Therefore, for the current market, the spot will not be a potential source of risk, and the additional $2.5 billion in positions may be the source of the next "long liquidation", which is a necessary condition for the next round of upward movement in a true bull market. In a market with a high weight of futures, the shorts are the source of funds for the upward movement, while the longs are just a burden.
Macro Analysis Camp
@Phyrex_Ni
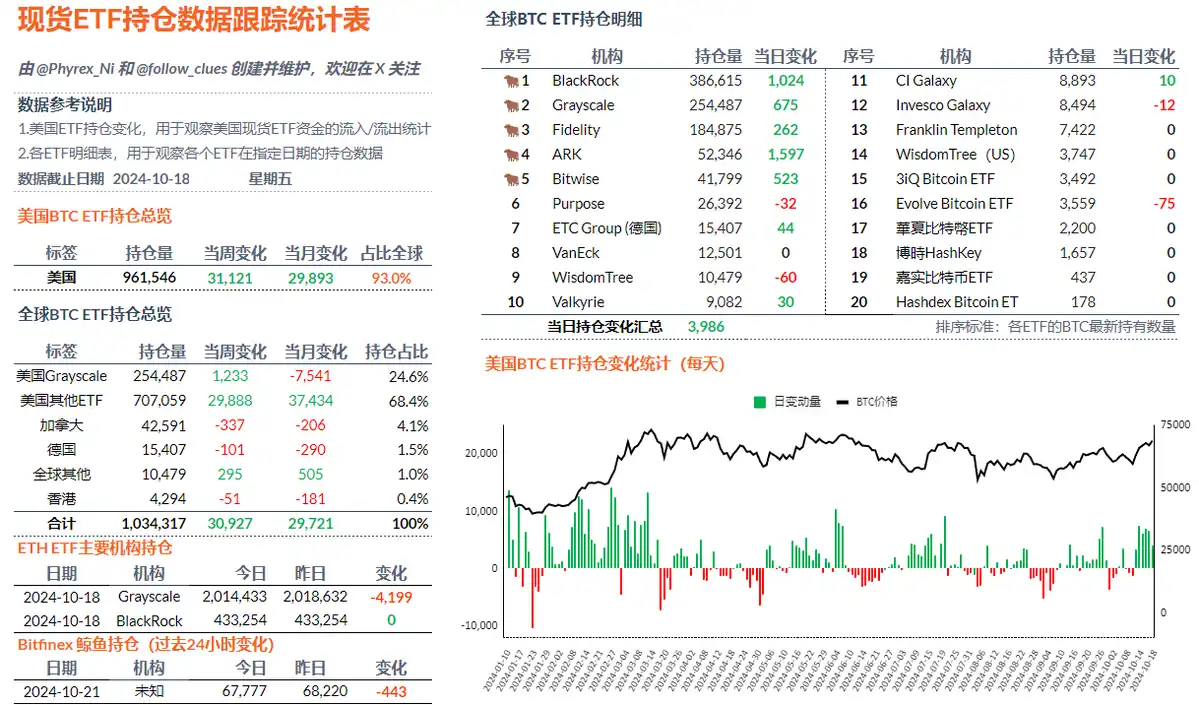
The data on BTC spot ETFs last Friday still performed well, although they have a decreasing purchasing power trend like ETH, but there is still a large amount of funds concentrated on BTC. On Friday, the spot ETFs had a net inflow of 4,099 BTC, which is the lowest data of the week but still much stronger than before.
BlackRock has had net holdings increases for five consecutive business days during the week, with a total increase of 16,975 BTC, which is a data we haven't seen since March. Fidelity ranked second with a net increase of 4,807 BTC, followed by ARK with 4,538 BTC and Bitwise with 2,244 BTC.
It is worth mentioning that Grayscale's GBTC has net increased by 963 BTC in the past week, not including the amount increased by Mini ETFs, forming a stark contrast with ETH. Even in a time of very tight liquidity, investors' limited funds are still concentrated mainly on BTC.
In the past week, the net buying power of 12 ETFs in the US was 31,119.43 BTC, an increase of 685.34% compared to the previous week, which is far ahead of ETH. Grayscale's net redemption has changed from 1,103.36 BTC two weeks ago to a net inflow of 1,232.71 BTC, and Grayscale is no longer synonymous with BTC redemption.
Other Cryptocurrencies
@MaoShu_CN
The Altcoins have indeed shown some signs of recovery over the weekend, with MEME coins experiencing a rebound. However, even with the optimism, caution is still warranted. The oracle sector has seen an increase, with API3 and DIA indicating increased on-chain activity, which can be seen as a positive signal for Altcoin optimism. APE surged by over 100% in the early morning of October 20th in the UTC+8 time zone, leading to a collective rise in the Metaverse and Non-Fungible Token sectors.
Overall, the current market narrative does not seem to be centered around the Metaverse and Non-Fungible Token sectors, and these hot topics should be approached with caution, as they may be Altcoins taking the opportunity to become active and offload their holdings. After all, the Metaverse and Non-Fungible Token sectors have been the least hot in this cycle. However, the increased activity in the oracle sector is still viewed optimistically, as the Altcoin sector was also first to take off during the same period last year, and it is hoped that this can once again stimulate market activity.
@0XENAS
He believes the market operates in a mysterious way, and we all have the opportunity to find some currencies that may bring outsized returns, or end up going to zero after being promoted by other Key Opinion Leaders (KOLs). For him, he will choose $GOAT and $GNON, and he has already bought the dips on GOAT. He believes GOAT and GNON will become key positions in the future long-term trend. If he is wrong, he will become the exit liquidity for others.