The market turmoil last night plunged Bit and Ethereum into a deep correction, as if the bull market had come to an end. However, is that really the case? The risk-averse sentiment triggered by the plunge in US stocks may actually fuel the strong rebound of Bit in the future.
Bit once fell to $65,260, but this may not be the beginning of a bear market, but a great opportunity to "reverse and pick up people". Although the market will continue to fluctuate in the short term, the footsteps of the bull market have not stopped, and the deep correction may be accumulating energy for the next high point.
Market Linkage: Pressure Transmission from Traditional Financial Markets
According to Wind data, the tense sentiment in the global capital market began to spread from the US stock market during the trading session last night. The S&P 500, NASDAQ and Dow Jones indices all fell more than 1% on Wednesday, with the S&P 500 index entering a technical correction range since the beginning of the year. At the same time, the bond market is also under pressure, with the yield on 10-year US Treasuries rising to 4.25%, a new three-month high. The double blow to the stock and bond markets has put pressure on risk assets in general, and the cryptocurrency market, as a highly volatile asset, has naturally become the "hardest hit area" of this round of market turmoil.
However, the market pressure is not limited to the traditional financial field. Gold prices also fell 1.1% to $2,730 per ounce after hitting a new high. The linkage of this series of assets shows that the global market is in a highly sensitive state, and any external risk event may trigger a wider asset sell-off, forcing the cryptocurrency market to adjust in sync with this macro risk transmission.
Against the backdrop of ongoing conflicts in the Middle East and uncertain prospects for the US election, the demand for safe-haven assets has driven a short-term rebound in gold. Although polls show a close race between former US President Trump and current Vice President Kamala Harris, the Polymarket market believes that the probability of Trump's victory is increasing, exceeding Harris by more than 30 percentage points, which may bring new uncertainties to geopolitics.
In addition, the 2024 BRICS Summit is also drawing market attention to a currency that could potentially replace the dominance of the US dollar, particularly a gold-backed currency proposal. However, the sell-off in the global bond market has limited the upside of precious metals, especially as investors expect the pace of interest rate declines to be slower than previously expected.
Compared to non-yielding assets like gold, Bit and its potential ecosystem as yielding assets may bring unique safe-haven value. As Bit matures, innovations such as decentralized finance (DeFi) and staking services allow Bit to generate returns, a feature that distinguishes it from traditional non-yielding safe-haven assets. As global investors seek assets that can hedge systemic risks while having return potential, Bit may become an important choice for future safe-haven assets.
Liquidation and Capital Flows: The Trigger Point of Market Clearing
The violent market fluctuations were accompanied by a large number of liquidation events. According to Coinglass data, more than 90,000 people were liquidated in the past 24 hours, with a total amount of $259 million.
In addition, the open interest of BTC contracts has also dropped from $40.6 billion to $38.8 billion, a decline of nearly 4.4%.
It is worth noting that if the Bit price breaks through $69,000, the cumulative short position liquidation intensity at mainstream exchanges will reach $2.2 billion; conversely, if it falls below $63,000, the long position liquidation intensity may reach $1.6 billion.
From the liquidation map, the market liquidity is tending towards the direction of the least resistance, and the future trend will switch rapidly between the key support and resistance levels. This liquidity structure indicates that the market volatility has not yet ended, and the capital flows behind the liquidation data also reflect the high sensitivity of the current market to price fluctuations.
Bit ETF Continues to See Net Outflows for Two Days
The price correction of Bit has led to a net outflow of $79.1 million from US Bit ETFs on October 22. According to data from Farside Investors, this is the first net outflow since October 10. In addition, the two major Bit ETFs, IBIT and FBTC, did not make any new purchases yesterday, with a total outflow of 1,772 Bit.
Technical Analysis: Fibonacci Retracement and Key Support Levels
Since Bit broke through the previous local high of $66,500 on September 27, the overall trend has remained strong, forming a sustained higher high (HH) and higher low (HL) trend. If Bit can form a new higher low compared to the previous low of $58,900, this upward trend will continue.
From a technical perspective, the next key support level may appear in the Fibonacci 0.618 retracement range, also known as the golden ratio area. Many high time frame (HTF) swing traders often take long-term positions in this range. From the 4-hour chart, we can observe that Bit rose from the second higher low (HL2) to the higher high (HH2), and then retraced to the lowest point of $65,260, which coincides with the Fibonacci golden retracement range and is also near the 99-day moving average. This suggests that Bit's correction to $65,000 is a healthy technical adjustment, indicating a higher probability of forming a new low (HL3), and then potentially continuing the uptrend to set a new high (HH3) in early November.
In addition, Bit futures trader Satoshi Flipper also pointed out that the $66,000 to $64,000 range has strong support, and the current price level is seen as an "excellent buying opportunity" before the US election results are announced. From a technical perspective, this area provides an ideal bullish reversal signal, and the subsequent trend is expected to develop further upwards.
Bit CME Gap Still Below $60,000
In September, Bit prices rose 18%, forming an unfilled gap in the CME futures market between $52,000 and $54,000. Previous reports have shown that all futures gaps at CME have been filled in the past two quarters, but this specific gap remains unfilled.
The chart shows that Bit has a key support level around $60,000. If the daily closing price falls below this level, the upward trend of Bit since September may experience a bearish structure breakthrough (BOS). From a market structure perspective, a break below $60,000 will disrupt the current higher high and higher low uptrend of Bit, potentially delaying the time to reach a new historical high, even until 2025. A breach of this psychological barrier may trigger large-scale sell-offs and liquidations.
Although retesting the CME gap is possible, this scenario is unlikely to occur in the short term unless a major macroeconomic negative event occurs.
SOL Outperforms BTC and ETH
Solana continues to perform strongly, with its price holding at $171 at the time of writing.
Ethereum (ETH) reached a high of $2,769 on October 20, and then fell by nearly 10% by October 23, erasing the gains of the previous 10 days. Although it is currently stable around $2,500, its 30-day performance has still declined by 6%. The possibility of ETH breaking through the $2,800 support level is decreasing, and on-chain data shows that high transaction fees are moving some activity to other blockchains, reducing the demand for native staking on the Ethereum network. Although the average Ethereum transaction fee was $4 over the past two weeks, indicating strong on-chain activity, it has also enhanced the competitiveness of low-cost blockchains.
According to defillama data, Solana's trading volume reached $13.4 billion in the past 7 days, 67% higher than Ethereum's trading volume during the same period. This gap has significantly widened compared to the situation in early October when the trading volumes of the two were on par.
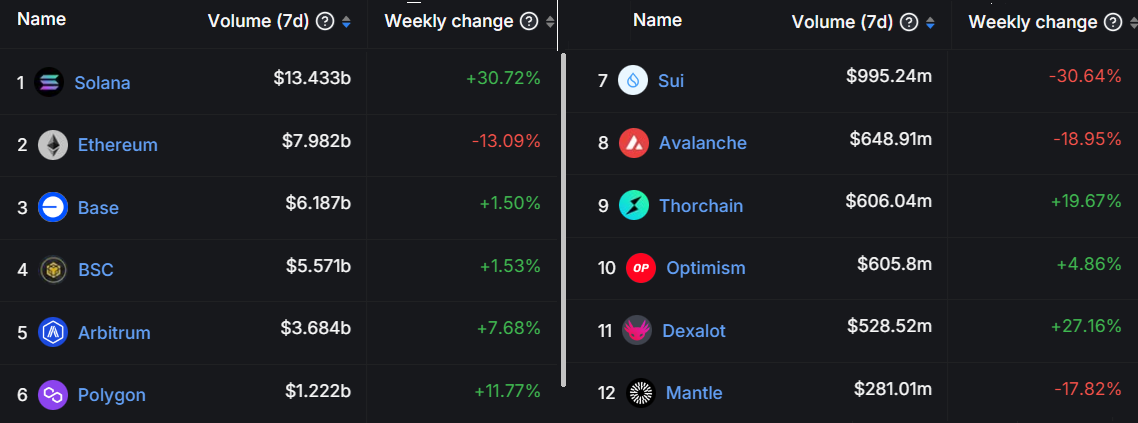
More notably, within the 7 days ending October 23, the trading volume of decentralized exchanges (DEXs) on Ethereum decreased by 13%, with activities on Uniswap and Curve Finance also declining by 18% and 77% respectively. In contrast, the trading volume of Solana's Raydium increased by 42%, and Lifinity even surged by 77%. On-chain data indicates that Ethereum is showing weaknesses in the competition with rival networks, while Solana's total value locked (TVL) grew by 12%, related to the recent on-chain discussions on hot topics such as AI and memes, and the surge in meme coin trading has also provided support for the SOL price.
Additionally, another major factor affecting investors' confidence in Ethereum's future price is the uncertainty surrounding the upcoming Prague-Electra upgrade. The upgrade, originally scheduled for the first quarter of 2025, aims to improve network scalability, including the introduction of Verkle trees to reduce node storage requirements and EIP-7251 to improve validator efficiency. However, the market remains doubtful about whether this upgrade will be implemented as planned and whether it will effectively alleviate network congestion, as the issue of network scalability remains a key obstacle to Ethereum's long-term growth.
Outlook and Operational Suggestions
Short-term Outlook
$65,000 is expected to become an effective support level in the short term, and the rebound to $67,000 indicates relatively strong buying power. However, the subsequent trend still depends on changes in trading volume and market sentiment. If the bulls can maintain their momentum and break through $68,000, the market may continue to rise. Otherwise, if the $65,000 support level is broken, it may trigger further corrections, possibly even falling below $64,000.
Medium to Long-term Outlook
From a medium to long-term perspective, the stability of the support level needs to be comprehensively assessed based on macroeconomic factors, policy changes, and market sentiment. The overall long-term bullish trend of Bitcoin has not been broken, and if the $65,000 support level can be maintained effectively, it may accumulate strength for subsequent upward movements, despite the significant short-term volatility.
Operational Suggestions
For investors with existing positions, it is recommended to strengthen risk control measures around the $65,000 level, such as setting stop-loss protection, to avoid significant losses if the price breaks down. For bullish investors, they can consider building positions in batches around the $65,000 area, but need to closely monitor market developments, and may consider increasing their positions if Bitcoin breaks through $68,000 to capture the potential continuation of the uptrend.
The $65,000 level has certain technical and psychological support as a potential support for Bitcoin, but its effectiveness still needs to be further observed in conjunction with market reactions, changes in trading volume, and the global macroeconomic situation. In the current highly volatile market, investors should maintain flexibility and adjust their strategies in a timely manner based on market changes.