On October 10, Bitcoin (BTC) briefly fell below $60,000, sparking speculation that it could miss the traditionally bullish "Uptober." However, the price surge over the past week has hinted at an even stronger performance towards the end of the month, aligning with historical data that often sees Bitcoin rise as October comes to a close.
BTC is currently trading at $68,563. This on-chain analysis highlights indicators suggesting BTC could soon surpass $73,000.
On-chain Metrics Support Bitcoin's Uptrend
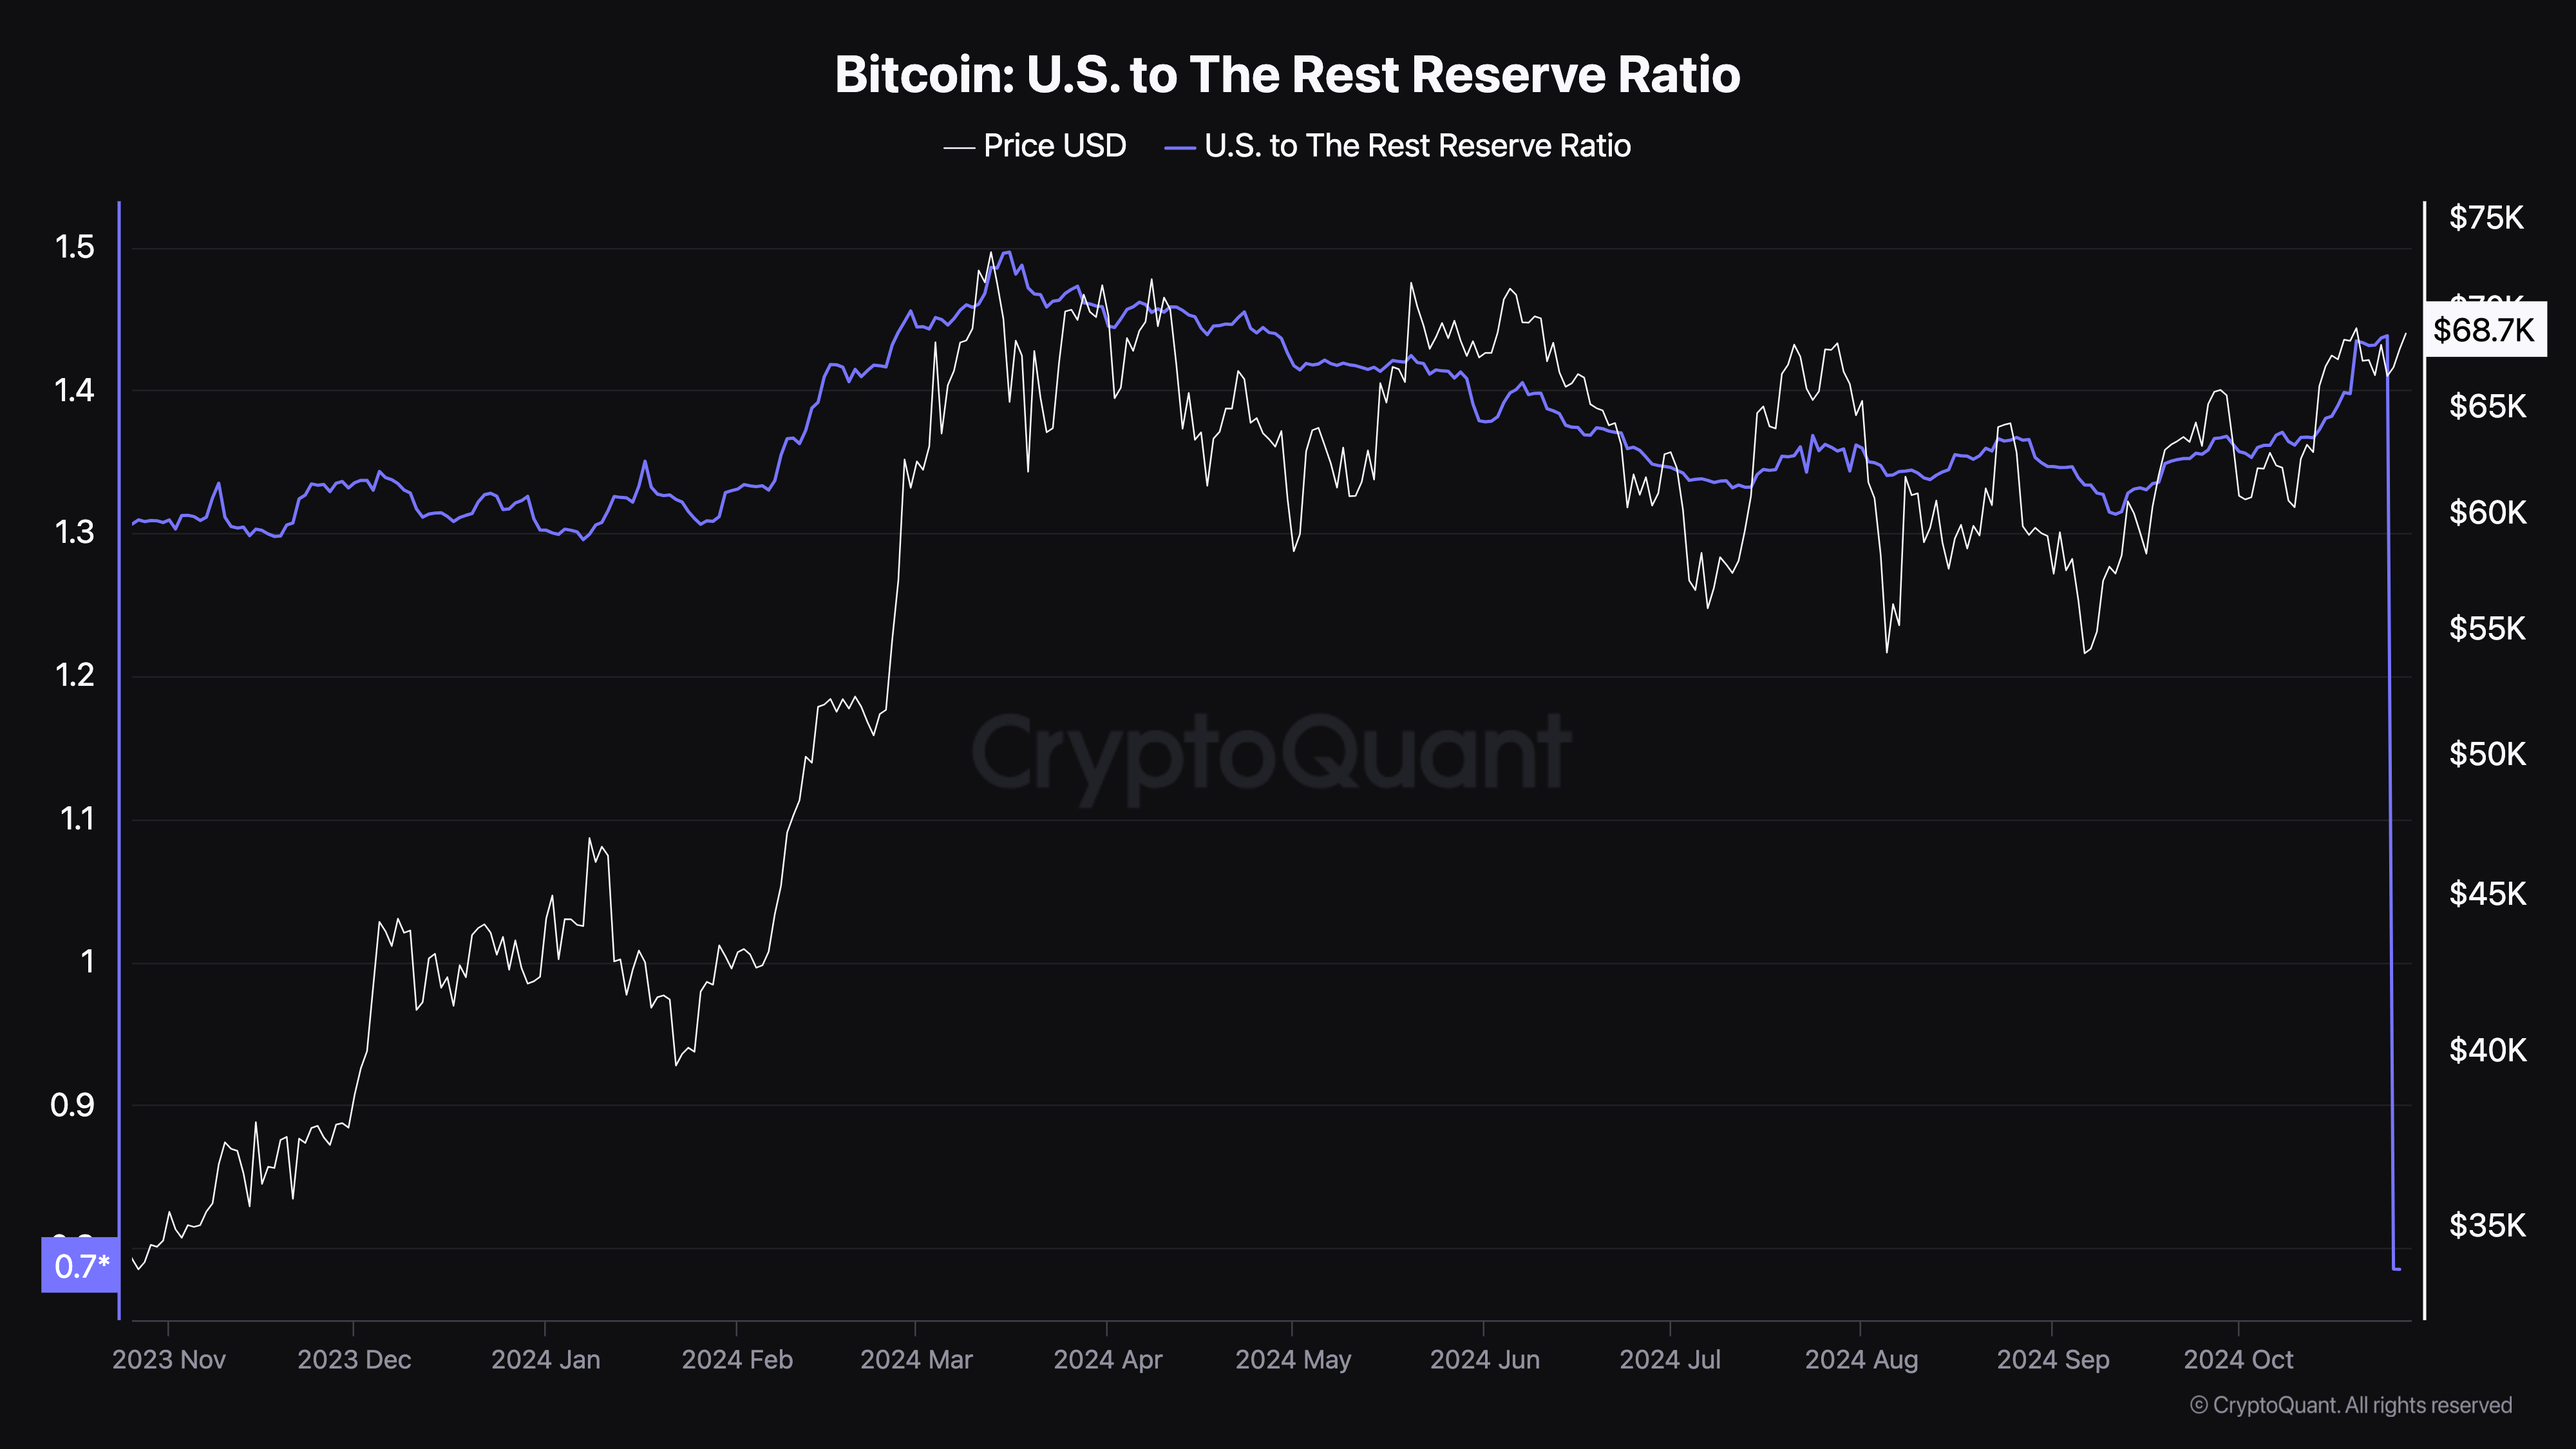
According to Cryptoquant's analysis, the ratio of Bitcoin held by US entities versus the rest of the world—a metric that measures the Bitcoin holdings of US-based exchanges, asset managers, and other institutions versus non-US institutions—played a key role in BTC surpassing $73,000 in March. This ratio reflects the relative accumulation levels of BTC by US-based versus non-US entities.
When this ratio rises, it indicates increasing BTC holdings by US-based entities, implying higher demand from US institutions. Conversely, a decline suggests these institutions are reducing their exposure.
This ratio started climbing steadily from Q4 2023, aligning with Bitcoin's price appreciation trajectory. Now, with it rising again since mid-October, the historical pattern suggests US institutions are actively accumulating BTC once more.
Read more: Top 7 Platforms Offering Bitcoin Signup Bonuses in 2024

For instance, BlackRock has recently accumulated billions of dollars' worth of BTC, indicating substantial institutional interest. If this trend continues, Bitcoin's price could soon surpass $70,000, potentially triggering additional upside in the short term.
Additionally, crypto analyst Rekt Capital has lent support to a bullish outlook on Bitcoin, noting that BTC has recently closed above a key overhead resistance, suggesting momentum to back the uptrend.
In a post on X (formerly Twitter), Rekt Capital emphasized that this technical breakout has reduced the likelihood of another immediate downtrend.
"The multi-month downtrend has been confirmed as over. The breakout of the downtrend channel has been confirmed. BTC has flipped resistance into support." Rekt Capital wrote on X.
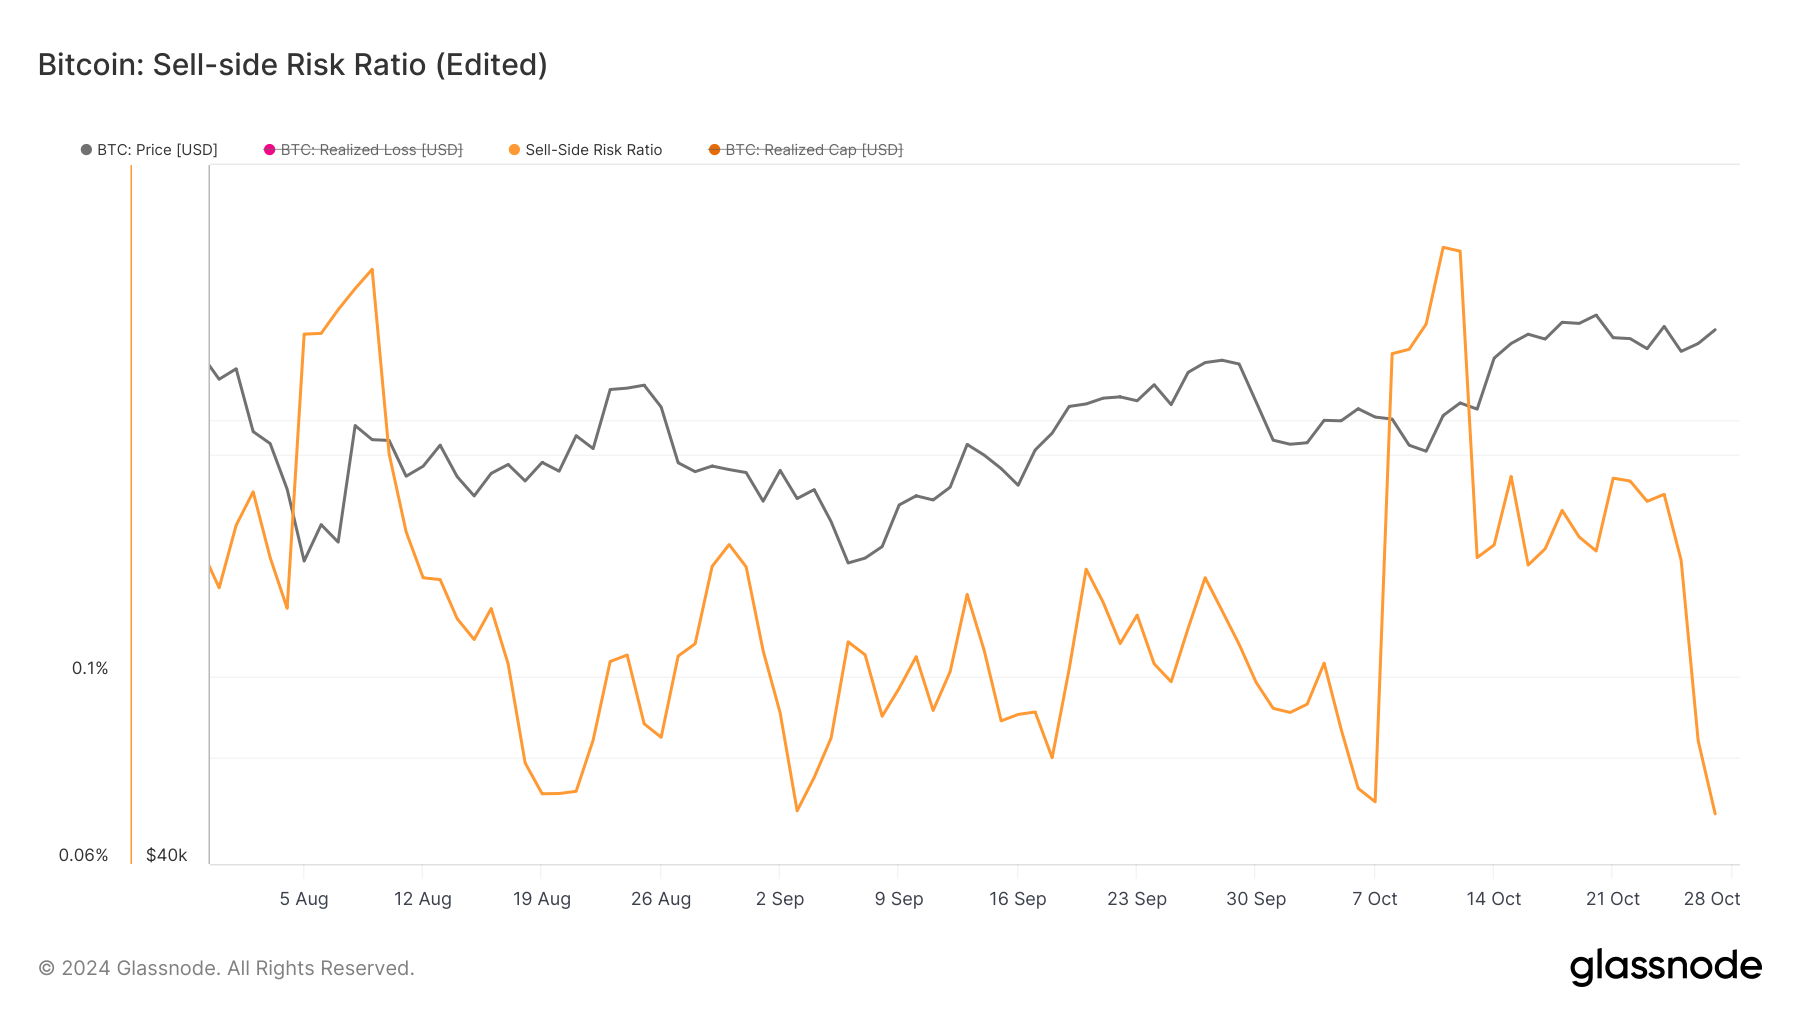
Furthermore, Bitcoin's sell-side pressure ratio has dropped to its lowest level since September 3rd. Generally, high values of this ratio coincide with the late stages of a normal or bullish market.
Conversely, low values often signal a macroeconomic bottom and increased likelihood of price appreciation. Considering Bitcoin's historical data and current positioning, the price has a high probability of surpassing $73,000 within the next few weeks.

BTC Price Forecast: Coins Eyeing Higher Levels
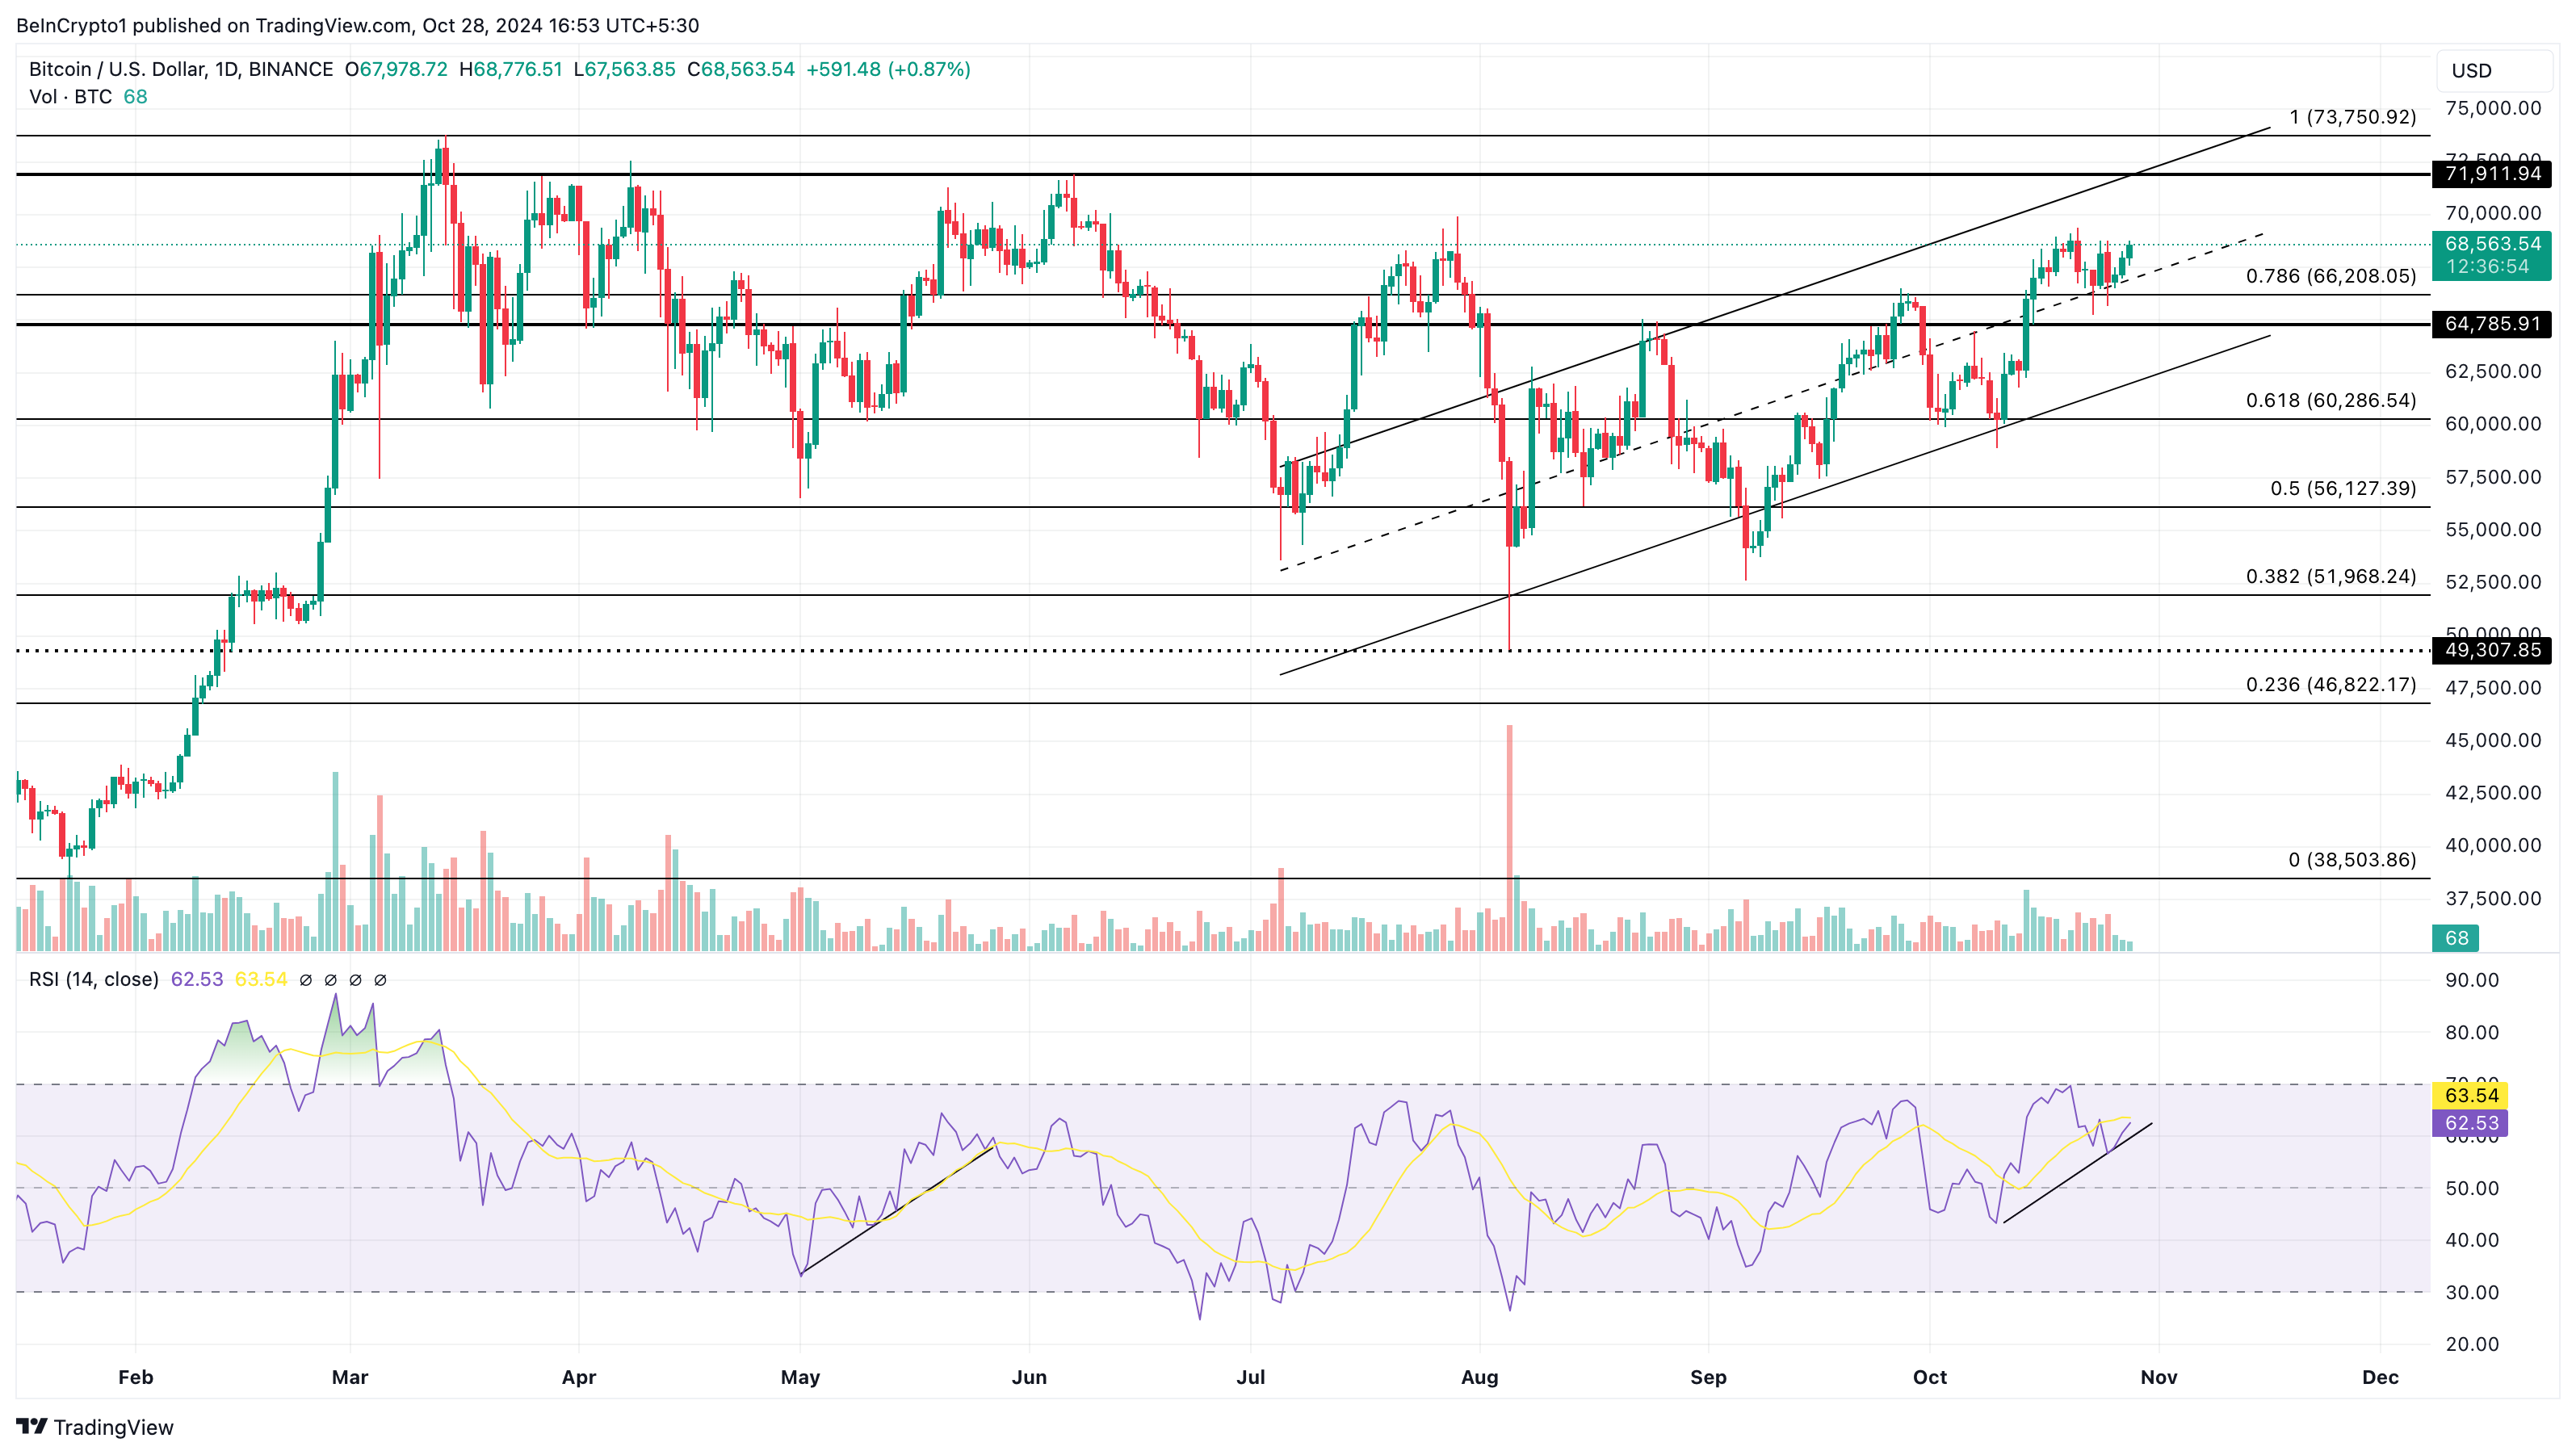
On the daily chart, Bitcoin is finding support at $64,785. Moreover, the Relative Strength Index (RSI) is following the same uptrend as the price, which has risen to $71,911.
For context, the RSI uses momentum and price changes to measure the strength of a trend. An increase indicates bullish momentum, while a decrease signals bearish momentum. Aligning with Bitcoin's historical data and the current upward channel on the chart, the price has a high likelihood of breaking above $73,750 soon.
Read more: Bitcoin (BTC) Price Prediction 2024/2025/2030

However, if Bitcoin's price were to fall below the $64,785 support level, this forecast may not materialize. In that case, BTC could drop as low as $60,286.


