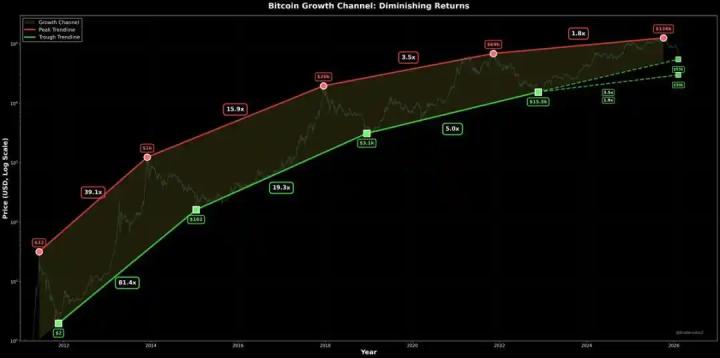
Bit (BTC) has started the new week with positive signals as buyers push the price above the resistance level of $69,000. This indicates that the uptrend is still being maintained.
One of the factors driving the strong rise of Bit (BTC) comes from the significant buying into Bit (BTC) ETFs in the US. In a post on X (formerly Twitter), Bit (BTC) analyst Alessandro Ottaviani reported that Bit (BTC) ETFs have attracted around $3 billion in inflows over the past two weeks.
In addition to ETF buying, the US election and the Federal Reserve's (Fed) interest rate decision are also likely to become key triggering factors for the cryptocurrency market in November.
Furthermore, Bit (BTC) "whales" appear to be taking advantage of this accumulation phase to accumulate more BTC. A chart published by research firm Santiment on X shows that the number of wallets holding 100 Bit (BTC) or more has increased by 1.9% in the past two weeks.
Will Bit (BTC) be able to break through the $70,000 level and drive interest in altcoins? Analyze the chart to find the answer.
The S&P 500 (SPX) index entered a correction phase last week, but the positive signal is that the bulls have not allowed the price to fall below the uptrend line.
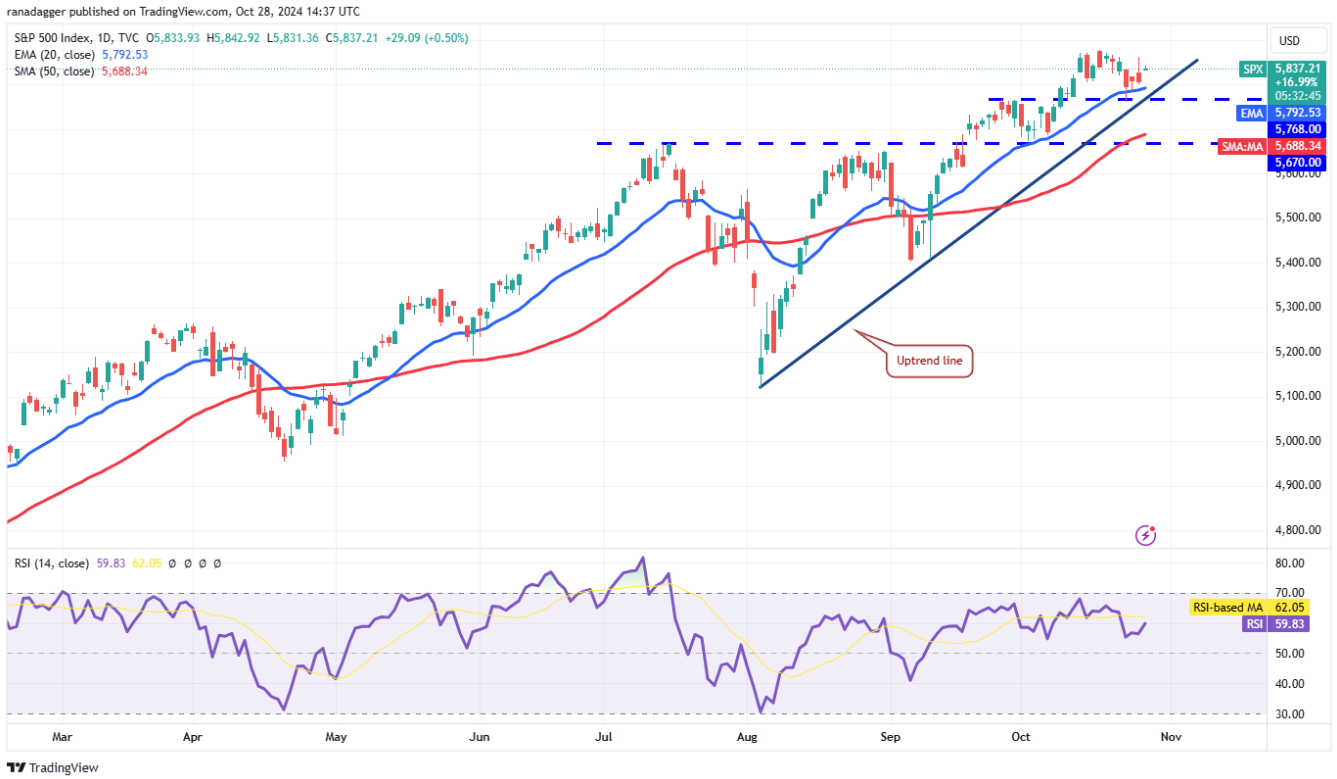
Daily SPX chart | Source: TradingView
The trend remains positive as long as the price maintains above the uptrend line. If the price continues to rise and breaks above the $5,879 resistance level, the uptrend will be resumed. In that case, the index could head towards the $6,000 mark and then $6,221.
However, this view will no longer be valid if the price reverses and breaks below the uptrend line. In that case, the index could drop to the $5,670 level - an important support level to watch, as a break below it could lead to a deeper correction down to $5,400.
The uptrend in the US Dollar Index (DXY) is showing signs of slowing down near the $104.80 resistance level.
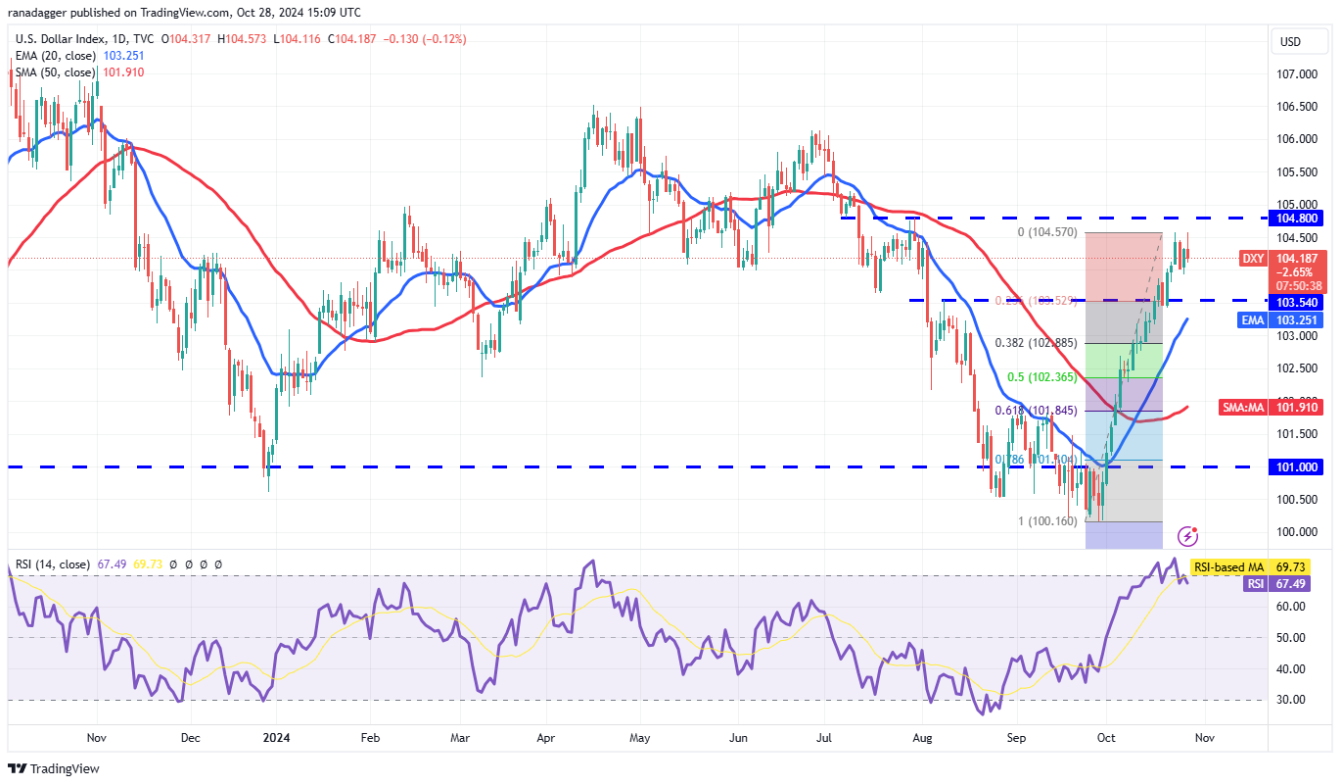
Daily DXY chart | Source: TradingView
The nearest support is at $103.93. If this level is broken, DXY could drop to the 20-day exponential moving average (EMA) at $103.25. Buyers are expected to strongly defend the 20-day EMA. If the price bounces off this EMA, the likelihood of the index breaking above $104.80 and targeting $106 next will be higher.
Conversely, if the bears pull the price below the 20-day EMA, DXY could drop to the 50% Fibonacci retracement level at $102.36.
Bit (BTC) price is gradually rising towards the $70,000 resistance level, indicating that demand remains strong at current price levels.
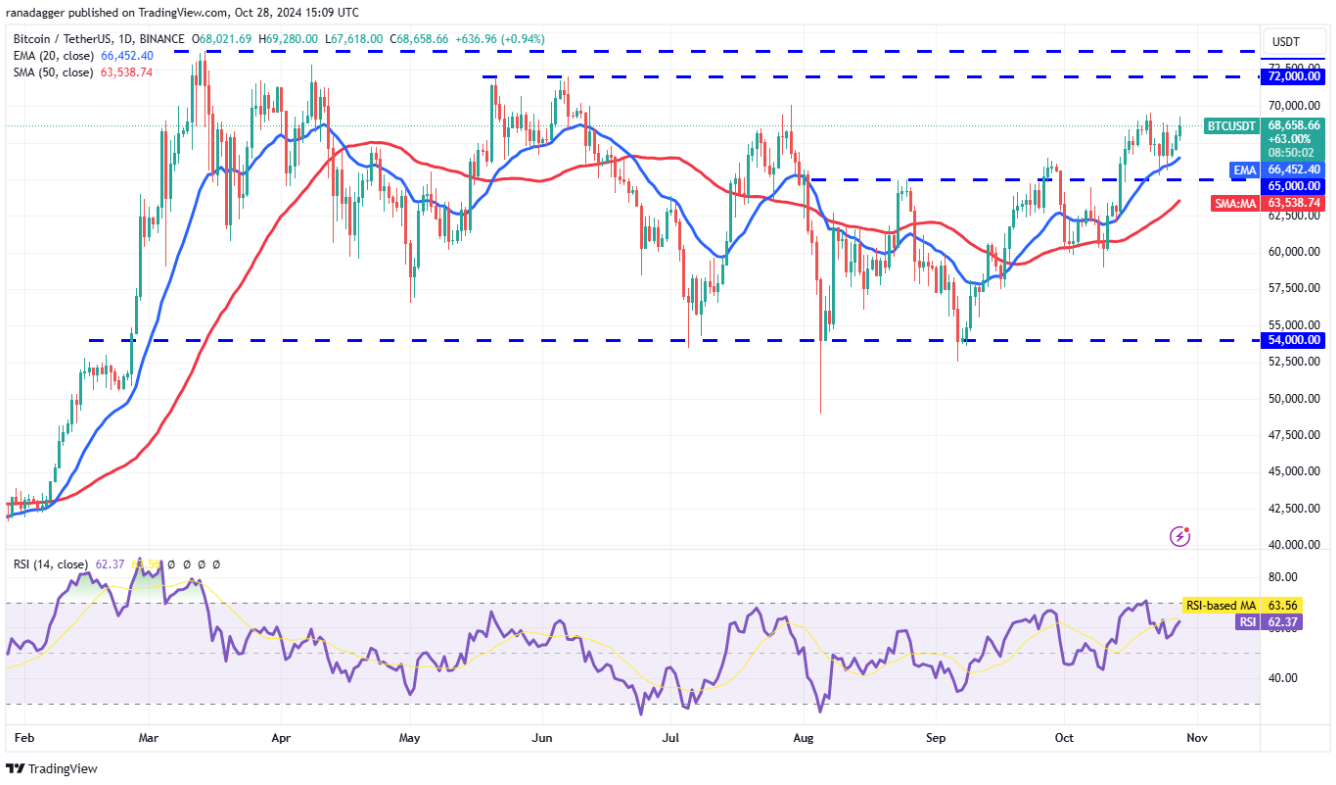
Daily BTC/USDT chart | Source: TradingView
The moving averages are sloping upwards, and the relative strength index (RSI) is in positive territory, suggesting that the bulls are in control. Although $70,000 may be a barrier, it is likely to be breached, pushing the BTC/USDT pair towards $72,000 - where the bears are expected to increase their selling pressure.
The crucial support to watch on the downside is the 20-day EMA at $66,452. If this level is breached, the upward momentum may weaken. The bears will regain the upper hand if the price drops below $65,000 and sustains below that level.
Ether (ETH) fell below the 50-day SMA ($2,504) on October 25th, but the bulls quickly bought the dip at the support line of the ascending channel.
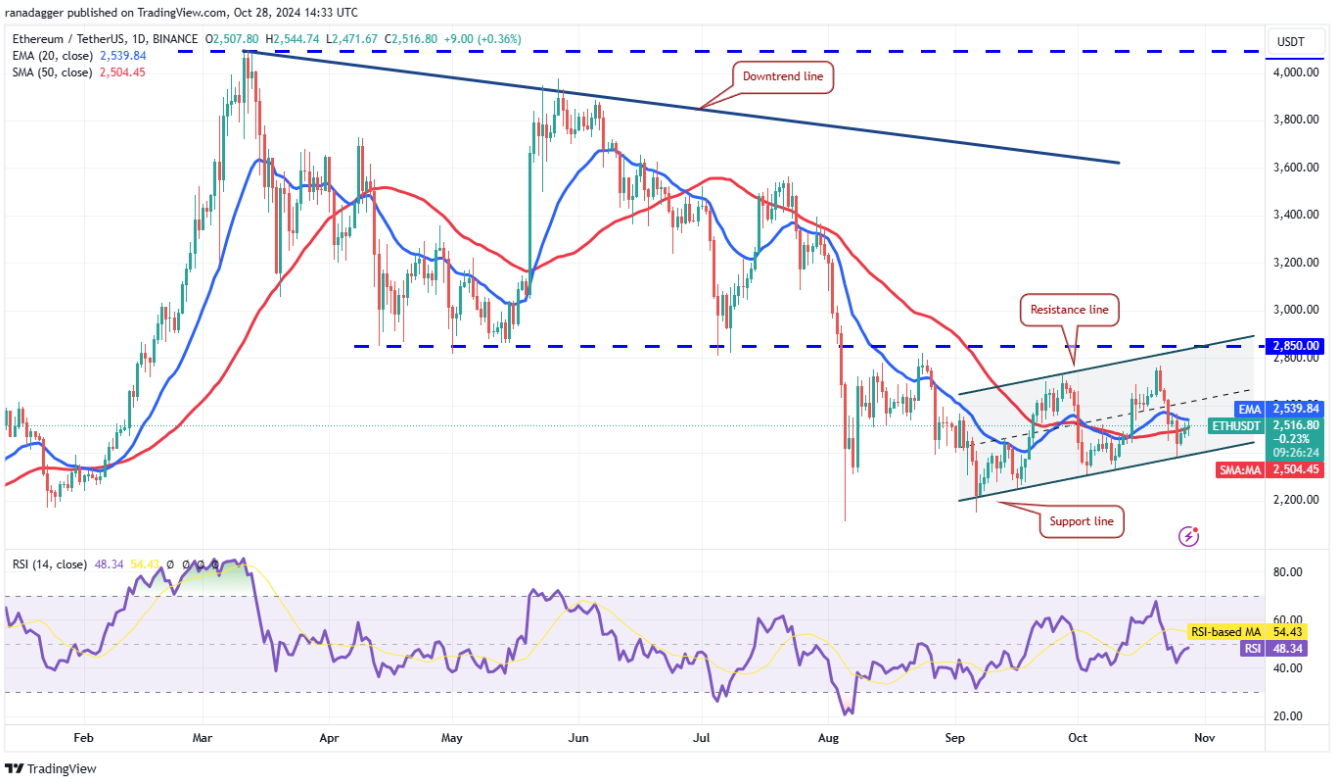
Daily ETH/USDT chart | Source: TradingView
The price has now returned to the 20-day EMA ($2,539) - an important level to watch. If the price drops from the 20-day EMA, the bears will try to pull the ETH/USDT pair below the support line. If successful, the pair could drop to the $2,150 - $2,111 support zone.
Conversely, if the bulls push the price above the moving averages, the ETH/USDT pair could rise to the resistance line of the channel. However, the bears are expected to fiercely defend the $2,850 level.
BNB has bounced off the 50-day SMA ($574) on October 26th and crossed above the 20-day EMA ($586) on October 27th.
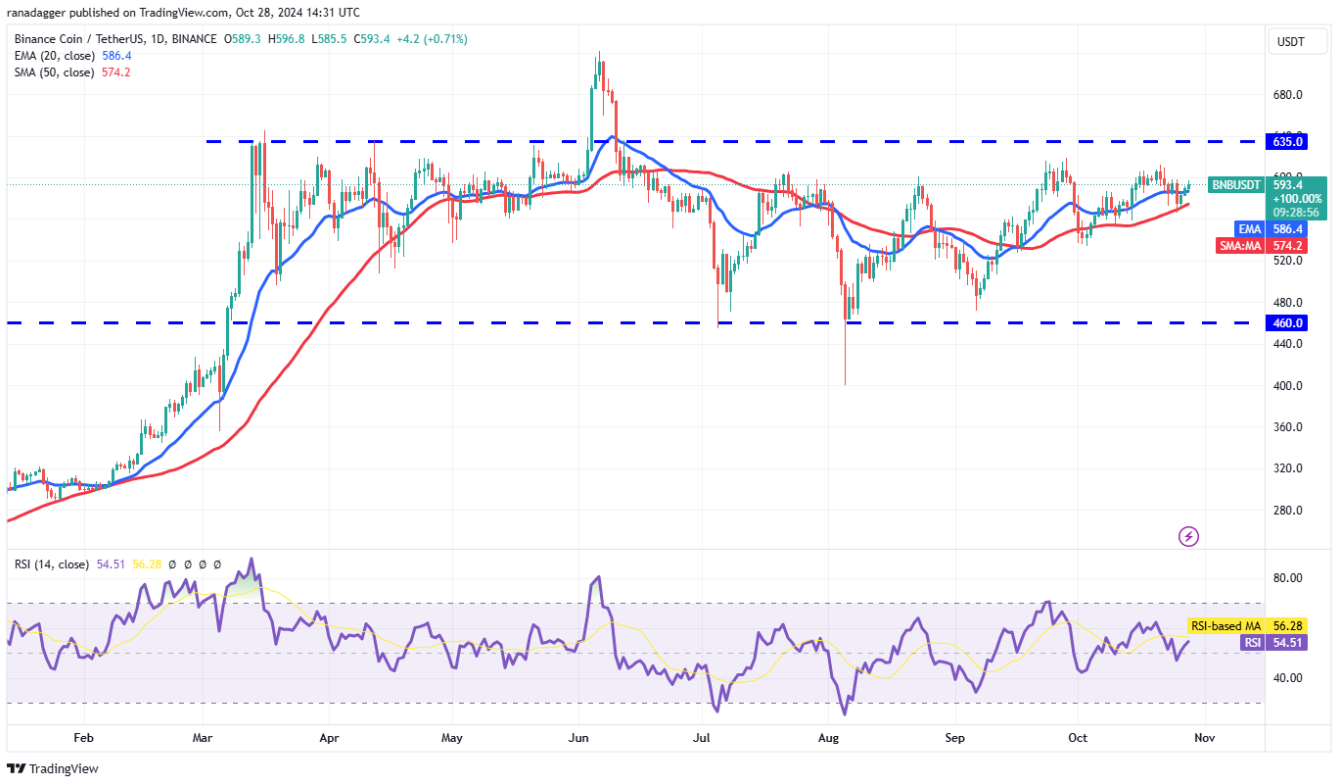
Daily BNB/USDT chart | Source: TradingView
If the price maintains above the 20-day EMA, the bulls will continue their efforts to push the BNB/USDT pair towards the $635 resistance level. The bears will try to defend this level, but if the bulls gain the upper hand, the uptrend could extend to $722.
Conversely, if the price reverses and breaks below the 50-day SMA, it would indicate that the bears are trying to make a comeback. In that case, the price could drop to the strong support level at $527.
Solana (SOL) is trying to rise to the resistance level of the range at $210, but the bears are exerting strong pressure at $179.
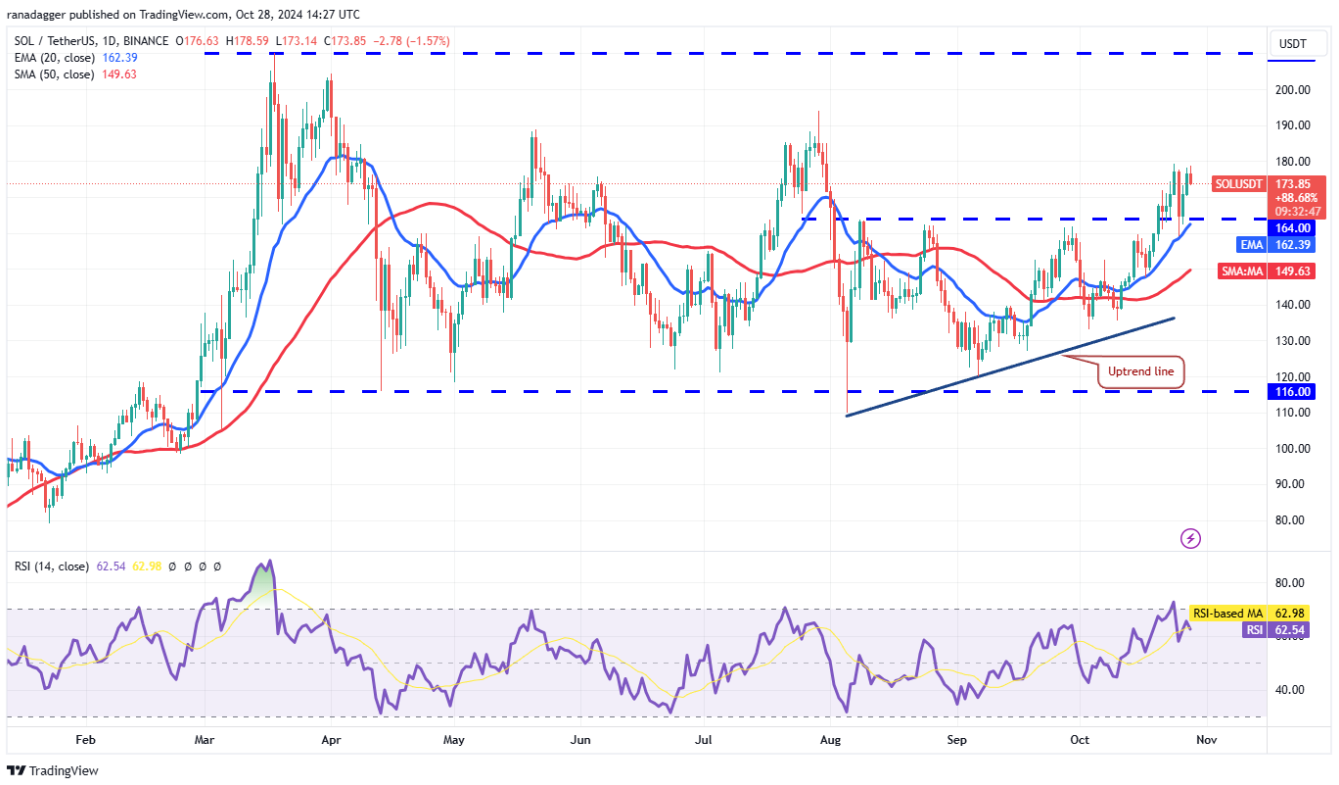
Daily SOL/USDT chart | Source: TradingView
If the buyers do not relinquish much of their current advantage, the chances of a breakout above $179 will be higher. The SOL/USDT pair could then surge to $189, where the bears are expected to continue to create strong resistance.
However, this positive outlook will be invalidated in the short term if the price reverses and drops below the 20-day EMA. This could cause the SOL/USDT pair to decline to the 50-day SMA ($149), indicating that the bulls are hastily exiting their positions.
XRP (XRP) price has reversed from the 20-day EMA ($0.53) on October 25th and broken below the $0.50 support level.
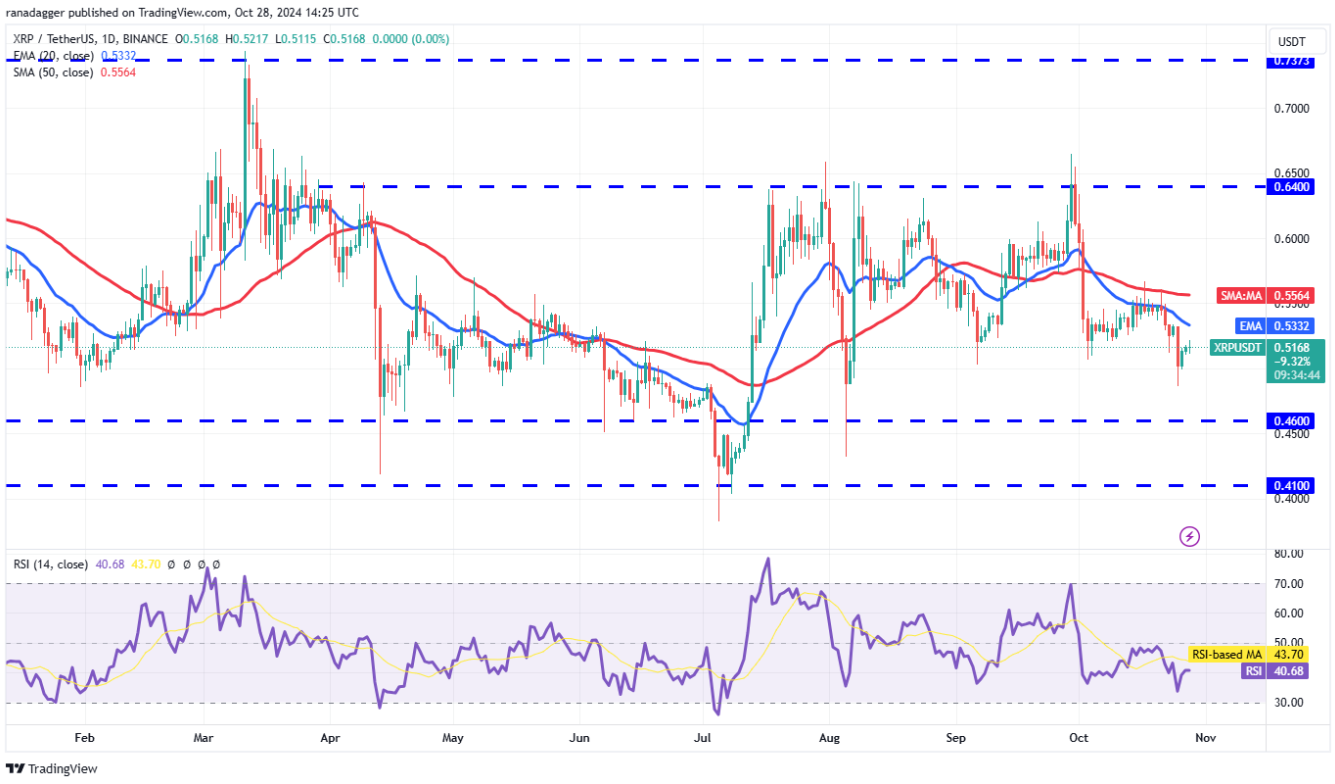
Daily XRP/USDT chart | Source: TradingView
The 20-day EMA is currently declining and the RSI indicator is in the negative zone, indicating that the bears are in control. Sellers will try to pull the XRP/USDT pair down to $0.46, where the bulls are expected to intervene.
On the flip side, the bulls need to push and maintain the price above the 50-day SMA ($0.55) to show that selling pressure is easing. If successful, this pair could attempt to recover and move towards the strong resistance level at $0.64.
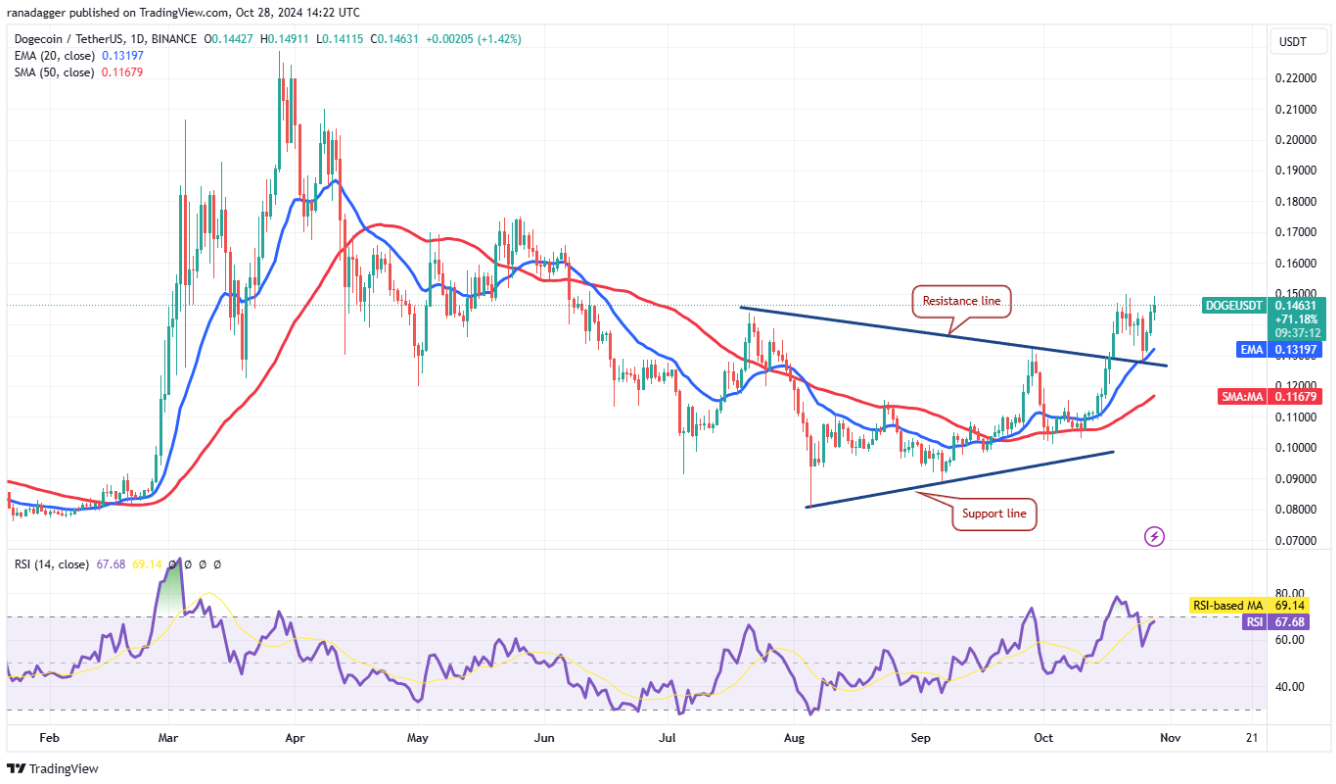
Dogecoin (DOGE) price has bounced back from the 20-day EMA ($0.13) on October 26 and reached the resistance level of $0.15 on October 28.
Daily DOGE/USDT chart | Source: TradingView
The bears will try to defend the $0.15 resistance level, but the 20-day EMA is rising, and the RSI is in the positive zone, indicating that the advantage is tilting towards the bulls. If the buyers push the price above $0.15, the DOGE/USDT pair could see a strong rally towards $0.18.
Conversely, if the price drops sharply from $0.15, it will signal that the bears are actively operating at higher price levels. In that case, the pair could return to the 20-day EMA. If it breaks and closes below this level, DOGE could plummet to the 50-day SMA ($0.12).
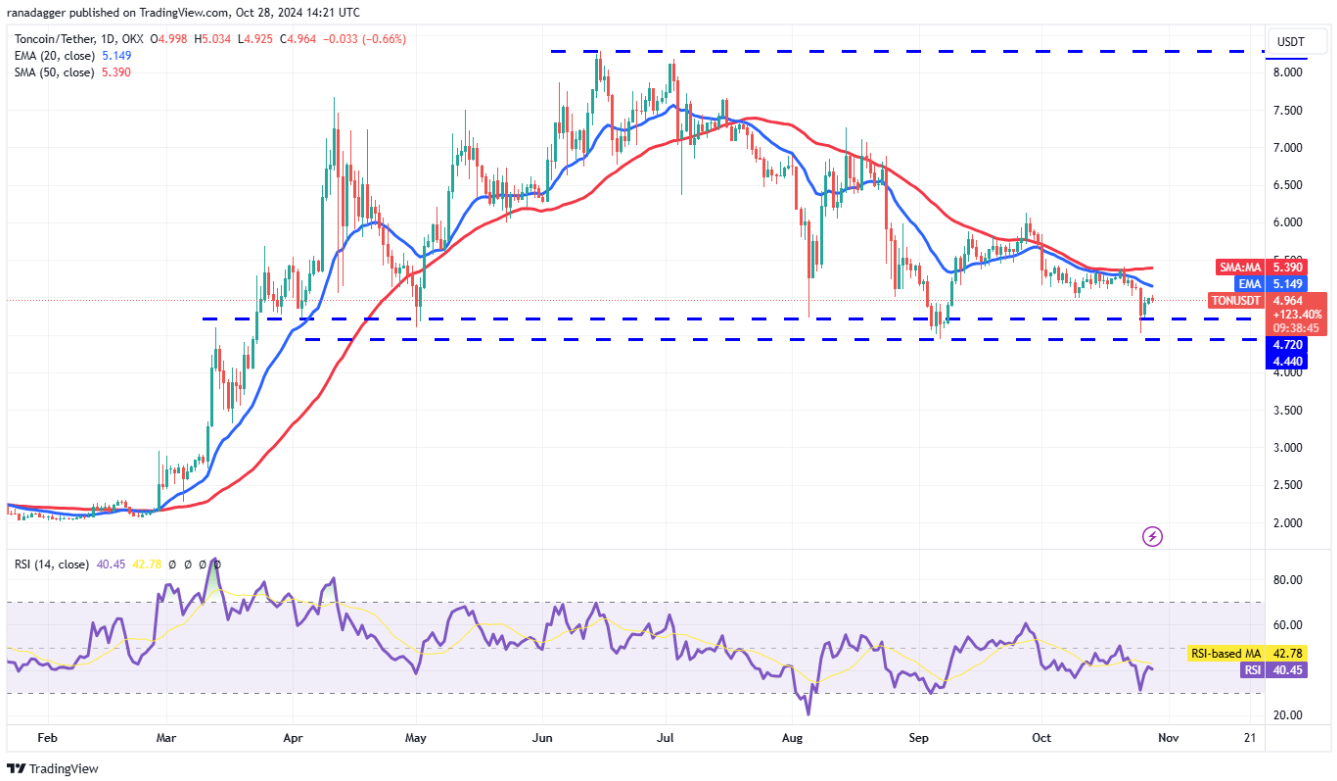
Toncoin (TON) price has bounced from the crucial support zone of $4.72–$4.44 on October 25, but the bulls are struggling to push the price above the moving averages.
Daily TON/USDT chart | Source: TradingView
The bears will try to consolidate their position by pulling the price below $4.44. If successful, the TON/USDT pair will complete a bearish head and shoulders pattern, paving the way for a decline towards the $3.50 level.
This negative outlook will be invalidated in the short term if the price rises again and moves above the moving averages. In that case, the pair could climb to the $6 level, which is expected to be a strong resistance.
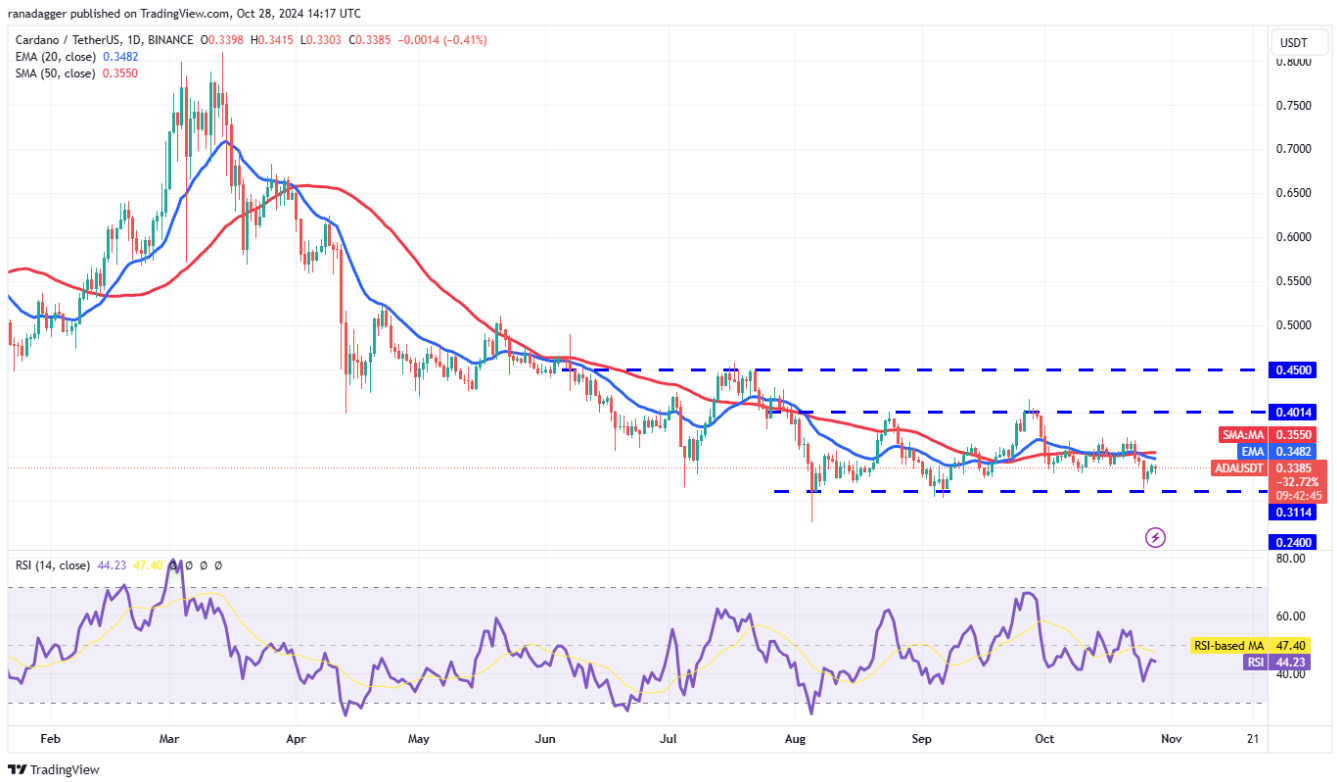
Cardano (ADA) price has bounced from the $0.31 support level on October 26, but this recovery attempt is facing selling pressure at the moving averages, indicating that the bears are trying to regain control.
Daily ADA/USDT chart | Source: TradingView
The sellers will try once again to pull the price below the $0.31 support level. If successful, the ADA/USDT pair could continue its downtrend and drop to $0.27, a level expected to act as strong support.
Conversely, if the price rises from the current level or bounces strongly from $0.31, it will indicate buying activity at lower price levels. In that case, the prospects of breaking above the moving averages will improve, and the pair could move towards the $0.40 level.
You can view coin prices here.
Disclaimer: This article is for informational purposes only and is not investment advice. Investors should do their own research before making any investment decisions. We are not responsible for your investment decisions.
Join Telegram: https://t.me/tapchibitcoinvn
Follow Twitter (X): https://twitter.com/tapchibtc_io
Follow Tiktok: https://www.tiktok.com/@tapchibitcoin
SN_Nour
According to Cointelegraph


