Driven by the historic high of Bitcoin and the growing dominance of RAY in the Solana ecosystem, the price of Raydium (RAY) has risen by 30% in the past few days. The protocol's impressive yields have established its leading position, while also fueling bullish sentiment towards its . More information Crypto Dumplings

However, like any rebound, there may be a pullback before further price appreciation.
Reflecting Raydium's performance?
blockchain has enjoyed strong utility throughout 2024, and Raydium, as one of the top DEXes, has benefited from this.
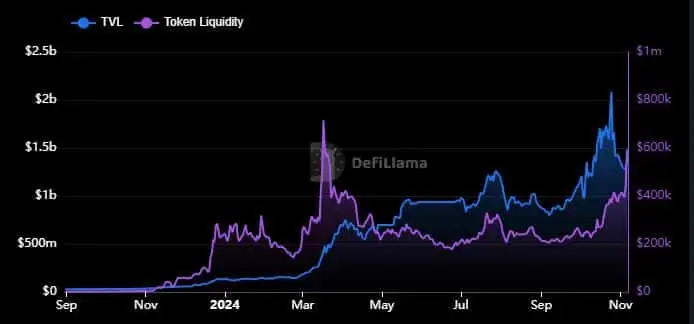
Just 12 months ago, Raydium's TVL was less than $40 million, and its liquidity was less than $10,000.
Both of these metrics have recently seen impressive growth, with TVL reaching a peak of $2.08 billion in October, though it has since retreated to $1.5 billion. Meanwhile, the RAY liquidity has soared to $597 million.

The growth in TVL and liquidity highlights Raydium DEX's momentum in 2024, which is in line with the growth of the ecosystem.
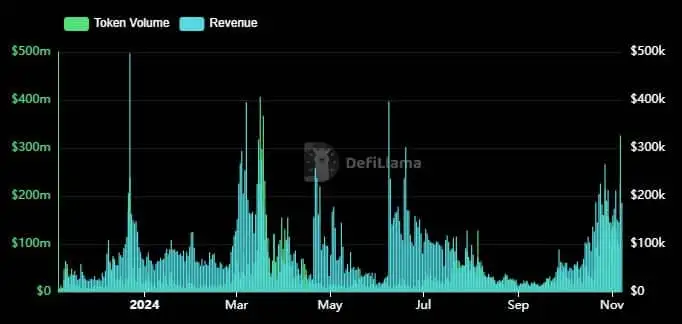
However, this growth and network activity is more evident in Raydium's revenue and trading volume data.
Trading volume and revenue both peaked in March, June, and October, with declines in between.
For example, the highest trading volume since the start of 2024 was in March, at around $406 million. Meanwhile, the highest revenue in March was $395,000.

The latest data shows that both trading volume and revenue have been on an upward trend since September, reflecting the surge in bullish activity.
This is consistent with the observation of declining metrics during economic downturns or bearish months.
Based on the above observations, it is clear that DEX activity has had a significant impact on the demand for RAY. As the bull market becomes more intense, this trend may continue.
RAY RSI shows overbought territory
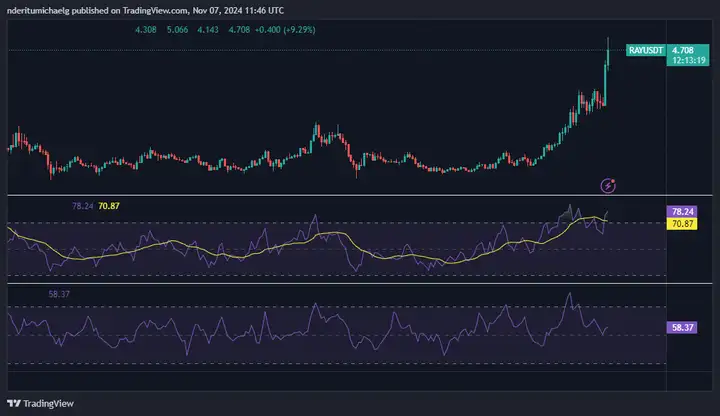
The price of Raydium (RAY) has soared by 30% in recent days, with its RSI jumping from 45 to above 70. This rapid growth indicates strong buying momentum, pushing the asset into overbought territory.
Such high RSI levels typically suggest the price may have risen too quickly, potentially leading to a short-term correction.

RSI, or the Relative Strength Index, is a momentum indicator used to assess whether an asset is overbought or oversold. Generally, RSI below 30 indicates the asset is oversold, suggesting it may be undervalued. On the other hand, RSI above 70 indicates overbought, implying the asset may be overvalued.
With RAY's RSI now above 70, it suggests the may face a correction soon, as the current level indicates an overbought condition. Before attempting to set new recent highs, RAY may need to cool off and establish more stable support.
In summary, despite its impressive performance, RAY still has significant room for growth before reaching historical highs. The reached a peak of $17.80 in August 2021. In the short term, due to RAY's current severe overbought condition, a short-term pullback may still occur. The has shown bearish divergence, with lower RSI highs. Additionally, the MFI has been declining, indicating profit-taking is taking place.
RAY Price Prediction: Is a 44% Correction Imminent?
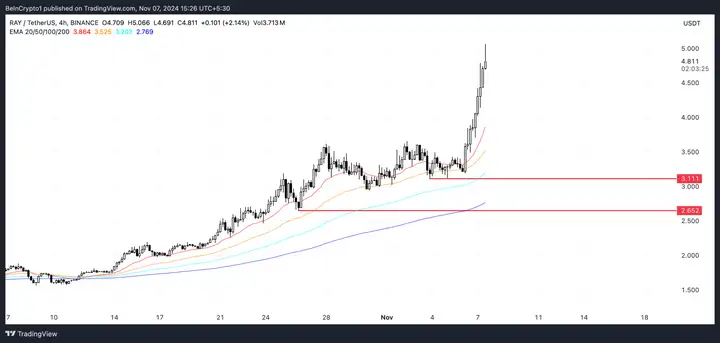
The RAY price is approaching its highest levels since 2022 and may soon break above the $5 mark. However, a strong pullback could occur before that.
Market conditions can be volatile, and if buying momentum wanes, the current optimistic levels may be tested.

RAY's EMA lines are exhibiting a bullish trend, with the short-term EMA above the long-term EMA and maintaining a healthy distance between them. This suggests the asset is currently in a strong uptrend. If the uptrend continues and the RSI remains stable without a pullback, RAY may break above the $5 level and continue to rise. On the other hand, if bearish pressure emerges, the price could retrace to the strong support area of $3.11 or even $2.6, implying a potential 44% correction from the current levels.


