Last (13) night, the US released CPI data that met expectations, adding momentum to the rise in the cryptocurrency market. Bitcoin once surged to $93,477.11, rising more than $7,000 intraday, but then plummeted by more than $5,000, causing over 250,000 people to be liquidated. Investors are wary of the potential correction in the cryptocurrency market.
glassnode: Bitcoin may see a correction within 10 days
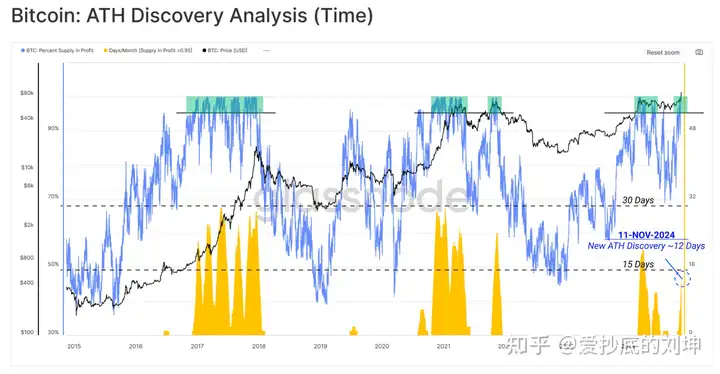
On the 12th, the latest report released by glassnode provided clues about the timing of a possible correction. The report pointed out that Bitcoin has entered a new round of price discovery after a new high, and all circulating supply is in a profitable state. Historically, this "euphoric" phase has lasted about 22 days, after which the market corrects, causing more than 5% of the supply to fall below the original purchase price.
The current rally has maintained this high profitability state for 12 days, highlighting the strong market sentiment, but according to past trends, it also suggests that the market correction period may be approaching.
The chart below shows the percentage of supply in profit (blue line) and the consecutive days when more than 95% of the supply was in profit each month (yellow), providing a reference for the timing of the market adjustment.

Over $20 billion in realized profits in November
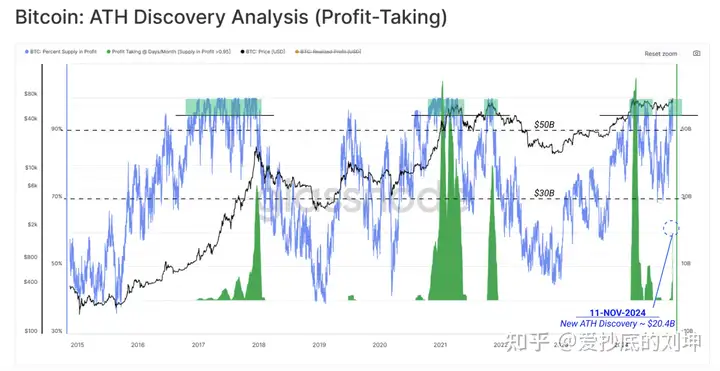
In addition, glassnode has calculated the cumulative realized profits during this phase to reflect the scale of market gains. The report pointed out that historically, the monthly realized profits during this phase have ranged from $30 billion to $50 billion, and so far in November, the market has realized $20.4 billion in profits, which is still lower than the historical peak, but still shows a considerable scale of profits.
If the Bitcoin price continues to rise, the realized profit scale in November is expected to exceed $30 billion, approaching the historical high. Therefore, observing the changes in this data can help judge how close the market is to a correction.

A rise to $94,900 may trigger a pullback
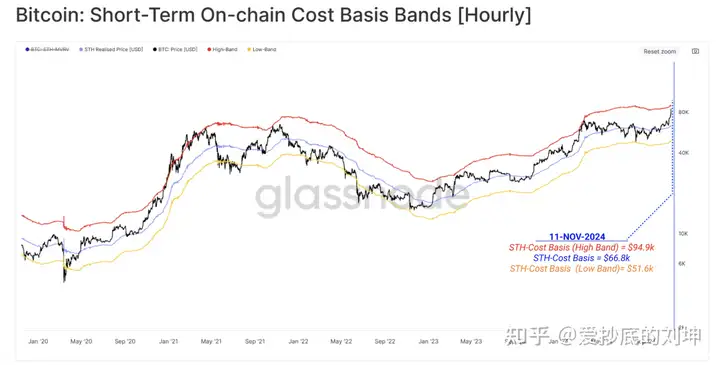
glassnode uses the short-term investor cost bandwidth in the chart below to predict the price level at which Bitcoin may encounter strong profit-taking.
glassnode explained that during the ATH discovery phase, Bitcoin prices often approach and test the upper limit (the red line in the chart) multiple times, as new investors enter at higher prices, driving strong demand momentum to push up prices. However, if the inflow of new capital is not enough to offset the profit-taking of early investors, the price may experience a correction.
Currently, the upper limit range for Bitcoin is set at $94,900. By observing the distance between the price and these bandwidth ranges, especially the distance between the upper limit and the middle range, it can reveal the gradual slowdown of Bitcoin's rally and the potential increase in selling pressure.


