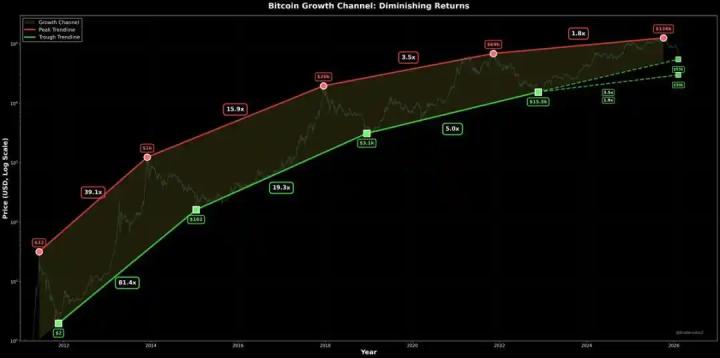
However, multiple key on-chain indicators suggest that the market has not yet entered the typical "main upward wave" of a bull market. The MVRV Z-score and Puell Multiple both show that the market has risen, but has not yet reached historical highs, while the 200-week moving average continues to provide strong support for the price, indicating that the market correction may be nearing its end.
We seem to be facing a new bull market that cannot be fully "grasping at straws", especially with the introduction of spot ETFs, which have brought more institutional investment capital, increasing market participation and liquidity, while also introducing new complexities to the market.
In addition, the political changes brought about by the US election, particularly the crypto-friendly policy expectations after Trump's victory, have led to new volatility in the crypto market.
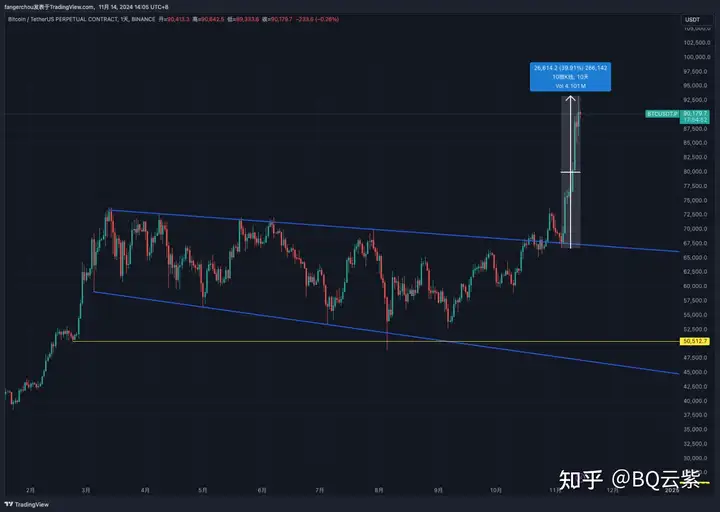
At this stage, the price of Bitcoin has broken out of its long-term oscillation range, rising by about 40% in just ten days, from around $66,800 to a high of around $93,200. Market sentiment is at an all-time high, with various investors flocking to the market, and optimism spreading.
"When others are greedy, we need to maintain a sense of awe towards the market."
In this context, let us return to on-chain data and re-examine the market status of Bitcoin, in order to assess what stage this bull market has reached. By observing key on-chain indicators, we can more calmly analyze whether there is still room for further upside in the market, or if it is gradually approaching a cyclical top. This rational perspective can help us remain clear-headed amidst the market frenzy, so as not to be swept away by blind optimism in the continued heat of the bull market.
Bitcoin MVRV Z-score: Still Optimistic
The MVRV ratio is one of the most popular and widely used on-chain indicators. The MVRV (Market Value / Realized Value) ratio is a common on-chain analysis metric that assesses the "unrealized profits" or "unrealized losses" in the market by measuring the relationship between market price and Bitcoin's realized price. Proposed by Murad Mahmudov and David Puell in 2018, this indicator has become a key tool for analyzing Bitcoin market cycles, used to identify market tops and bottoms, and to recognize turning points in the cycle.
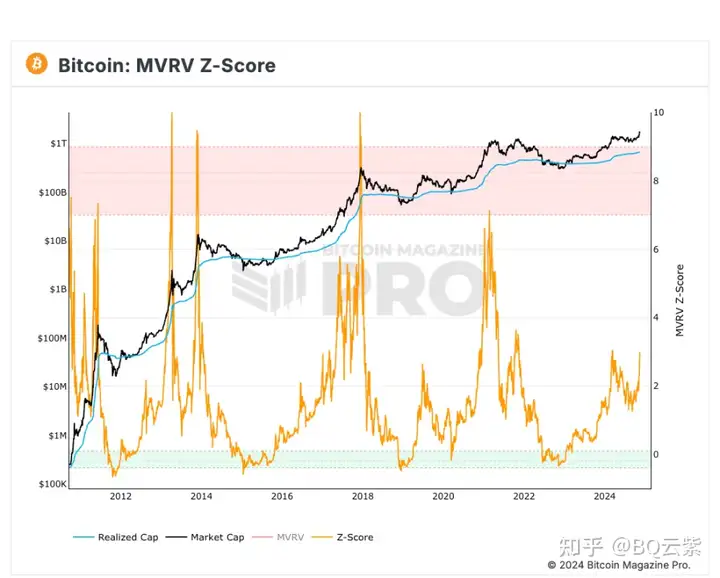
The MVRV Z-score is a further extension of the MVRV ratio, using the concept of standard deviation in statistics to more precisely measure the extreme conditions in the Bitcoin market. By calculating the degree of deviation between market value and realized value, the MVRV Z-score can identify extreme overvaluation or undervaluation of the market price relative to the realized value. This indicator is typically represented by an orange line, and when it enters the pink zone at the top, it indicates that the market is overheated, often occurring at the top of a bull market cycle; when it enters the green zone at the bottom, it indicates that the market price is severely undervalued, often occurring at the bottom of a bear market.
Currently, the MVRV Z-score, after experiencing a period of retracement and recovery, has not yet reached the extreme highs of the previous bull market cycles. This position indicates that the market price of Bitcoin is in a relatively optimistic upward range, and there may still be some room before the market becomes overheated or reaches a cyclical high.
Puell Multiple: Not Yet Reached Peak
The Puell Multiple is another indicator that is consistent with the cycle peak, which calculates the "ratio of current miner revenue to the 365-day moving average of miner revenue", where miner revenue is primarily the market value of newly issued Bitcoin (the new Bitcoin supply that miners receive) and related transaction fees, which can be used to estimate the miners' earnings situation.
The formula is: Puell Multiple = Miner Revenue (Market Value of New Issuance) / 365-day Moving Average of Miner Revenue
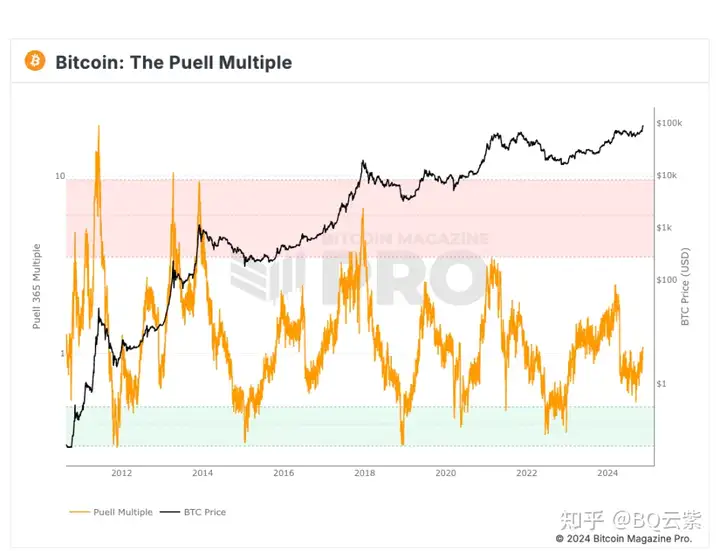
The Puell Multiple is mainly used to measure the selling pressure of Bitcoin miners. Initially, the Puell Multiple only calculated the block rewards for miners, but as the proportion of transaction fees in miner revenue has increased, Puell has updated the formula to include transaction fees, reflecting a more comprehensive miner revenue.
The purpose of this indicator is to help traders understand the degree of selling pressure from miners: when the Puell Multiple enters the green zone, it means that the daily issuance value of Bitcoin is abnormally low, which is usually a good opportunity to buy the dips, and investors who have bought in during these periods have often achieved excess returns. Conversely, when the Puell Multiple enters the red zone, it indicates that miner revenue is significantly higher than the historical standard, and at this time the Bitcoin price is often at a high, which is a favorable time to take profits.
Previously, the low point of Bitcoin was close to the green zone, and currently it is in a slow upward phase, but it is still a long way from the high point in the red zone.
2-year MA Multiple and 200-week Moving Average Heat Map:
The Bitcoin 2-year MA Multiple and 200-week Moving Average Heat Map are both indicators used to analyze the long-term trend of Bitcoin prices. The 2-year MA Multiple refers to the ratio between the Bitcoin price and its 24-month (about 2 years) Simple Moving Average (SMA), used to measure whether the Bitcoin market price is overvalued or undervalued relative to the long-term average level. It helps to judge whether the Bitcoin price is in a relatively high or low valuation state.
Bitcoin's 200-week Moving Average (200WMA) is a very important long-term trend indicator, typically used to measure the long-term health of the Bitcoin price. This indicator shows the average price over the past 200 weeks (about 4 years), reflecting the long-term cycles and price fluctuations of the market.
The 200-week Moving Average Heat Map visualizes the ratio of the current Bitcoin price to the 200-week MA, reflecting the "overheated" or "overcooled" state of the market.
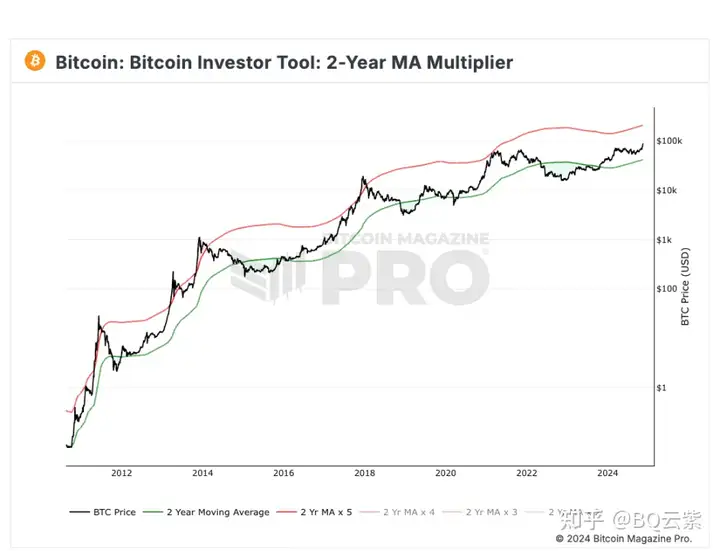
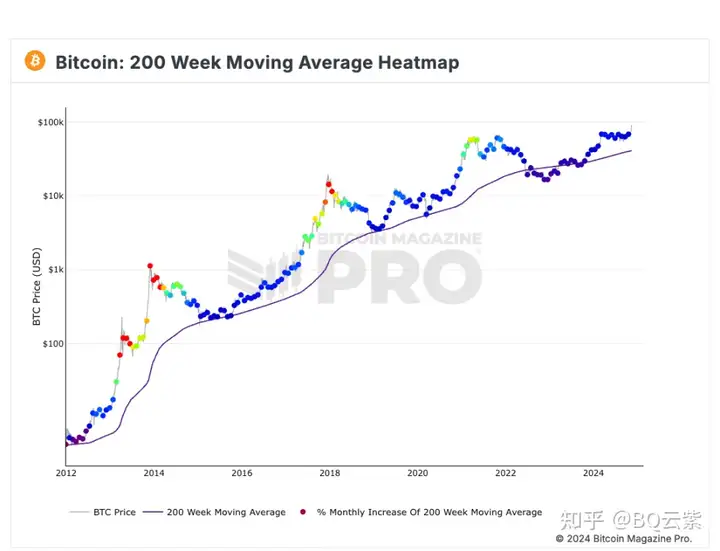
The heat map clearly shows the cyclical fluctuations of the Bitcoin market. When the Bitcoin price remains in the blue state for a long time, it indicates that the market heat is still relatively balanced, while when it turns to green, orange, or even red, it suggests that the market may be overheated, with the price far above the long-term average level, and there may be a risk of price correction.
It can be seen that the current market is still in a relatively healthy state, and has not yet begun to show widespread "FOMO" sentiment.
Strong Demand vs. Frantic Supply
According to the on-chain analyst @Murphychen's detailed data, the current Bitcoin market is in a stage where demand and supply are extremely opposed, reflecting the extreme volatility of market sentiment.
Especially driven by the excitement of US investors, strong demand has pushed Bitcoin prices to new highs. At the same time, the market's supply pressure has also risen sharply. The continuous distribution by miners and long-term holders (LTHs) has led to a large amount of "hot supply" in the market, a phenomenon that usually only occurs in extreme market sentiment, such as FOMO or panic periods.
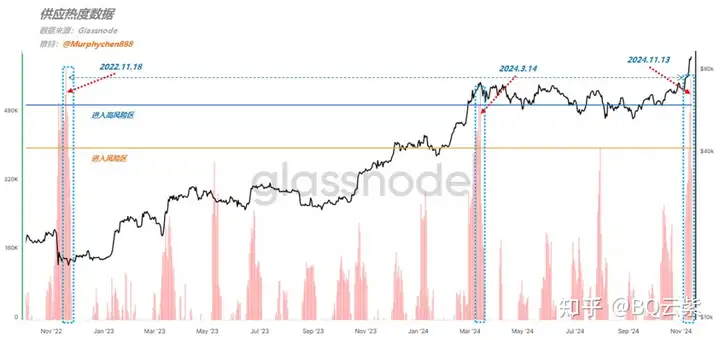
Particularly on November 13th, the surge in market supply broke through the high point of this year in March, when the capital distribution of the Grayscale ETF had not yet ended, but now there is no similar driving force. This supply surge is similar to the market panic when Bitcoin fell to $16,000 in November 2022, indicating the huge contrast in current market sentiment. The behavioral pattern of long-term holders also further corroborates the selling pressure in the market, and although there are no obvious signs of a top yet, the continuous distribution by LTHs has pushed the market into a "medium-risk" zone, approaching the critical point of accelerated distribution.
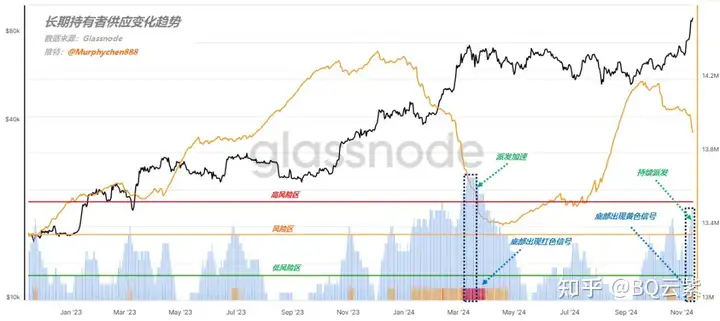
Although the supply pressure in the market is increasing, the strong demand is still supporting the upward trend of Bitcoin prices. Especially since November 11, the high sentiment of US investors has become an important factor driving the price increase. Data shows that from October to November, the dominant force in the market shifted from Asia and Europe to the United States, and this change has made the driving force of the market more obvious. Accompanied by the increase in demand, the market's profit-generating capacity is also rising rapidly, indicating that the demand is not just a short-term phenomenon, but a strong driving force that has lasted for some time.
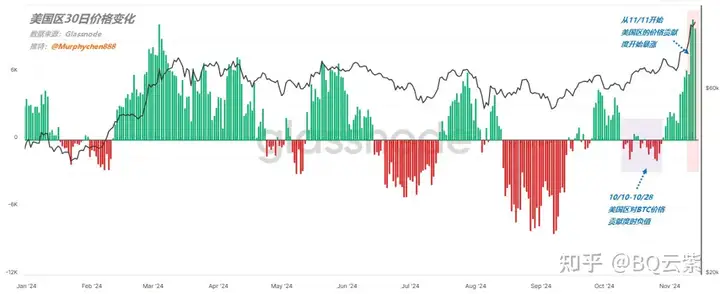
However, the "crazy" sentiment in the market also reminds us that although there are no obvious signs of a top, the risks of a bubble may be brewing behind the excessive supply and the constantly growing demand. When the demand and supply in the market reach a critical point at a certain moment, the bursting of the bubble may occur at any time. Investors should remain rational and vigilant at this time, be aware of the unpredictability of the market, and avoid losing their direction in the frenzy. Therefore, although there still seems to be room for upside in the short term, the imbalance between supply and demand in the market may indicate potential risks in the future.


