The Bitcoin (BTC) transaction-to-network value (NVT) golden cross indicator has recently fallen into negative territory. This suggests that the recent surge of cryptocurrency above $93,000 may not mark the peak of this bull run. BeInCrypto has analyzed the current state of the indicator and observed it.
Bitcoin is currently trading at $90,893. The reason this slight decline may not persist is as follows: Instead, Bitcoin's price could well exceed its all-time high.
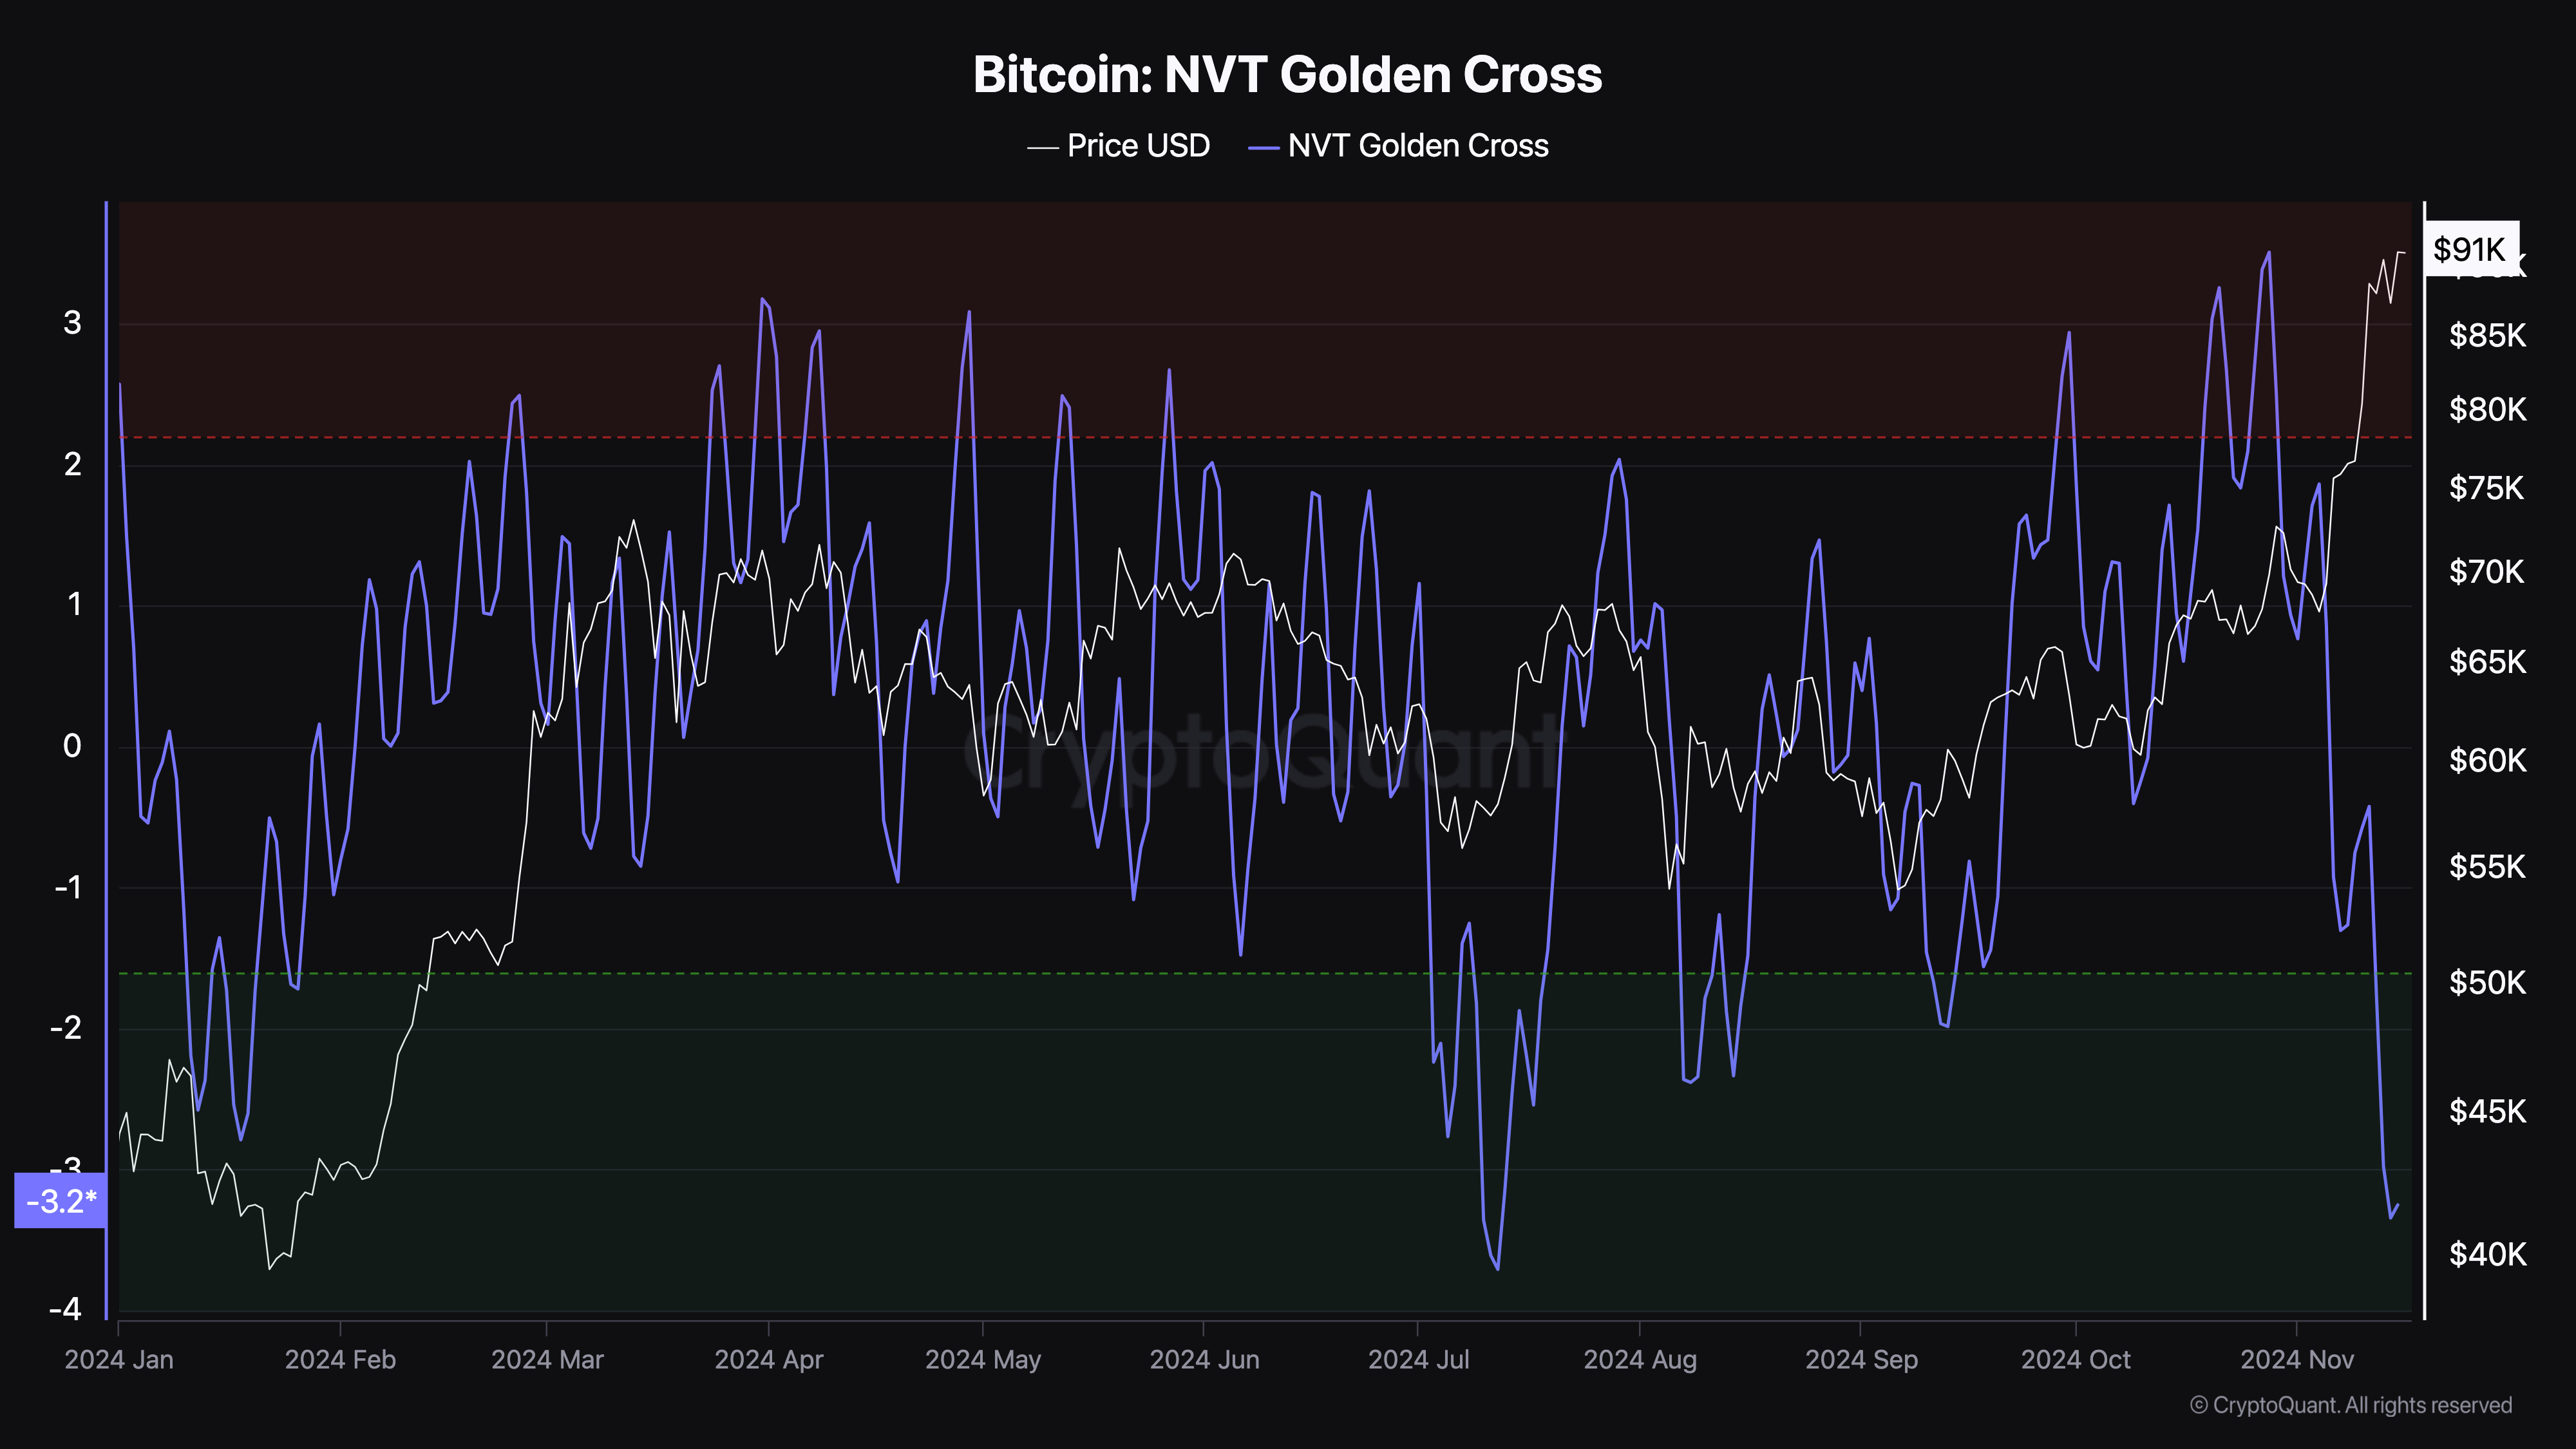
NVT Golden Cross Indicator at -3.25...Bitcoin Has Upside Potential
Bitcoin's NVT Golden Cross is an indicator that helps detect cycle tops and bottoms. When the NVT Golden Cross exceeds 2.2 points (red zone), it indicates a short-term overbought trend in prices and may signal a short-term top.
Conversely, when it falls below -1.6 points (green zone), it indicates prices are excessively cooling and may point to a potential local bottom. According to CryptoQuant, the current value of this indicator is -3.25, suggesting Bitcoin's price has room to rise.
For example, in January when the indicator was at -2.60, BTC was trading below $42,000. About two months later, the coin reached $73,000. Therefore, considering the historical data and the current position of the indicator, the likelihood of BTC reaching $100,000 by the end of this year is high.

This outlook also aligns with the view of analyst Crypto Kaleo. According to Kaleo, the possibility of Bitcoin reaching $100,000 could draw retail investors back in and push the price even higher.
"If Bitcoin breaks 100K, it's going to shock everyone and just keep going, not looking back. It's been such a psychological milestone for so long that when it happens, retail FOMO will come back in full force," an anonymous analyst wrote on X.
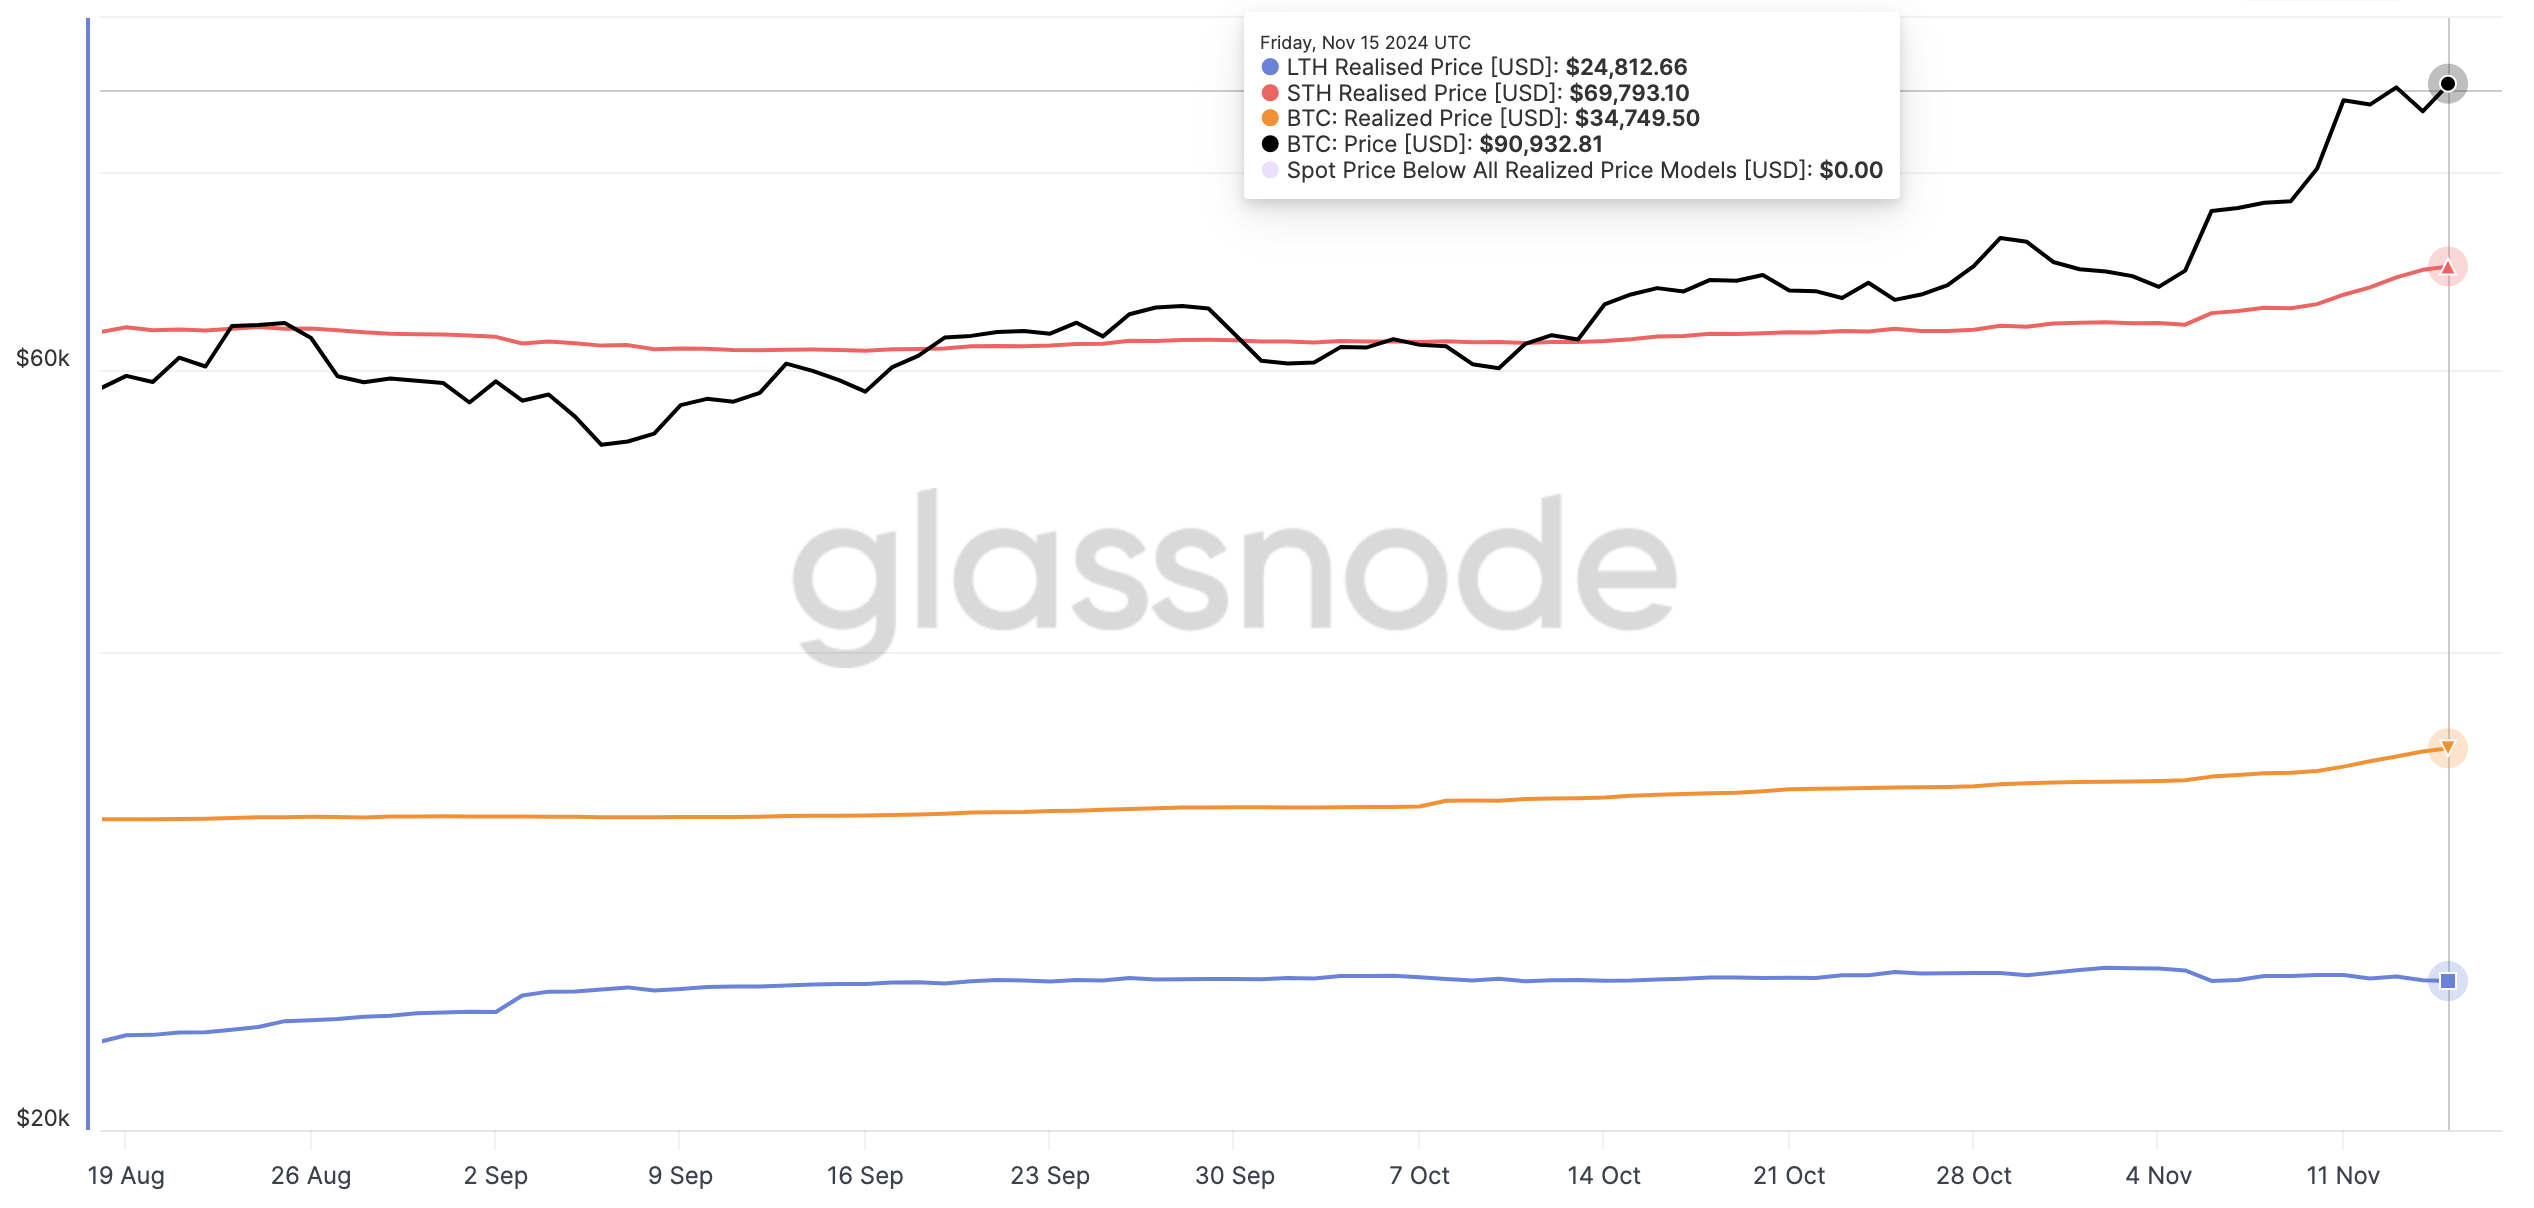
Additionally, Glassnode data shows that Bitcoin is currently trading above the realized price of both short-term holders (STH) and long-term holders (LTH). Realized price represents the average price paid by market participants and serves as an on-chain indicator for potential support or resistance levels.
Generally, when the realized price is higher than BTC, the cryptocurrency faces resistance, making price appreciation difficult. However, as seen above, the STH realized price of $34,749 is lower than BTC's value of $69,793, indicating the price can continue to rise.

BTC Price Prediction: Next Top at $104,228?
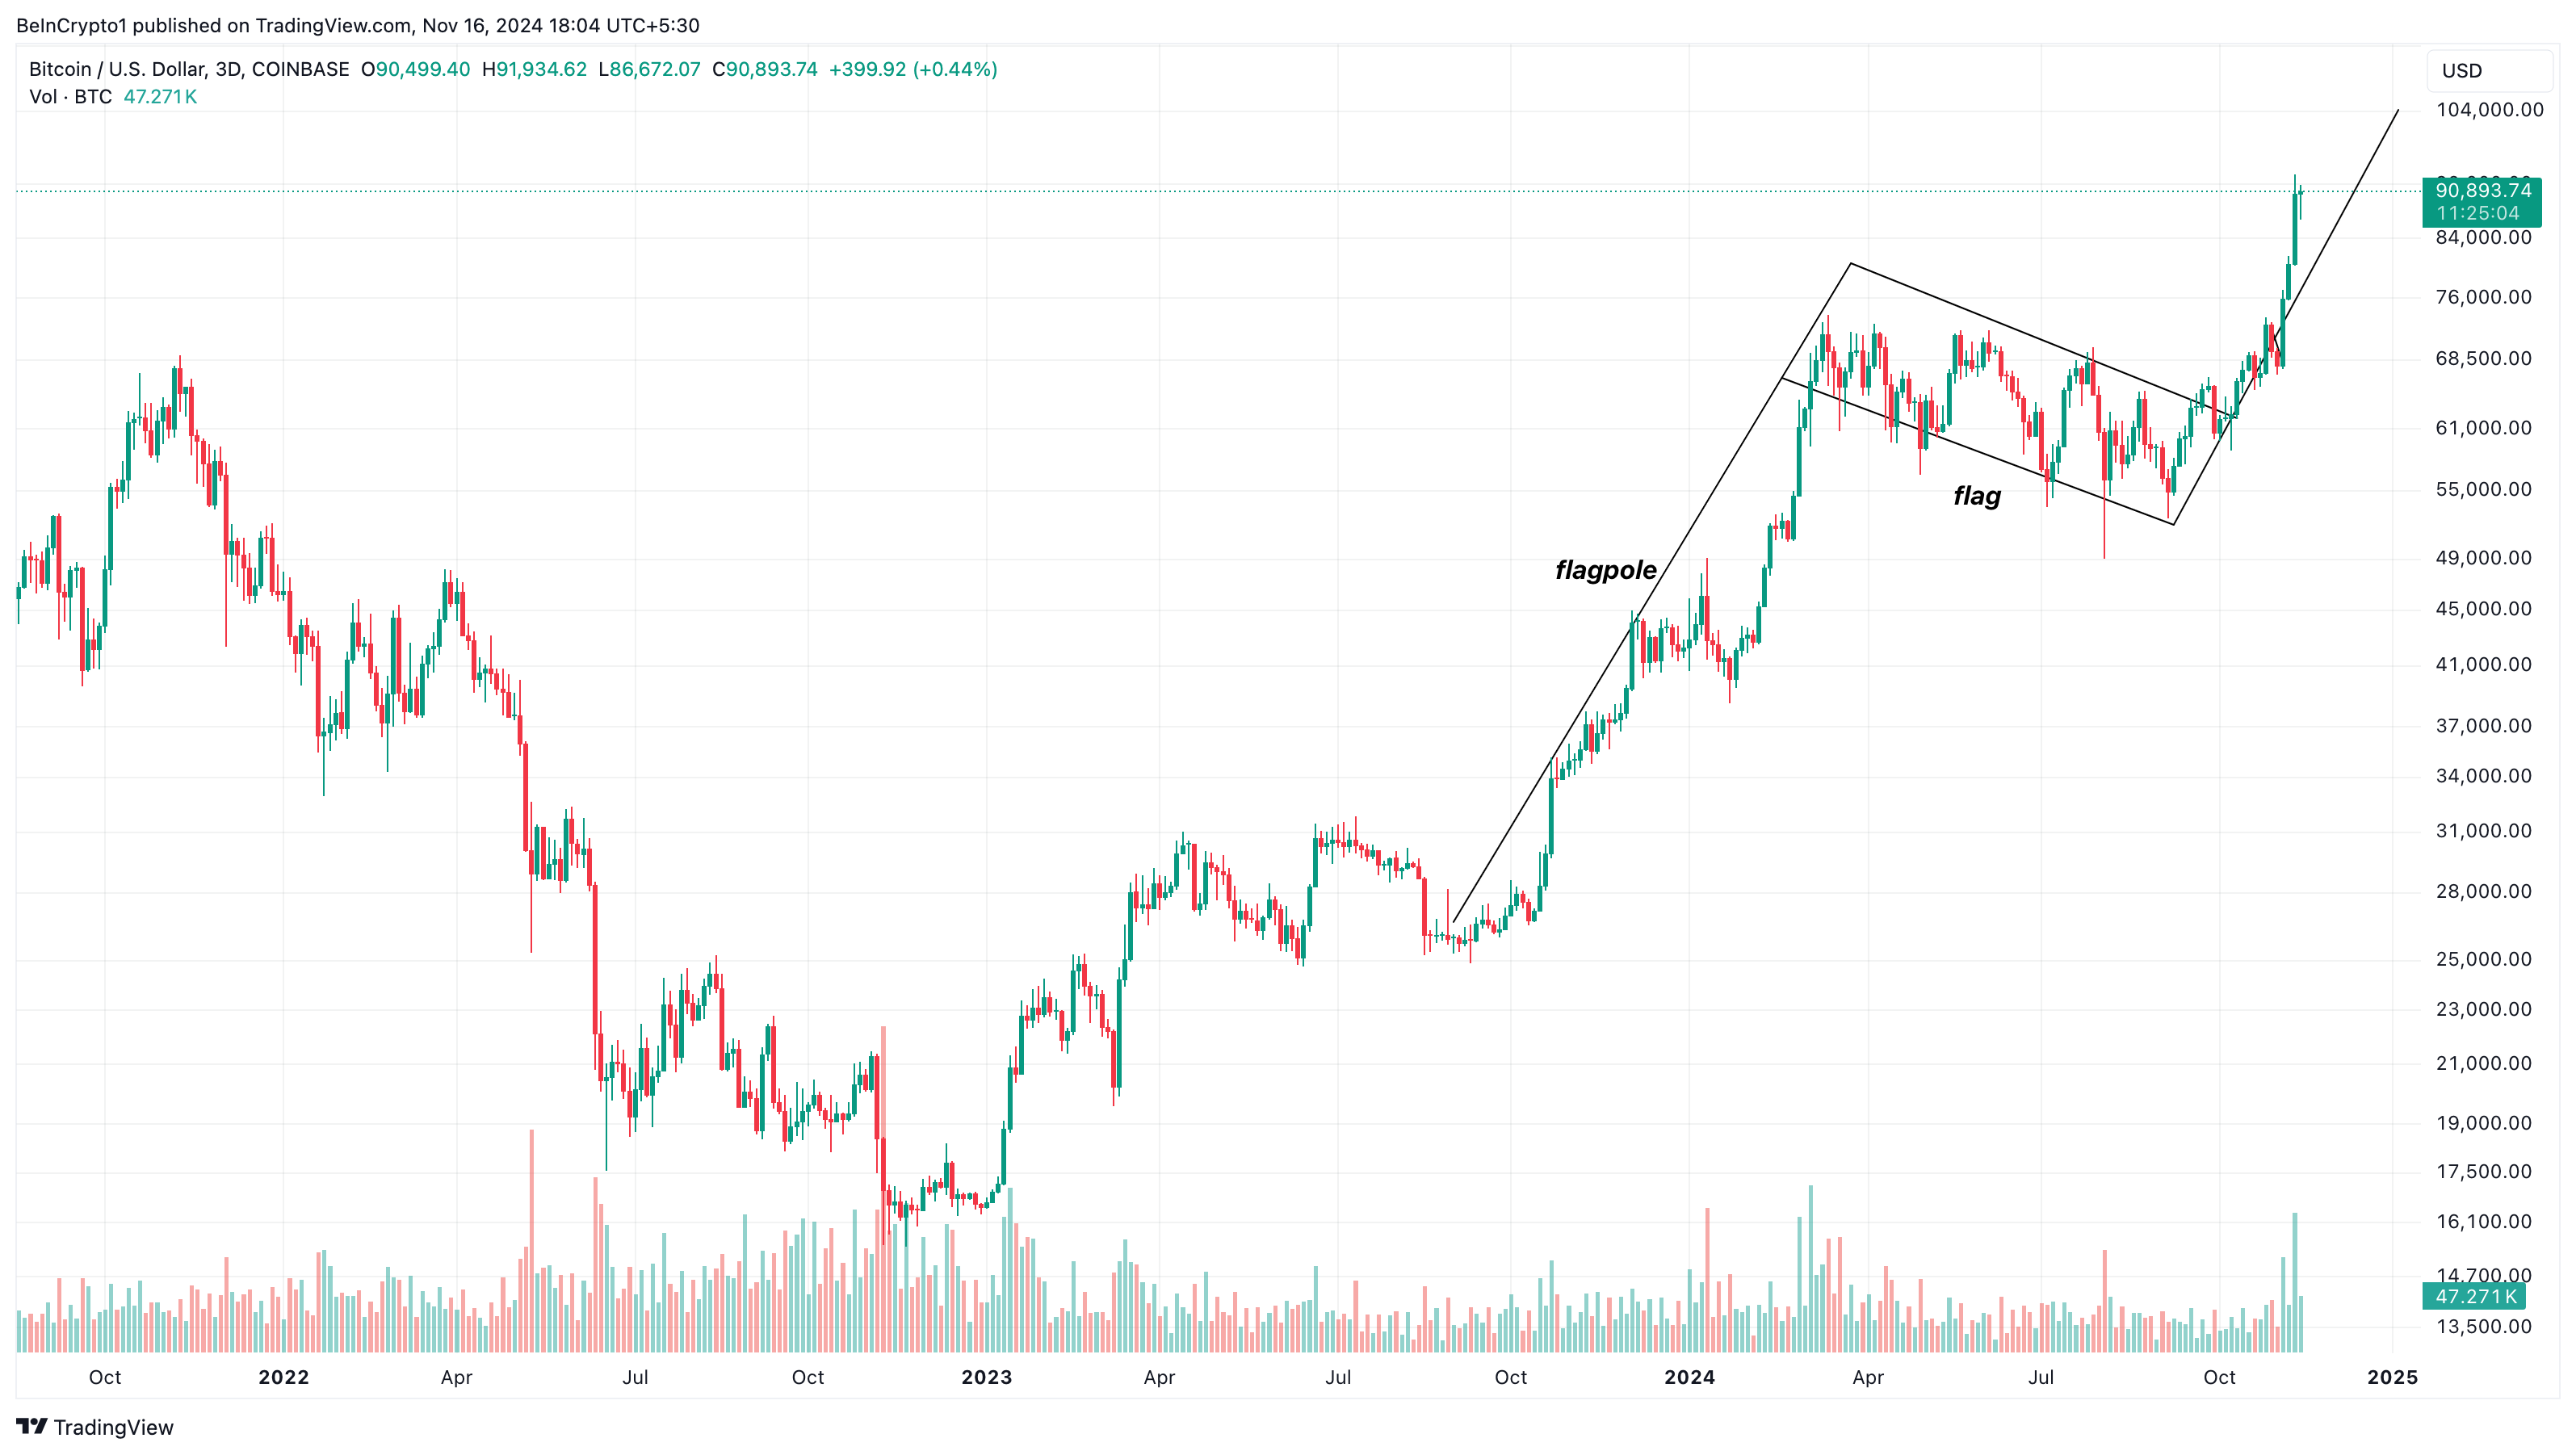
On the 3-day chart, Bitcoin has formed a bullish flag pattern. A bullish flag is characterized by two rallies separated by a brief corrective phase, with the flagpole forming during a sharp price increase driven by buying pressure.
In the ensuing pullback phase, the price movement creates parallel upper and lower trendlines, forming the flag shape. Considering the current outlook, as long as buying pressure increases, Bitcoin's price could rise to $104,228.

However, if Bitcoin's NVT Golden Cross records an extremely high value, it could signal a local top for BTC. In that case, the coin's price may experience a noticeable correction.


