The price of Mantra (OM) recently hit a new all-time high on November 18 and has surged 155.29% in the past 7 days. This explosive rebound highlights the strong bullish momentum, propelling OM to its highest level to date.
However, recent indicators, including the RSI and Ichimoku Cloud, suggest that the uptrend may be weakening.
Join the discussion group →→VX: TZCJ1122
OM RSI shows neutral zone
The Relative Strength Index (RSI) of OM is currently at 52.7, lower than the overbought levels of above 70 reached during the period of November 16-18, when the index remained above 70 as the narrative around real-world assets (RWA) continued to grow.
This decline indicates a slowdown in buying momentum, suggesting that the previously strong upward pressure has eased. This shift reflects a more balanced market, with buyers and sellers now exerting similar influences on the OM price.

The RSI measures the strength of price movements, with levels above 70 indicating a strong bullish trend and potential overbought conditions, while levels below 30 indicate strong bearish pressure.
With the OM RSI at 52.7, it is in the neutral zone, indicating that the market is neither overheated nor oversold.
Ichimoku Cloud shows Mantra's uptrend is weakening
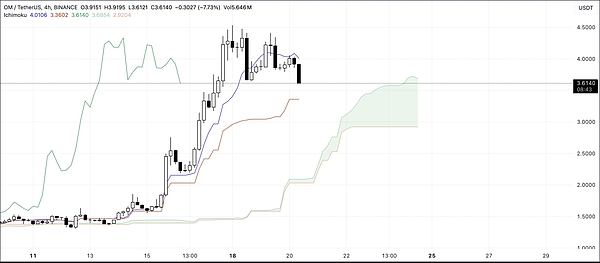
The Ichimoku Cloud chart for OM shows signs of price softening. The price has fallen below the Tenkan-sen (blue line), indicating a loss of short-term momentum, and is currently approaching the lower limit of the green cloud (Kumo).
A break below the cloud would signal a shift towards a bearish trend, as the cloud typically acts as a key support area.

The green cloud ahead remains relatively thick, suggesting that although the overall trend may still have some support, this support is being tested.
If the OM price closes below the cloud line, it may indicate that the recent uptrend could reverse into a sustained downtrend.
OM Price Forecast: Will Mantra break below $3 in November?
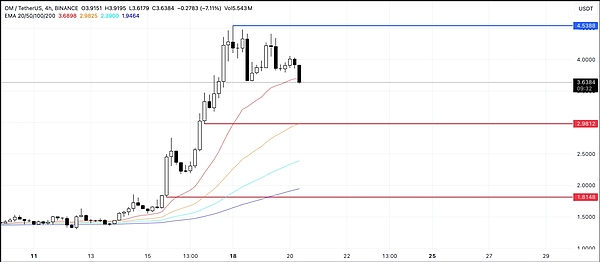
If the downtrend in OM continues to strengthen, it may test its recent support area of $2.98. If it fails to hold this level, the price could further decline, potentially reaching $1.81.
This scenario would signal a more severe bearish reversal and a significant loss of momentum.

On the other hand, if the uptrend resumes, the OM price may test the $4.53 resistance area, aiming for new highs.
Breaking above this level could propel OM beyond its previous peak and set a new all-time high, making Mantra one of the most relevant tokens in the RWA ecosystem.
That's the end of the article. Follow the public account: Web3 Tangy More great articles await you~
If you want to learn more about the crypto world and get the latest news, feel free to consult me. We have the most professional community, where we publish daily market analysis and recommend high-potential coins. No threshold to join the group, welcome everyone to discuss together!
Join the discussion group →→VX: TZCJ1122


