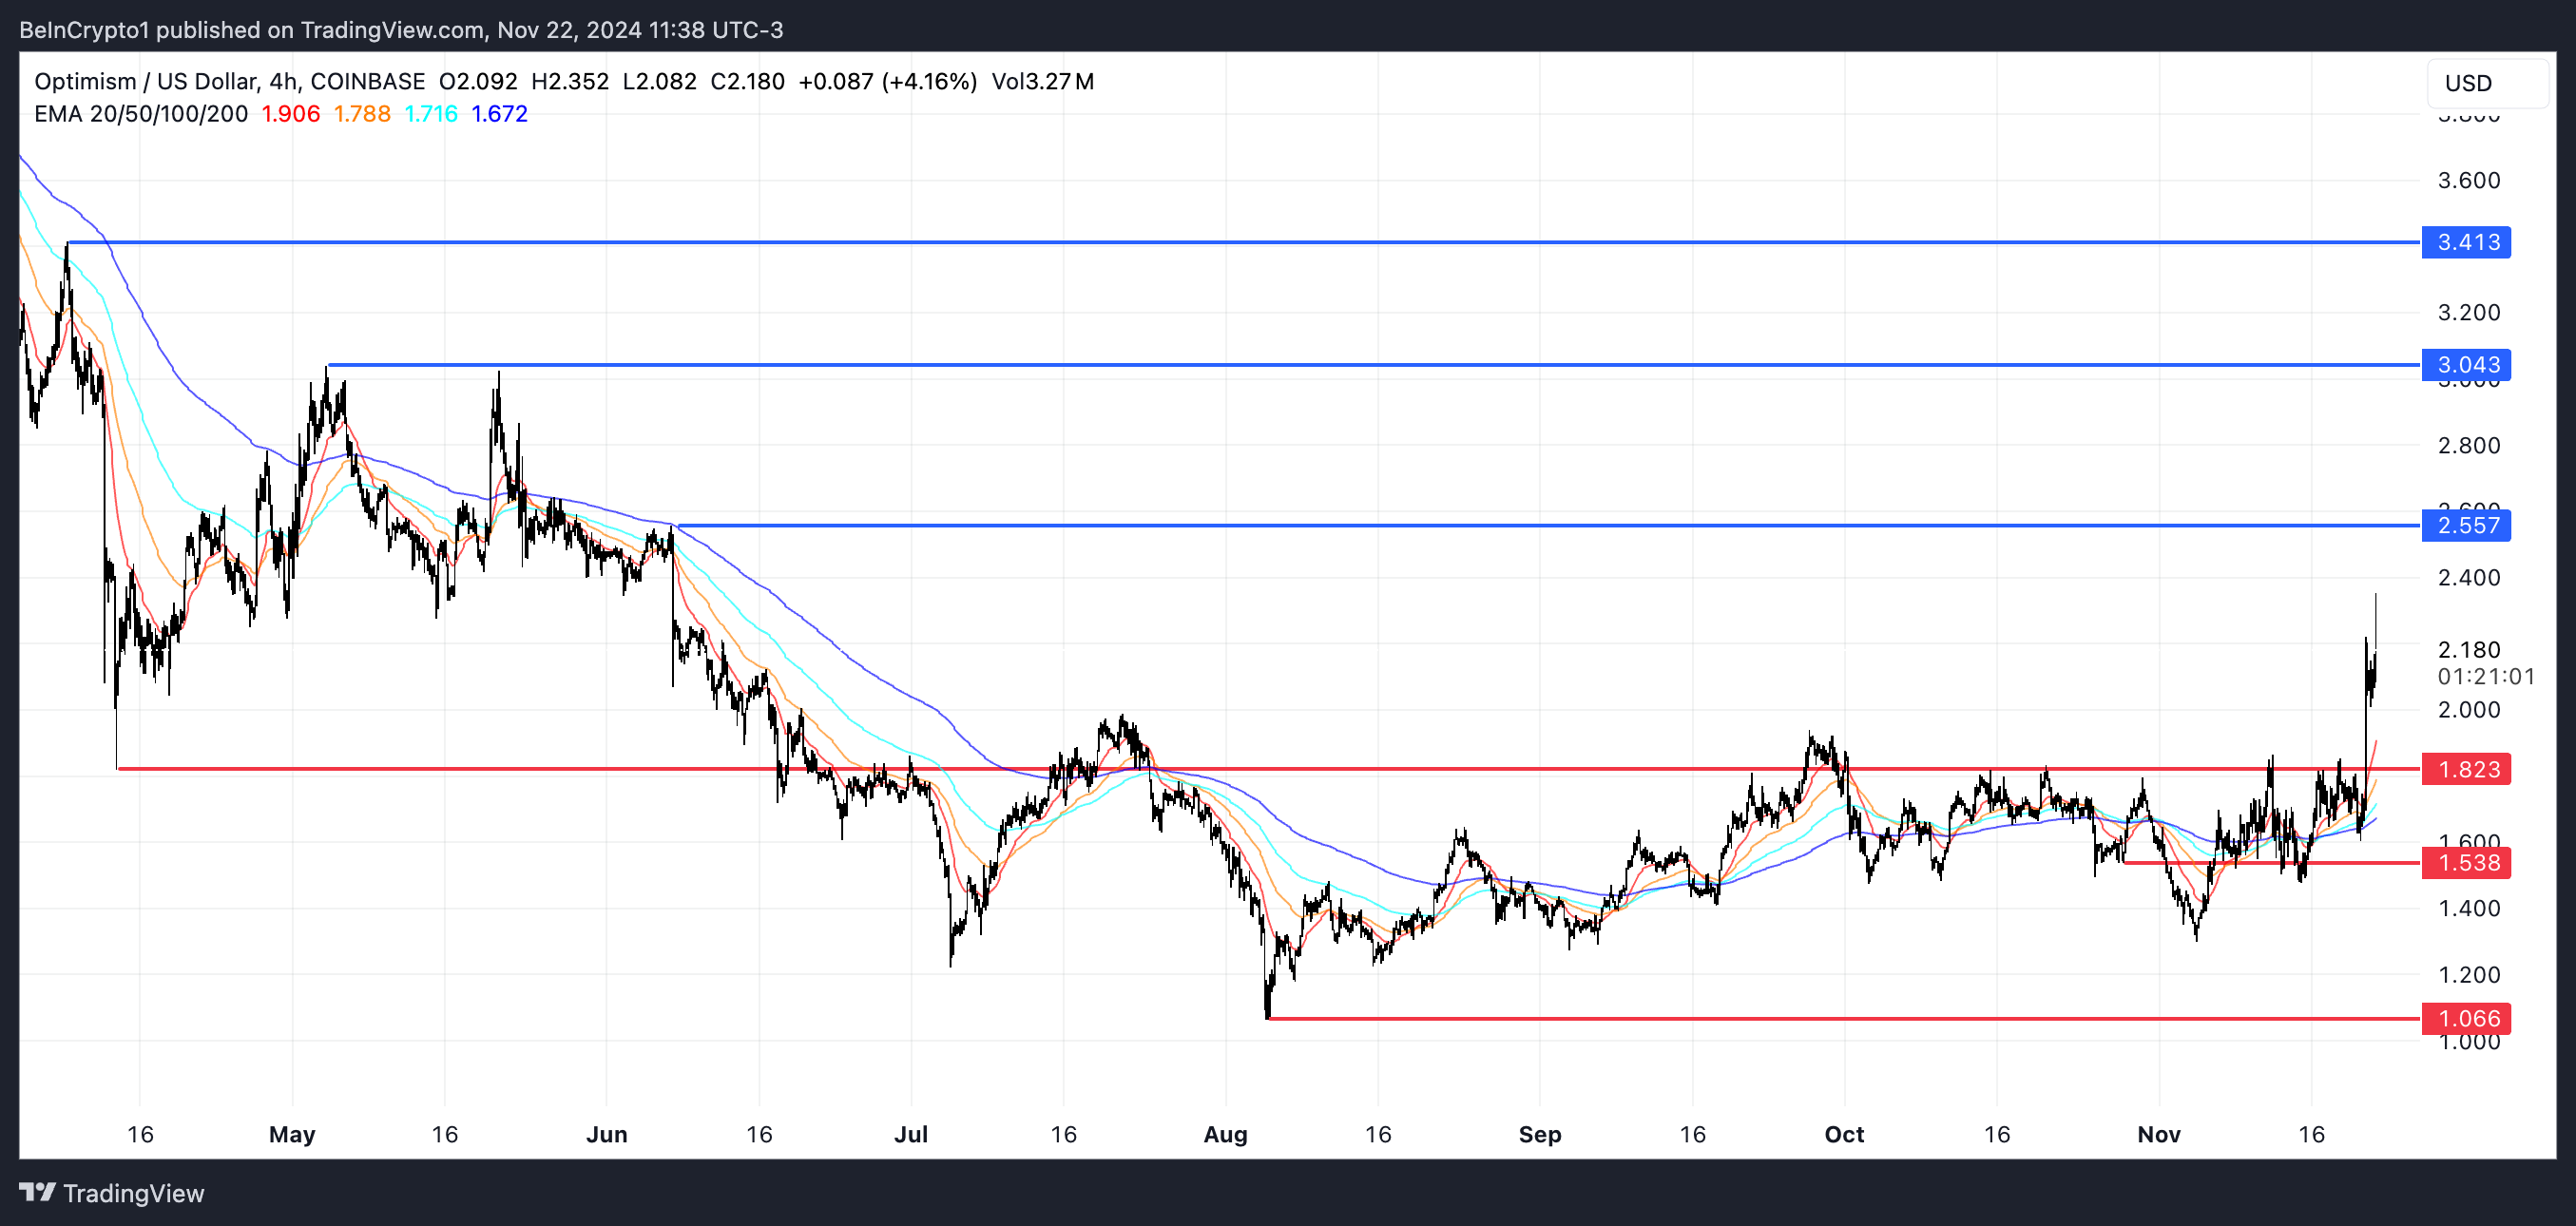
The price of Optimism (OP) has risen 43.40% over the past 7 days, showing strong bullish momentum in the market. The uptrend is supported by an increase in the ADX, indicating a strengthening trend, and the EMA lines are also pointing upwards.
Despite the uptrend, the decreasing trend in daily active addresses requires attention. This may indicate a decline in network activity and potential pressure on the OP price. Whether OP can test the $3 resistance or face deeper correction will depend on the strength of buyer interest in the coming days.
Optimism's Uptrend Gaining Strength
Optimism's current ADX is 28.7, a significant increase from below 15 the previous day. The sharp rise in ADX indicates that the current trend strength of OP is rapidly increasing, suggesting growing momentum behind the price movement.
ADX measures trend strength, with values above 25 indicating a strong trend and below 20 indicating a weak or non-existent trend. At 28.7, OP's ADX confirms that the uptrend is gaining traction, and if this strength persists, it can maintain additional bullish momentum.

The Positive Directional Index (D+) is 38.8, while the Negative Directional Index (D-) is 9.37, indicating that the upward pressure is significantly outweighing the downward activity. The large difference between D+ and D- reflects strong buyer dominance, reinforcing the uptrend.
The combination of rising ADX and high D+ suggests that as long as market conditions remain favorable and buying pressure persists, the price of OP can continue to rise.
Daily Active Addresses Declining
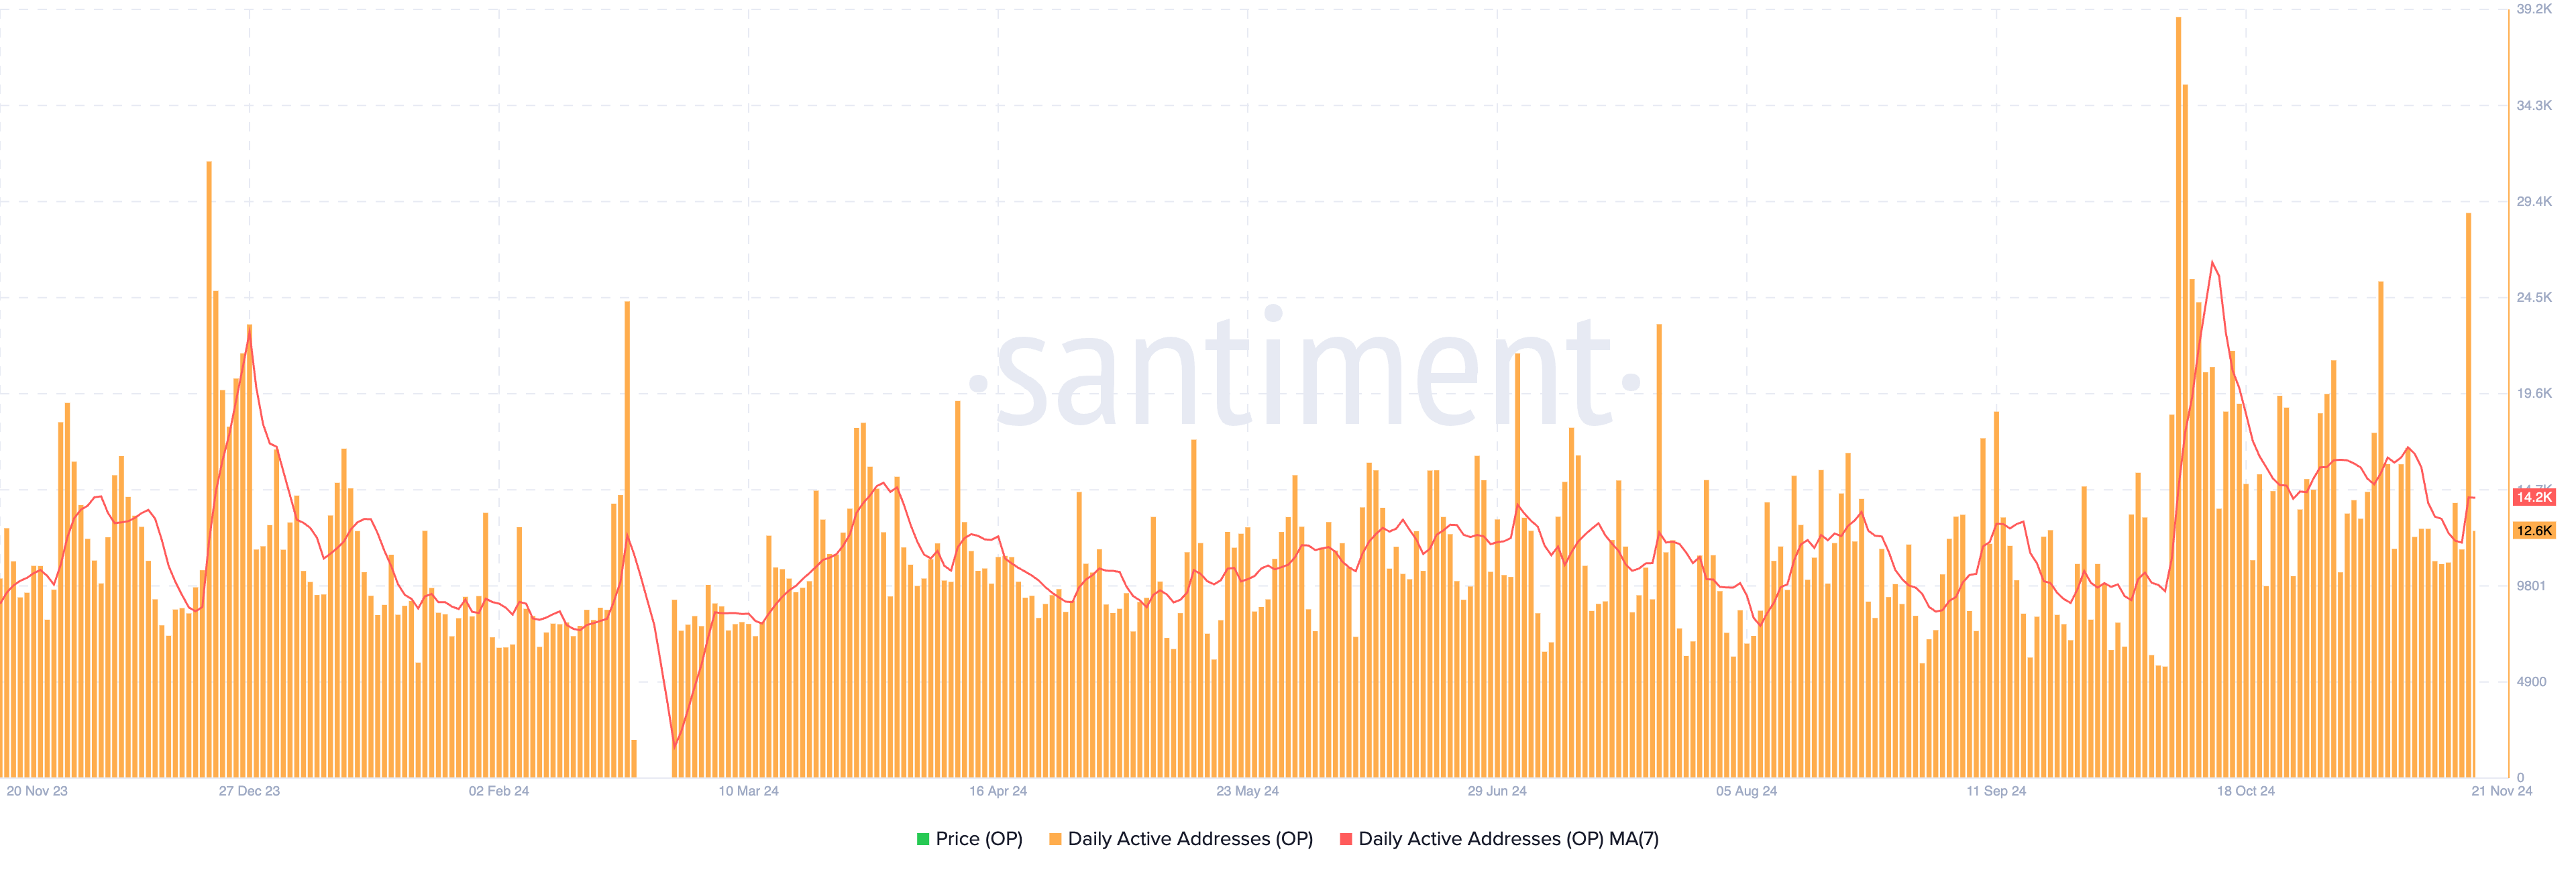
The 7-day moving average of OP's daily active addresses was 14,200 as of November 21st.
This metric reflects the number of unique wallets interacting with the network, indicating sustained strong activity, but has decreased from the annual high of 26,300 on October 13th.

Daily active addresses are an important indicator that provides insights into network usage and overall demand. The decreasing trend in this metric may signal a decline in interest or network activity, which could lead to reduced buying pressure on OP.
If this trend continues to decline, the cooling market sentiment could exert downward pressure on OP's price. However, a reversal in this metric could reignite bullish sentiment and support future price appreciation.
Optimism Price Prediction: Can it Reach $3 by November?
If the Optimism price maintains its uptrend, it could test the next resistance levels of $2.55 and potentially $3.04. A break above $3.04 could challenge OP's price to reach the April high of $3.41.
This bullish scenario is supported by the favorable setup where the EMA lines have the short-term line above the long-term line, indicating strong momentum.

However, if the trend reverses, OP's price could face significant downward pressure, potentially testing the next support levels of $1.82 and $1.53.
If these levels are not maintained, the price could further decline to $1.06, representing a steep 51% correction.


