The price of HBAR has risen 21.43% in the past 7 days and an amazing 172.58% last month. This surge is supported by the bullish trend of the EMA lines, with the short-term line above the long-term line, indicating a sustained upward momentum.
However, the Ichimoku Cloud and DMI charts highlight potential signs of a trend reversal, so caution is warranted. If the bearish momentum dominates, HBAR may test the crucial support level of $0.117 and could even drop to a minimum of $0.053.
HBAR Currently Bullish, Still Strong
The HBAR DMI chart shows an ADX value of 52, indicating a strong market trend. ADX, or the Average Directional Index, measures the strength of a trend, with values above 25 indicating a significant trend and above 40 indicating a very strong trend.
An ADX of 52 suggests that the current trend, whether upward or downward, is firmly in place and is unlikely to weaken soon. Notably, this value has been maintained above 40 since November 14th, demonstrating sustained market momentum.

Currently, HBAR's D+ is 27.2 and D- is 14.4, reflecting the upward trend. However, the decrease in D+ and the sharp increase in D- indicate a weakening of the bullish trend. This difference suggests that selling pressure is increasing, and if it continues, it could threaten the dominance of the bullish sentiment.
While the current trend is strong, the interaction between D+ and D- highlights an important stage for Hedera. If the bearish momentum strengthens further, the market sentiment could shift.
Ichimoku Cloud, Caution Needed
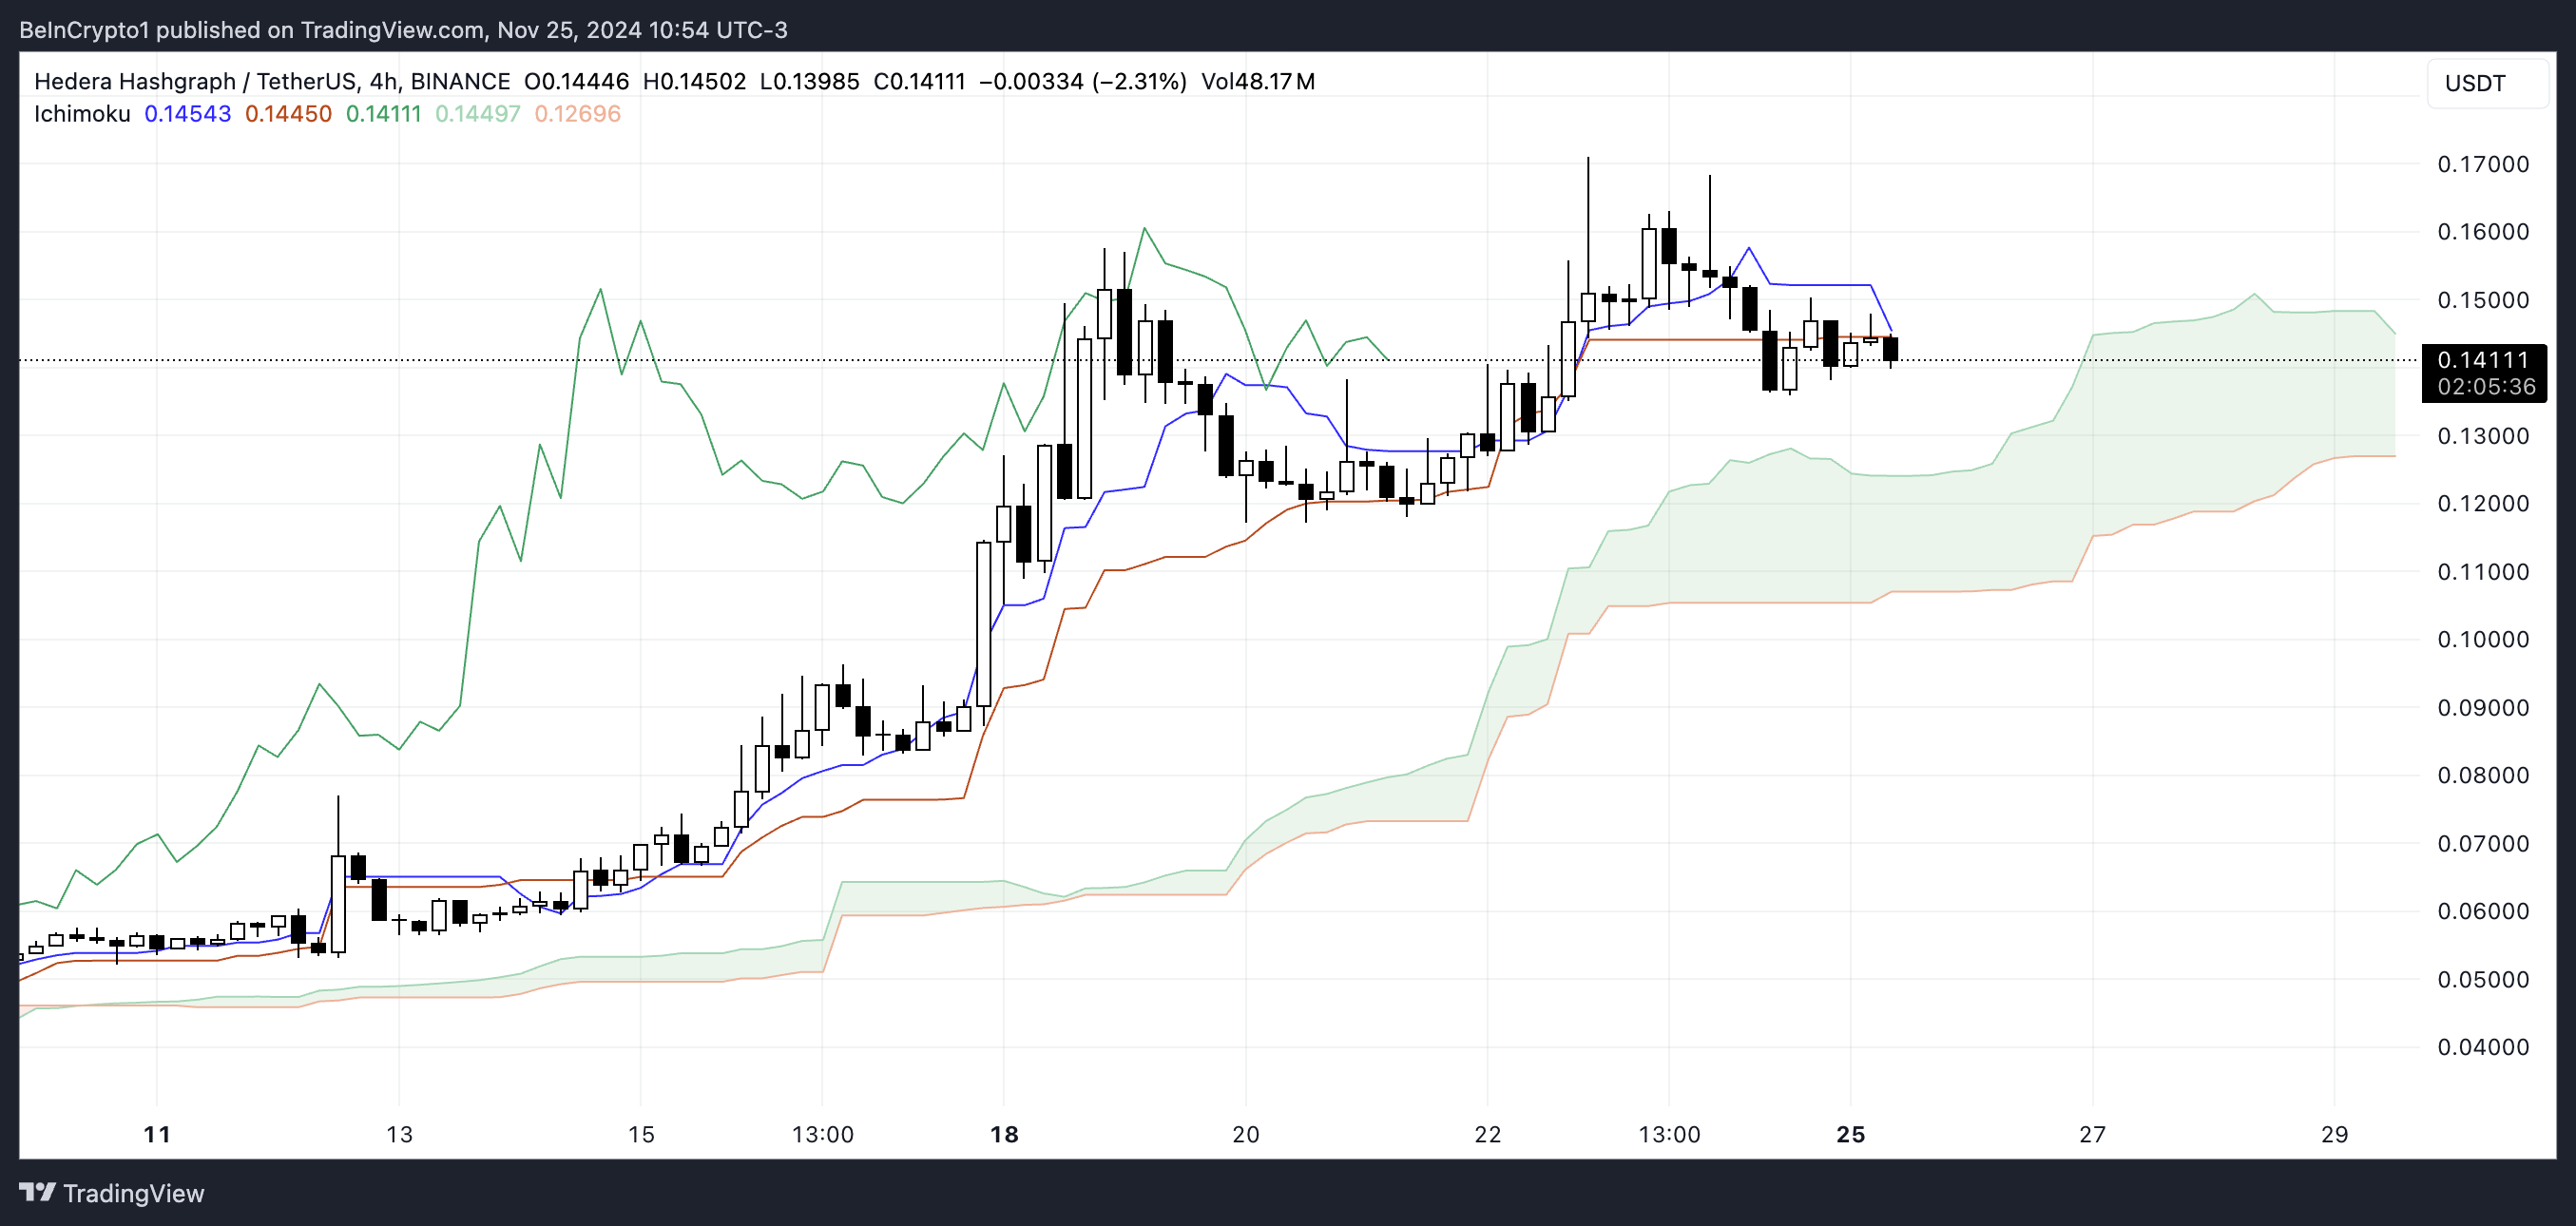
According to the Ichimoku Cloud chart for HBAR, the price is trading near the Kijun-Sen (orange line) and Tenkan-Sen (blue line), indicating a consolidation phase. The flat nature of the Kijun-Sen suggests a lack of strong directional momentum, and the cloud (Senkou Span A and B) below the price acts as a support area.
The green cloud reflects medium-term bullish sentiment, but the difficulty of the price to remain above the Kijun-Sen emphasizes the uncertainty.

If the HBAR price maintains support above the cloud, it may attempt a bullish reversal. The next resistance will likely be near the Tenkan-Sen and recent highs.
However, a breakdown below the cloud could signal bearish momentum and potentially target lower levels. The thinning of the cloud towards the end of the chart suggests a weakening of support, which is an important stage for the HBAR trend direction.
HBAR Price Prediction: 62% Correction After Recent Surge?
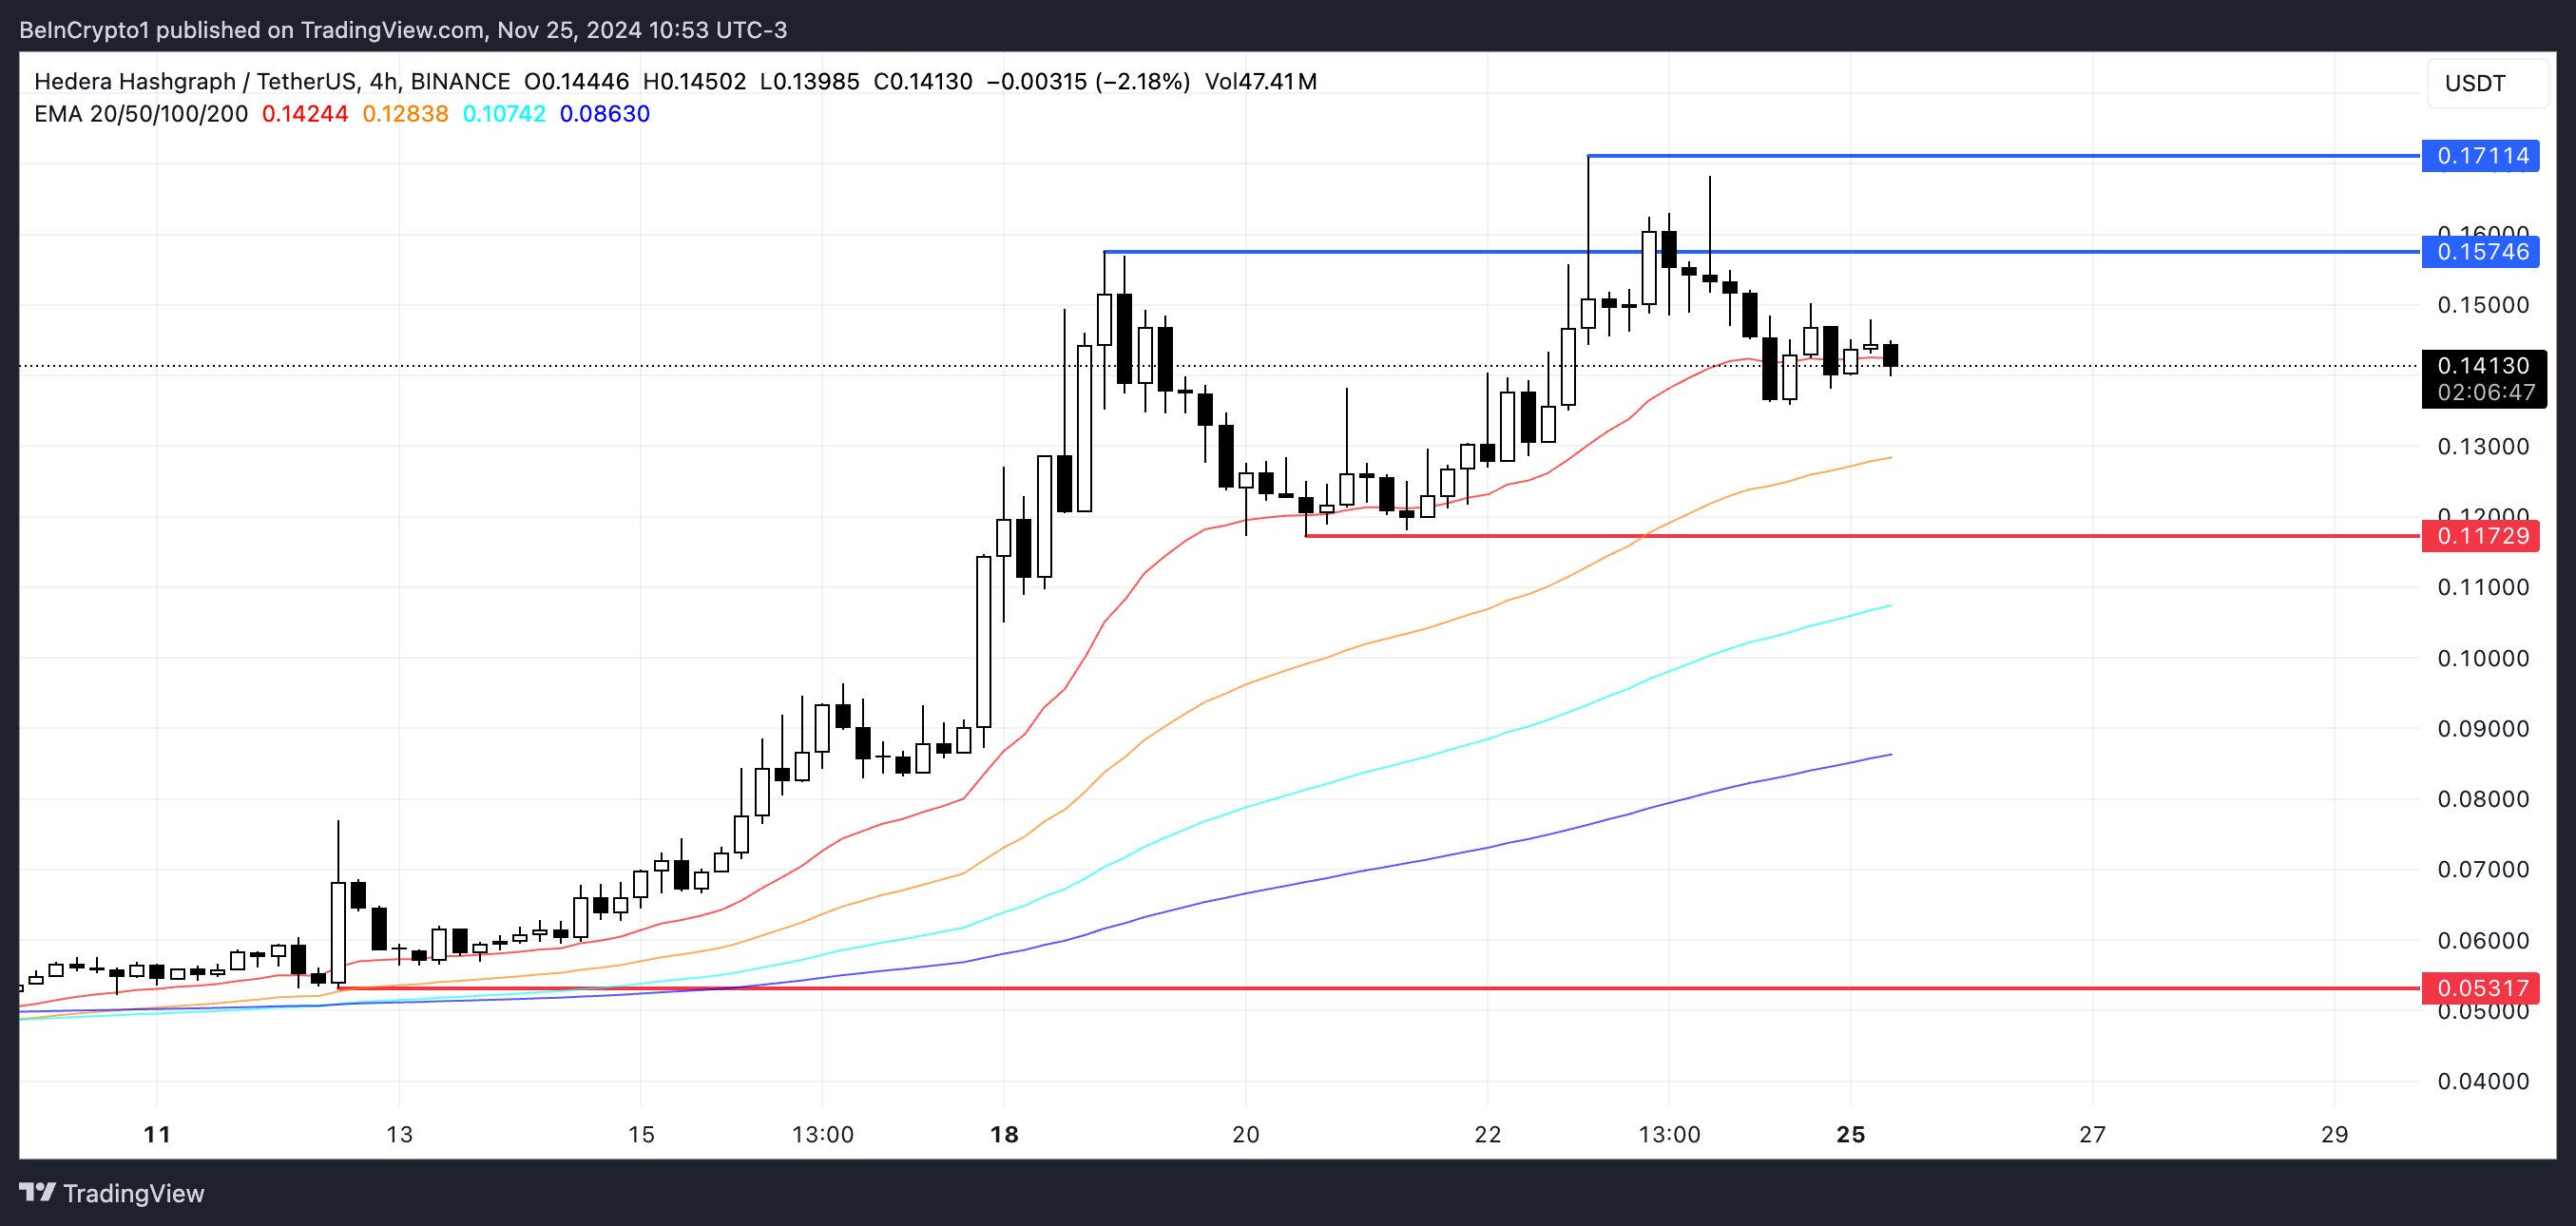
The HBAR EMA lines show a bullish trend, with the short-term line above the long-term line, indicating strong upward momentum.
The token has surged 21.43% in the past 7 days. If the uptrend continues, it may challenge the resistance levels of $0.157 and $0.1711. This bullish sentiment reflects sustained buying pressure, keeping the price on an upward trajectory.

However, indicators such as the Ichimoku Cloud and DMI suggest the potential for a trend reversal. If the trend shifts to bearish, the HBAR price is likely to test the $0.117 support, which is a crucial level for maintaining momentum.
If this support fails, the price could plummet to $0.053, recording a significant 62% correction.


