Solana's social indicators reveal a worrying trend as altcoins fail to maintain a 40% price surge. On November 5, SOL was trading at $161.93, and 17 days later it reached a new all-time high.
However, despite this rally igniting new enthusiasm among holders, the lack of sustained momentum indicates that the bullish sentiment is weakening. Alongside this decline, what lies ahead for the price of SOL?
Solana (SOL), Shifting to Bearish Market Sentiment
Solana's weakened bullish sentiment has impacted its market capitalization ranking. Two days ago, SOL was the fourth most valuable cryptocurrency by market cap. However, it has since ceded that position to Ripple (XRP), which is outperforming other top 100 assets.
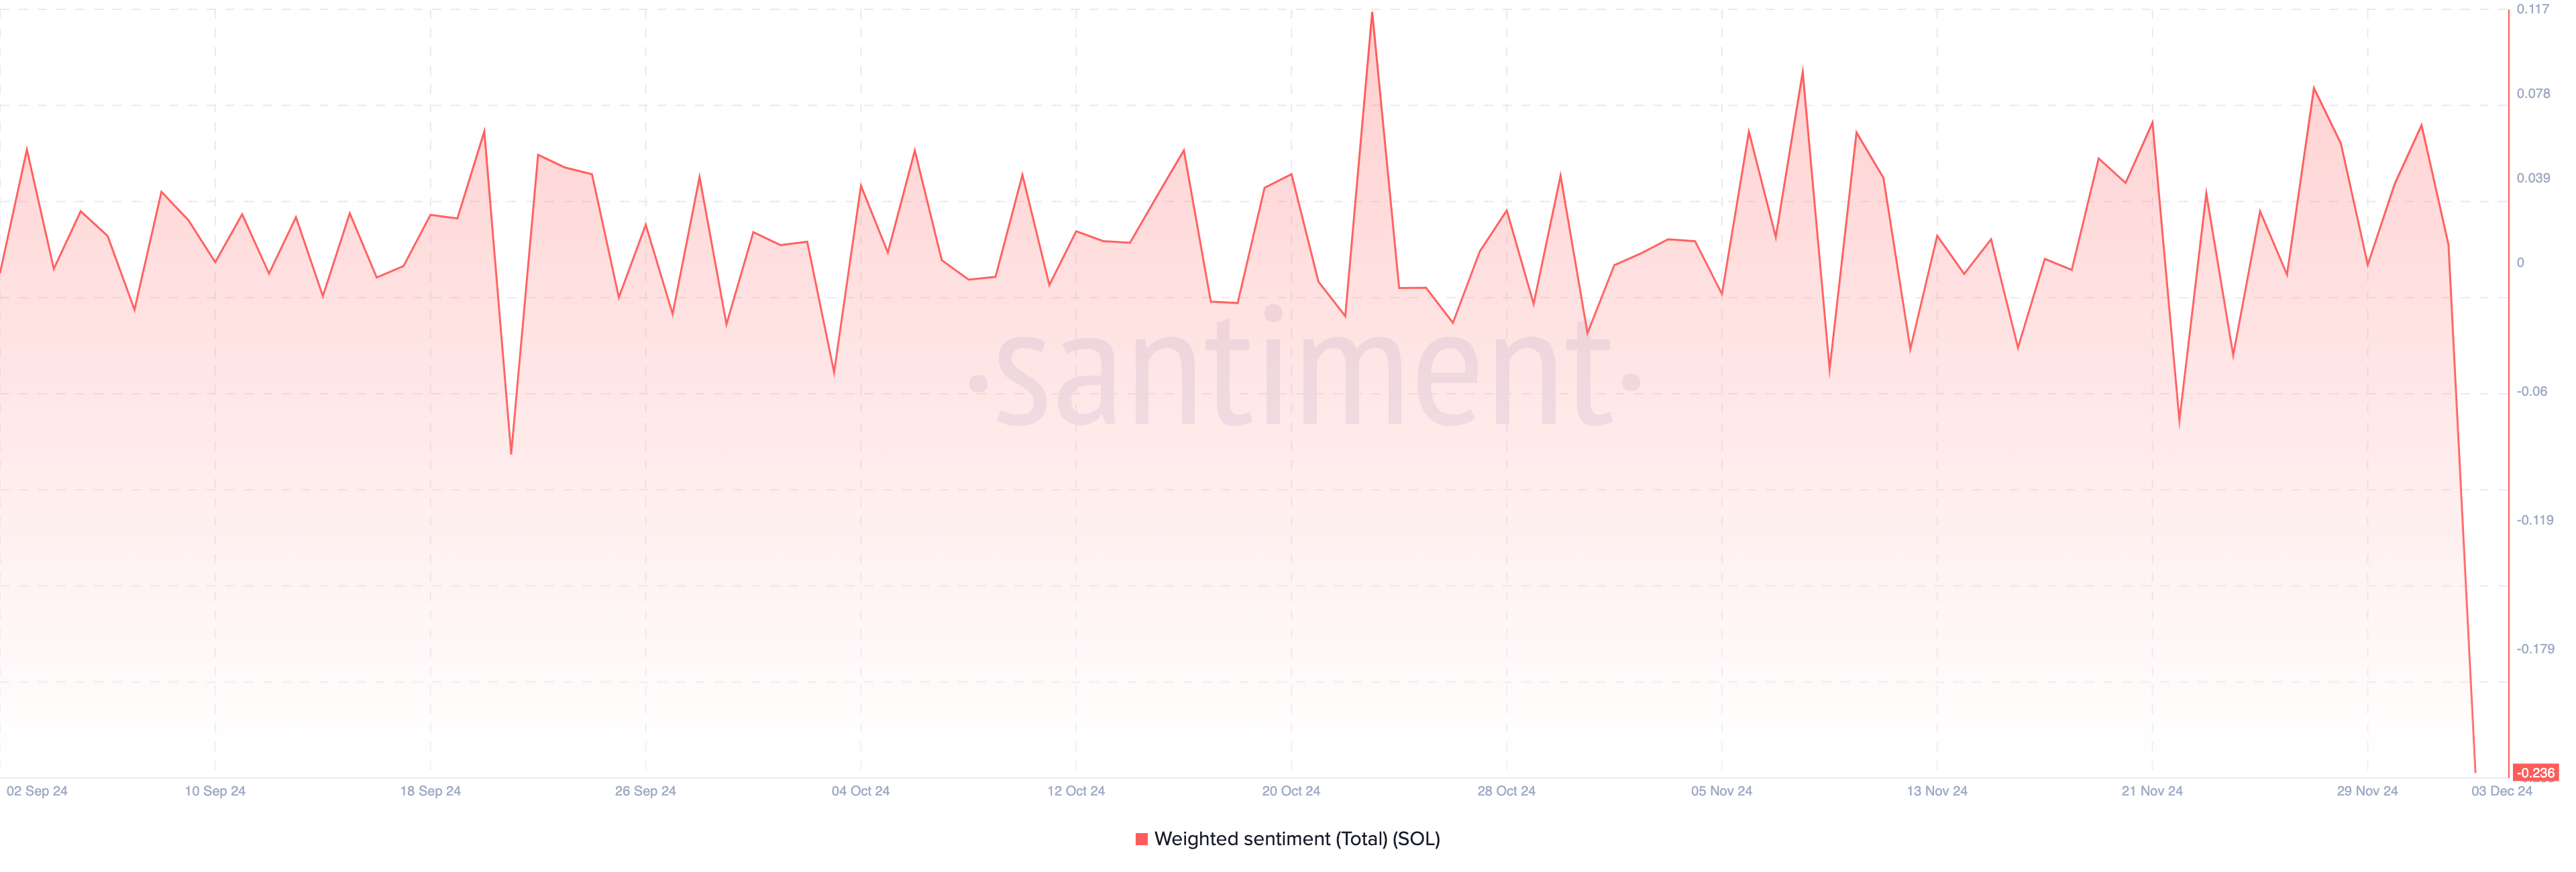
Following these developments, Solana's social indicators, particularly the weighted sentiment, have declined. Weighted sentiment measures the overall market perception of a cryptocurrency.
When positive, it means most discussions about altcoins are bullish. Conversely, when negative, it indicates most discussions about cryptocurrencies are bearish. According to the cryptocurrency online data platform Santiment, Solana's weighted sentiment has plummeted into negative territory, suggesting that most market participants are not bullish on the short-term price movement of SOL.

If this trend continues in the coming days, demand for cryptocurrencies may continue to decline. The social dominance is another indicator suggesting that the price of SOL could further decline.
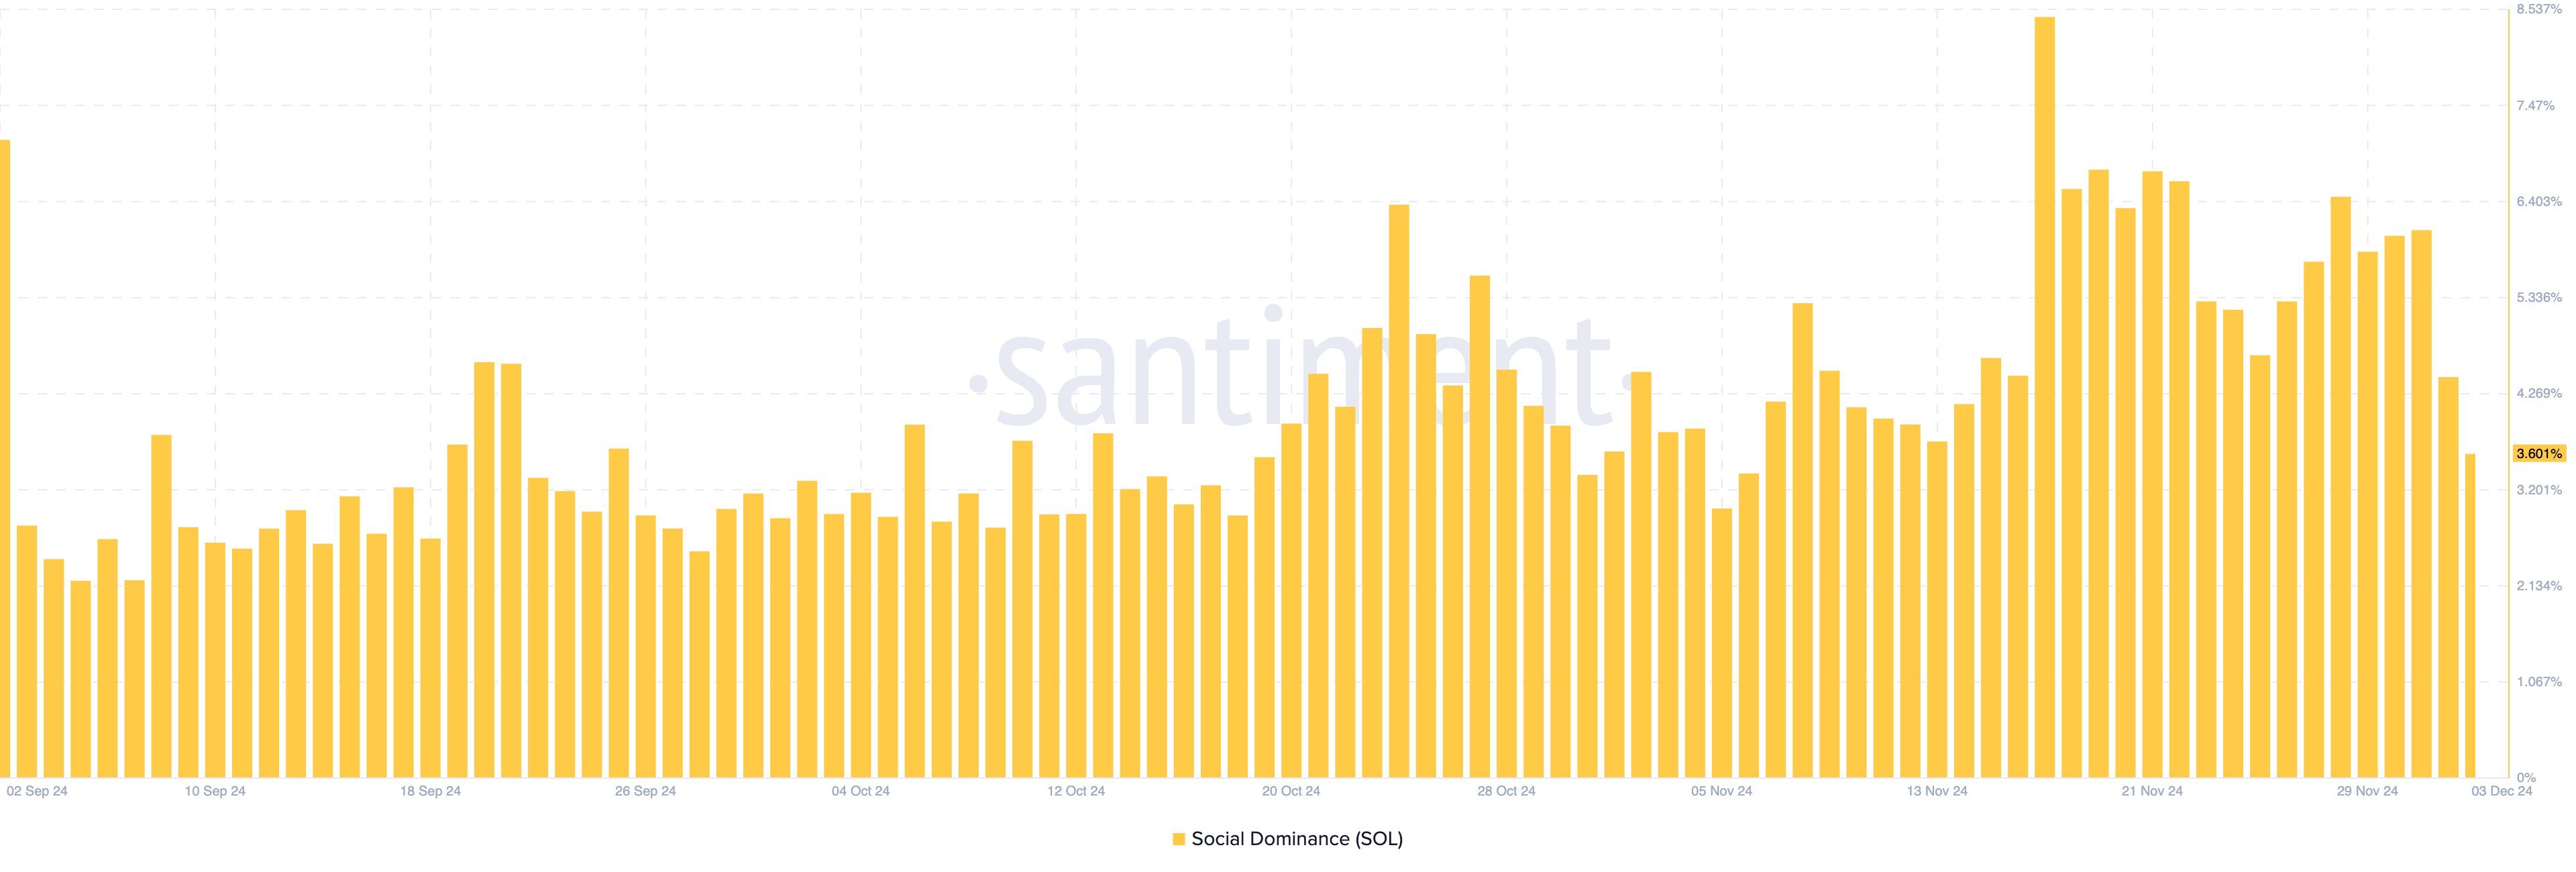
Social dominance measures the level of discussion about a cryptocurrency compared to other assets in the market. When this metric rises, it means the asset is being discussed more, which is generally a bullish sign.
However, in the case of SOL, this indicator has decreased from 8.42% on November 17 to 3.60% today. Considering this decline in the metric, Solana's price may struggle to reach new all-time highs in the short term.

SOL Price Prediction: Rebound Unlikely in the Near Term
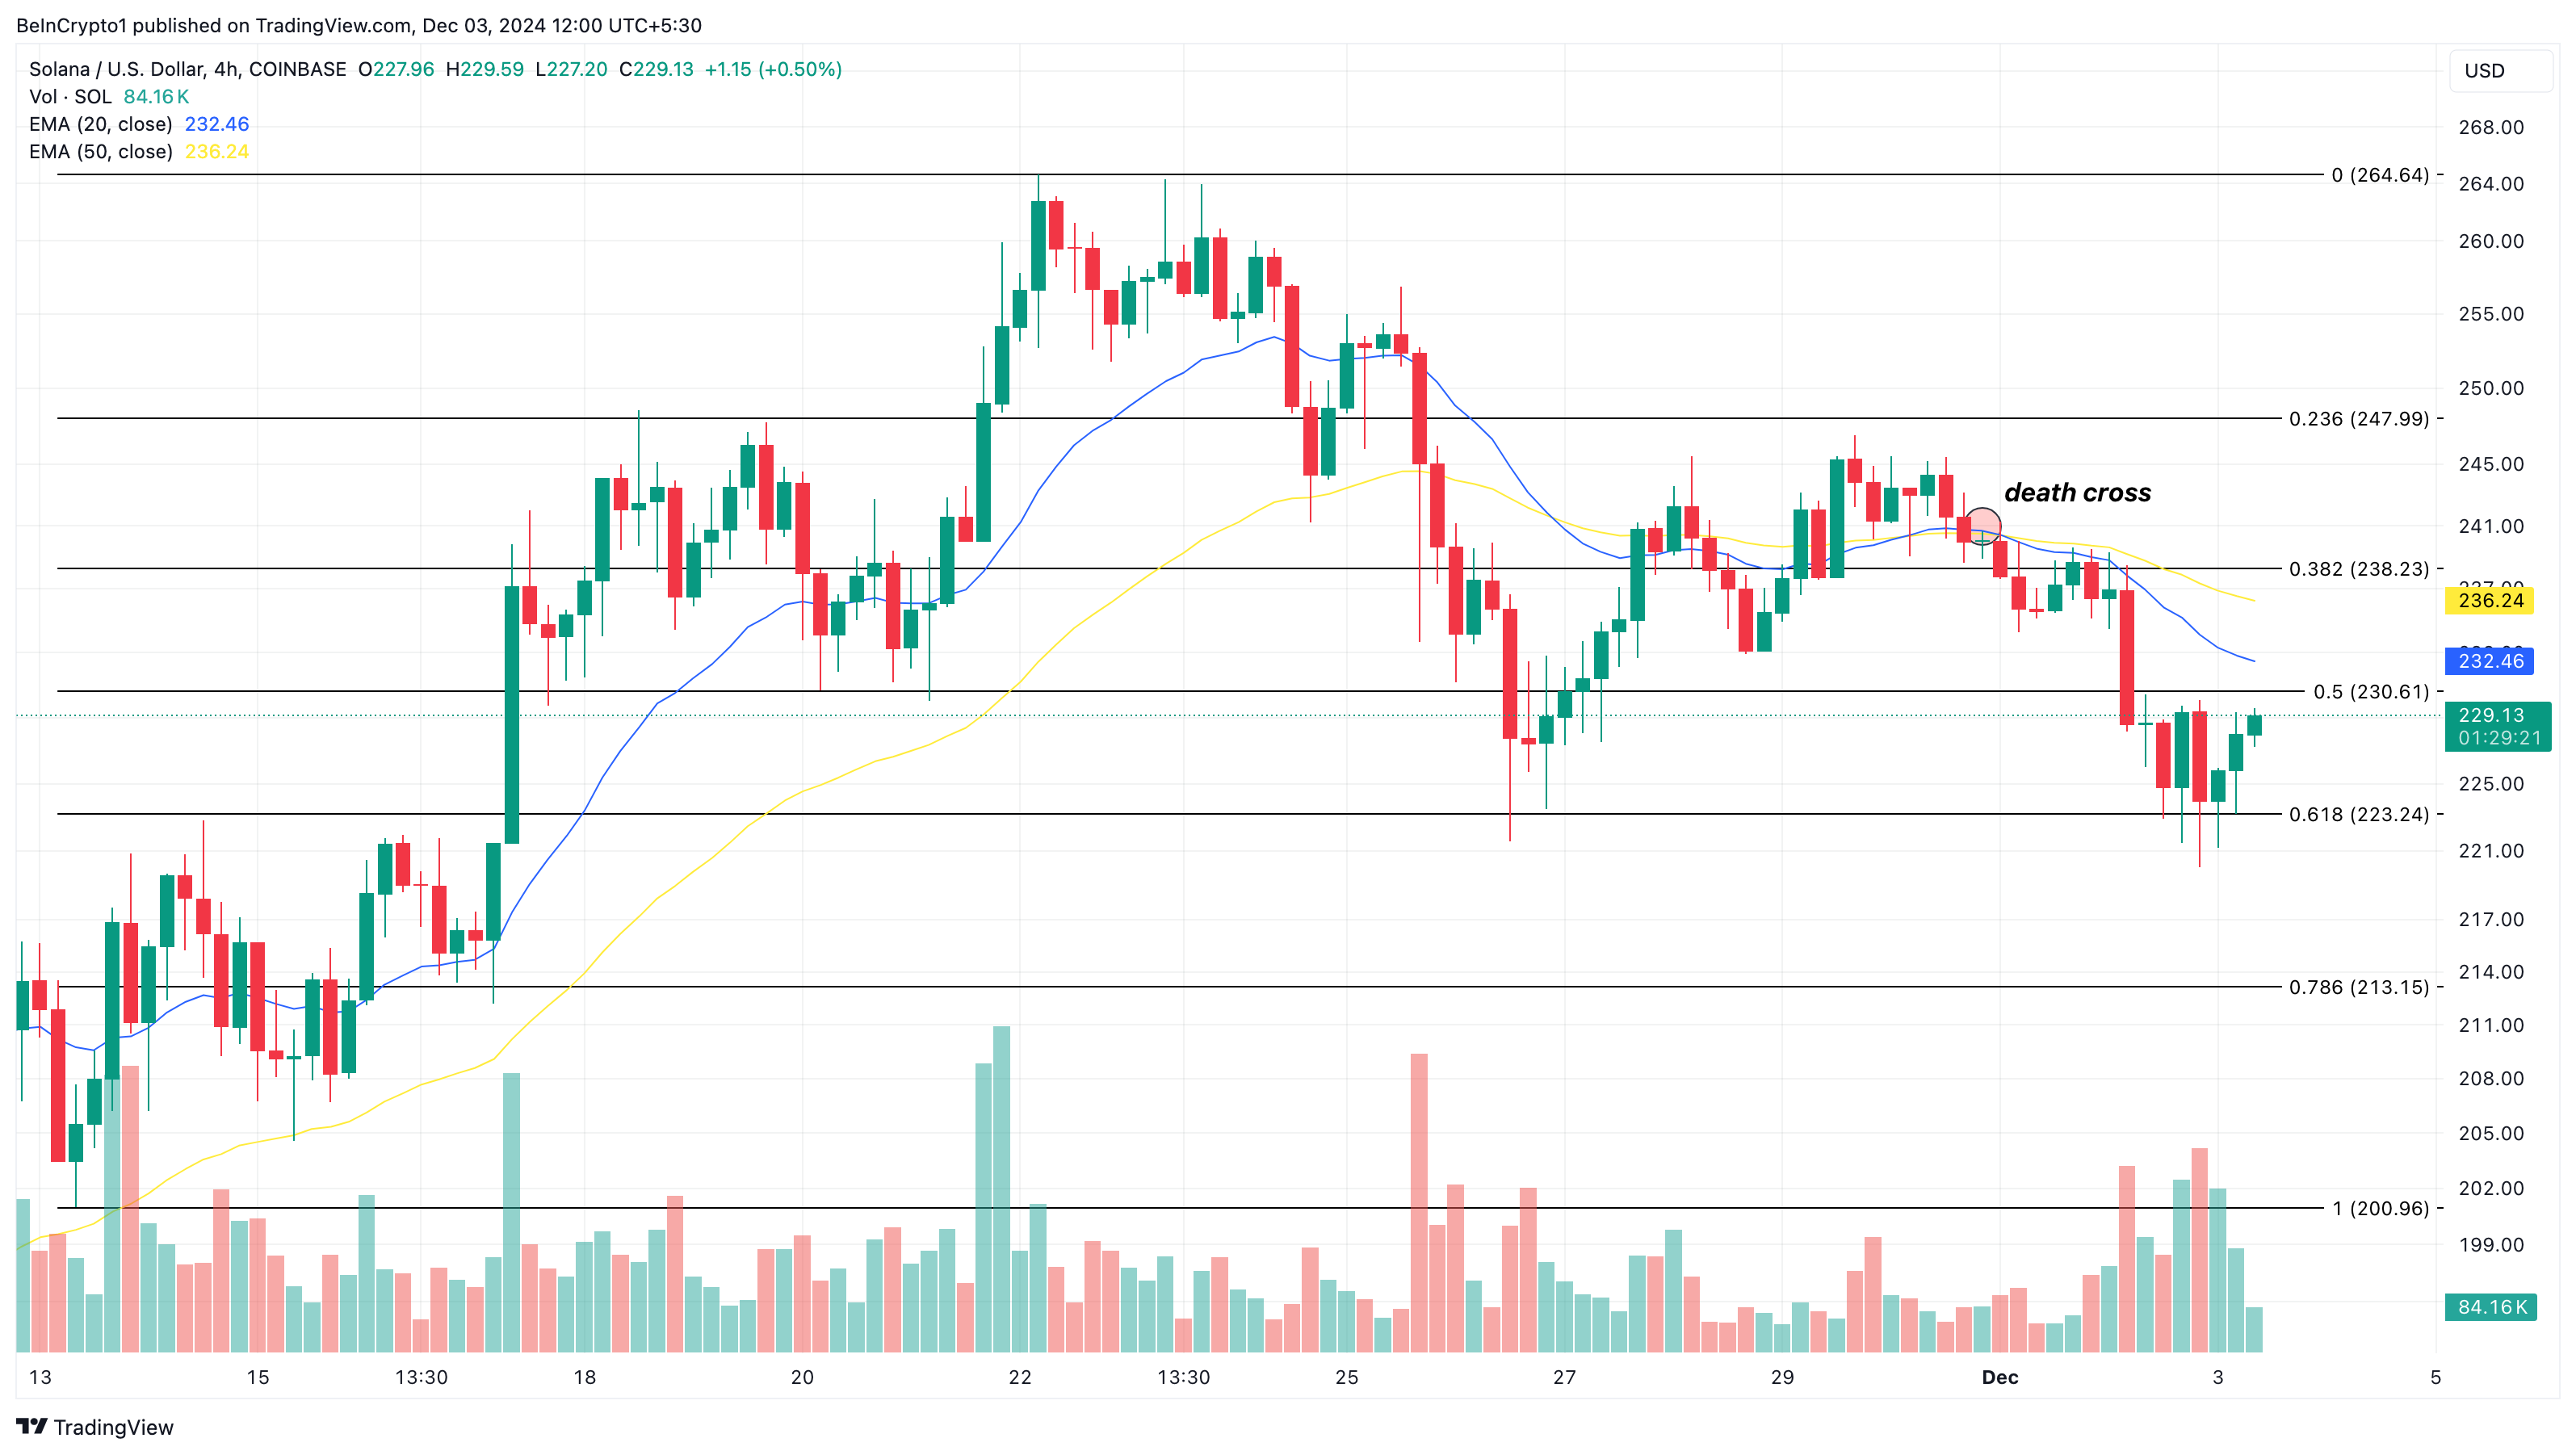
From a technical perspective, the 50-period Exponential Moving Average (EMA) on the 4-hour chart has crossed below the 20 EMA. EMAs are technical indicators used to identify bullish and bearish trends.
When a shorter EMA crosses above a longer EMA, the trend is considered bullish. Conversely, when a longer EMA crosses above a shorter EMA, the trend is bearish. This crossover is referred to as a "death cross" and indicates a bearish trend.
Furthermore, the price of SOL is trading below these two key indicators, supporting this bearish outlook. This position suggests that the recent rebound may be a false one. If confirmed, Solana's value could potentially decline to $213.15.

However, if Solana's social indicators turn bullish, this trend could reverse. In that case, SOL could rebound and target $264.64.


