The price of HBAR has surged to its highest level since 2021, showing remarkable momentum in the cryptocurrency market. This coin has soared 721% in the past 30 days, outperforming most major cryptocurrencies.
The current market capitalization is $13.44 billion, and HBAR has surpassed notable projects such as SUI, Uniswap, and Litecoin. Technical indicators across multiple timeframes suggest strong bullish momentum, but some indicators also imply the potential for a correction.
HBAR's Current Uptrend Remains Strong
HBAR's Directional Movement Index (DMI) shows a very strong trend with an Average Directional Index (ADX) of 72.
ADX measures the strength of a trend regardless of direction, with values above 25 indicating a strong trend and above 50 indicating a very strong trend. At 72, HBAR's ADX indicates HBAR has very powerful trend momentum in the market.

Despite the positive directional indicator (D+) dropping from 55 to 42.6, the combination with the very low negative directional indicator (D-) of 1.2 confirms the strong bullish momentum in HBAR's price.
The large difference between D+ and D- supports the continuation of the uptrend, but the decline in D+ suggests a weakening of buying pressure. However, as long as D+ remains significantly higher than D-, the uptrend structure is maintained.
Ichimoku Cloud Clearly Bullish, but Overbought Concerns
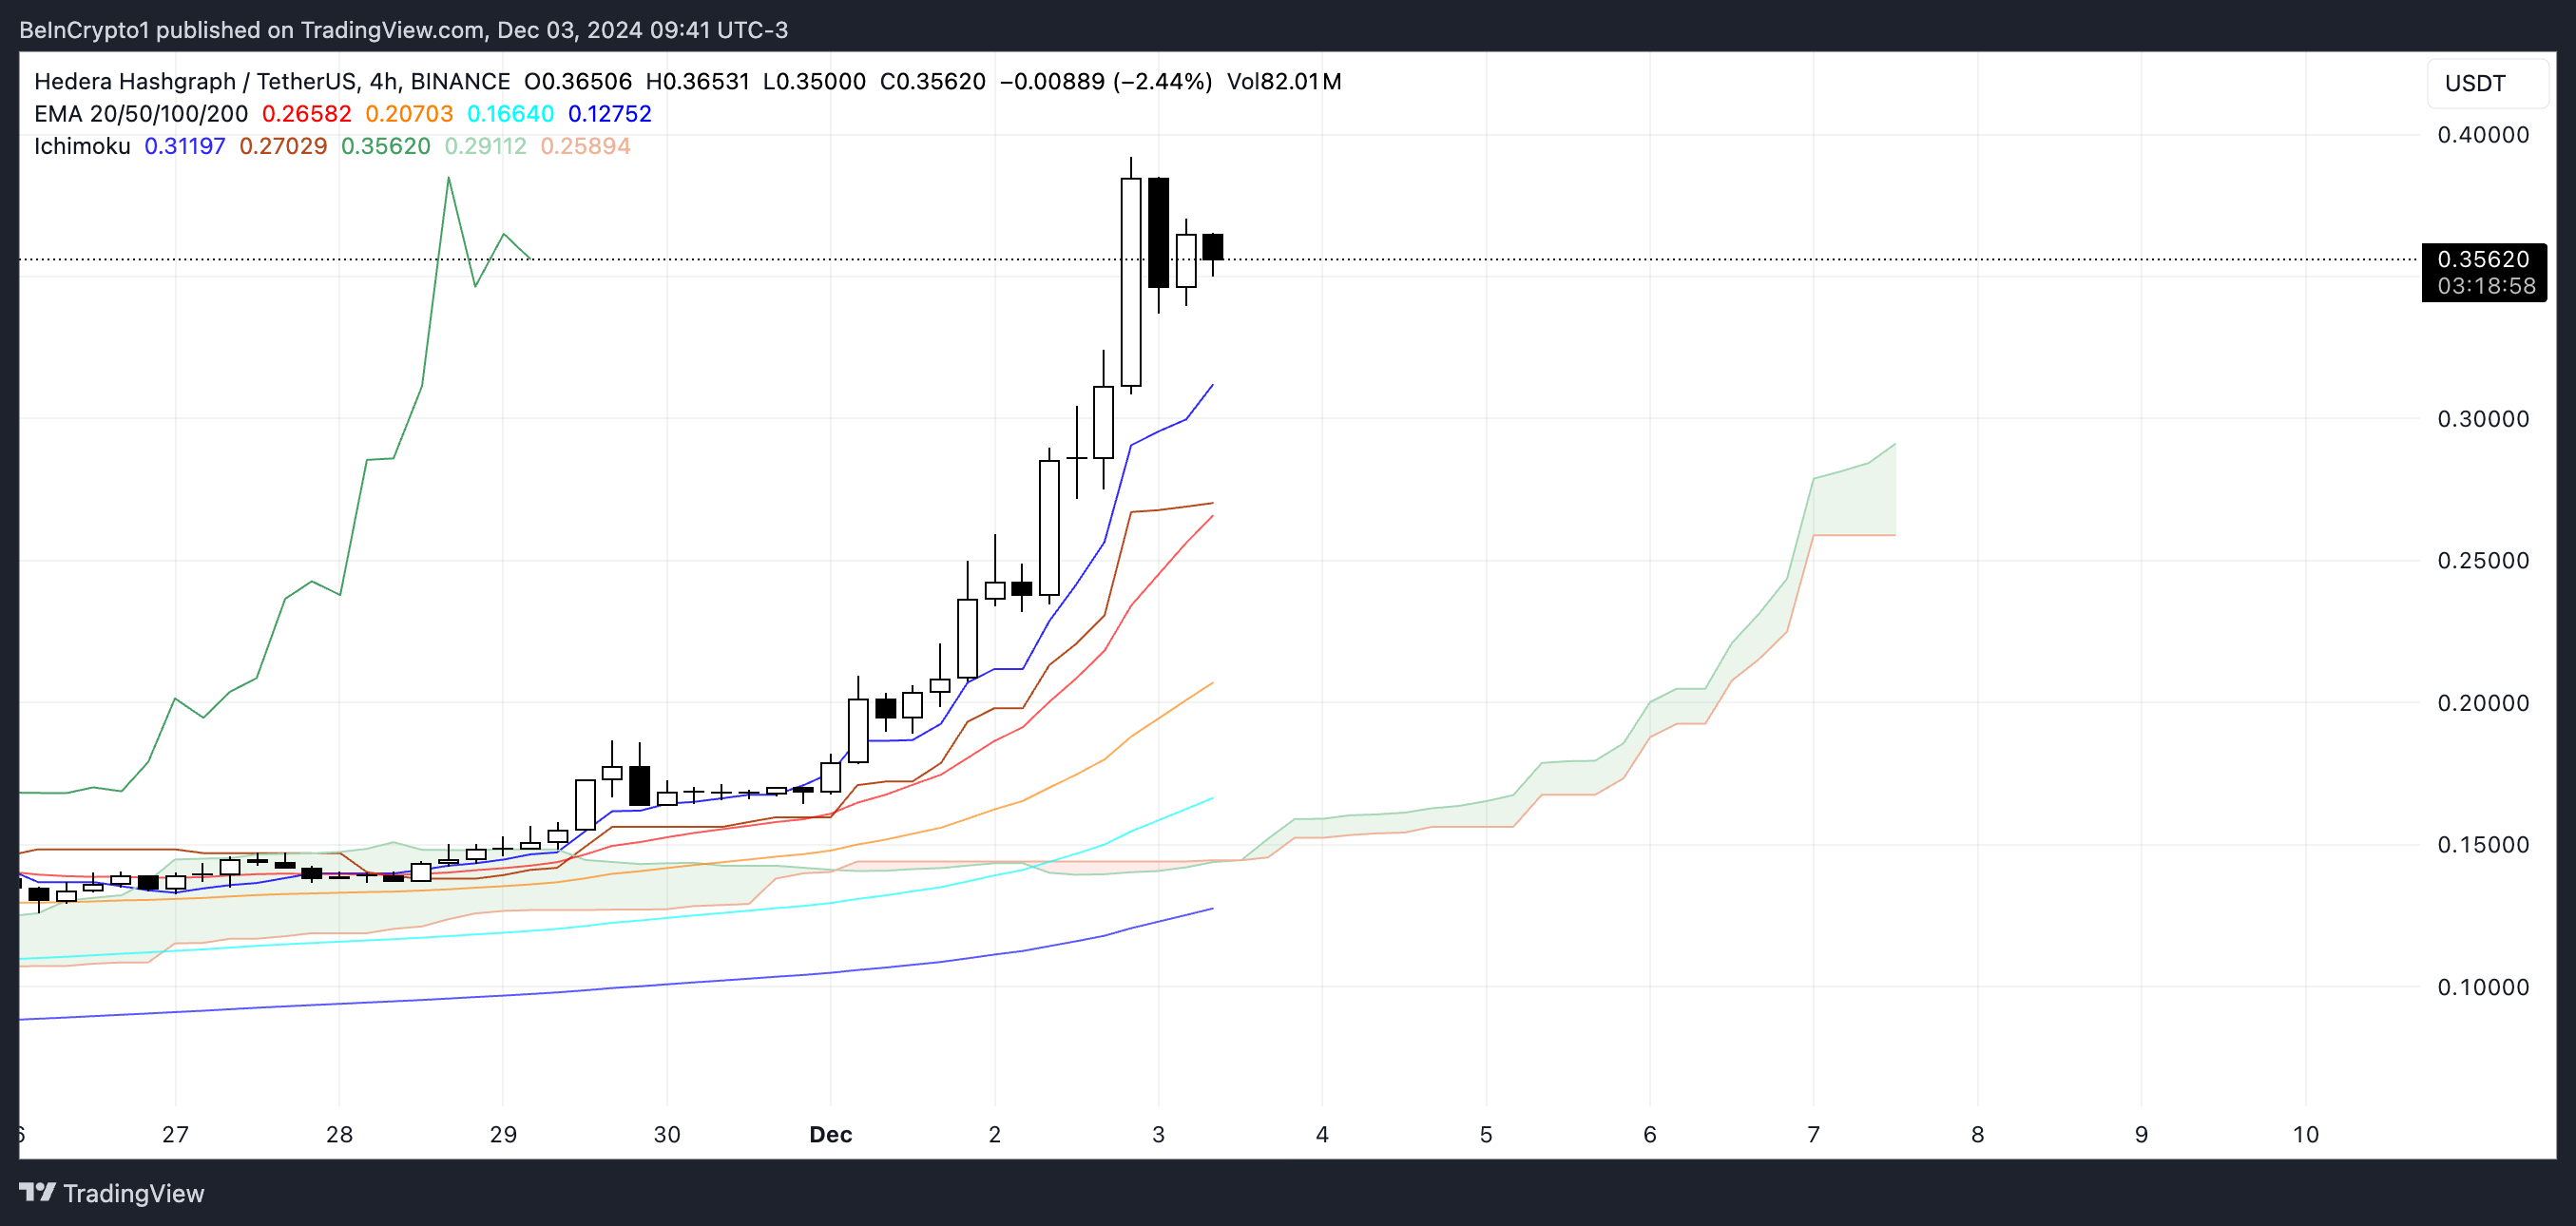
Hedera's Ichimoku Cloud chart shows strong bullish momentum, with the price trading above both the base line (Senkou Span A) and the conversion line (Tenkan-sen).
The wide gap between these lines indicates an acceleration of the bullish momentum, but the price may have extended too far above the base line.

The cloud (Kumo) structure is bullish, and the future cloud formation suggests continued upside support.
However, the significant distance between the current Hedera price and the cloud implies the price may have become too extended in the short term, and a correction phase could see the price retest the base line or the top of the cloud as support levels.
HBAR Price Prediction: Retracing to $0.27?
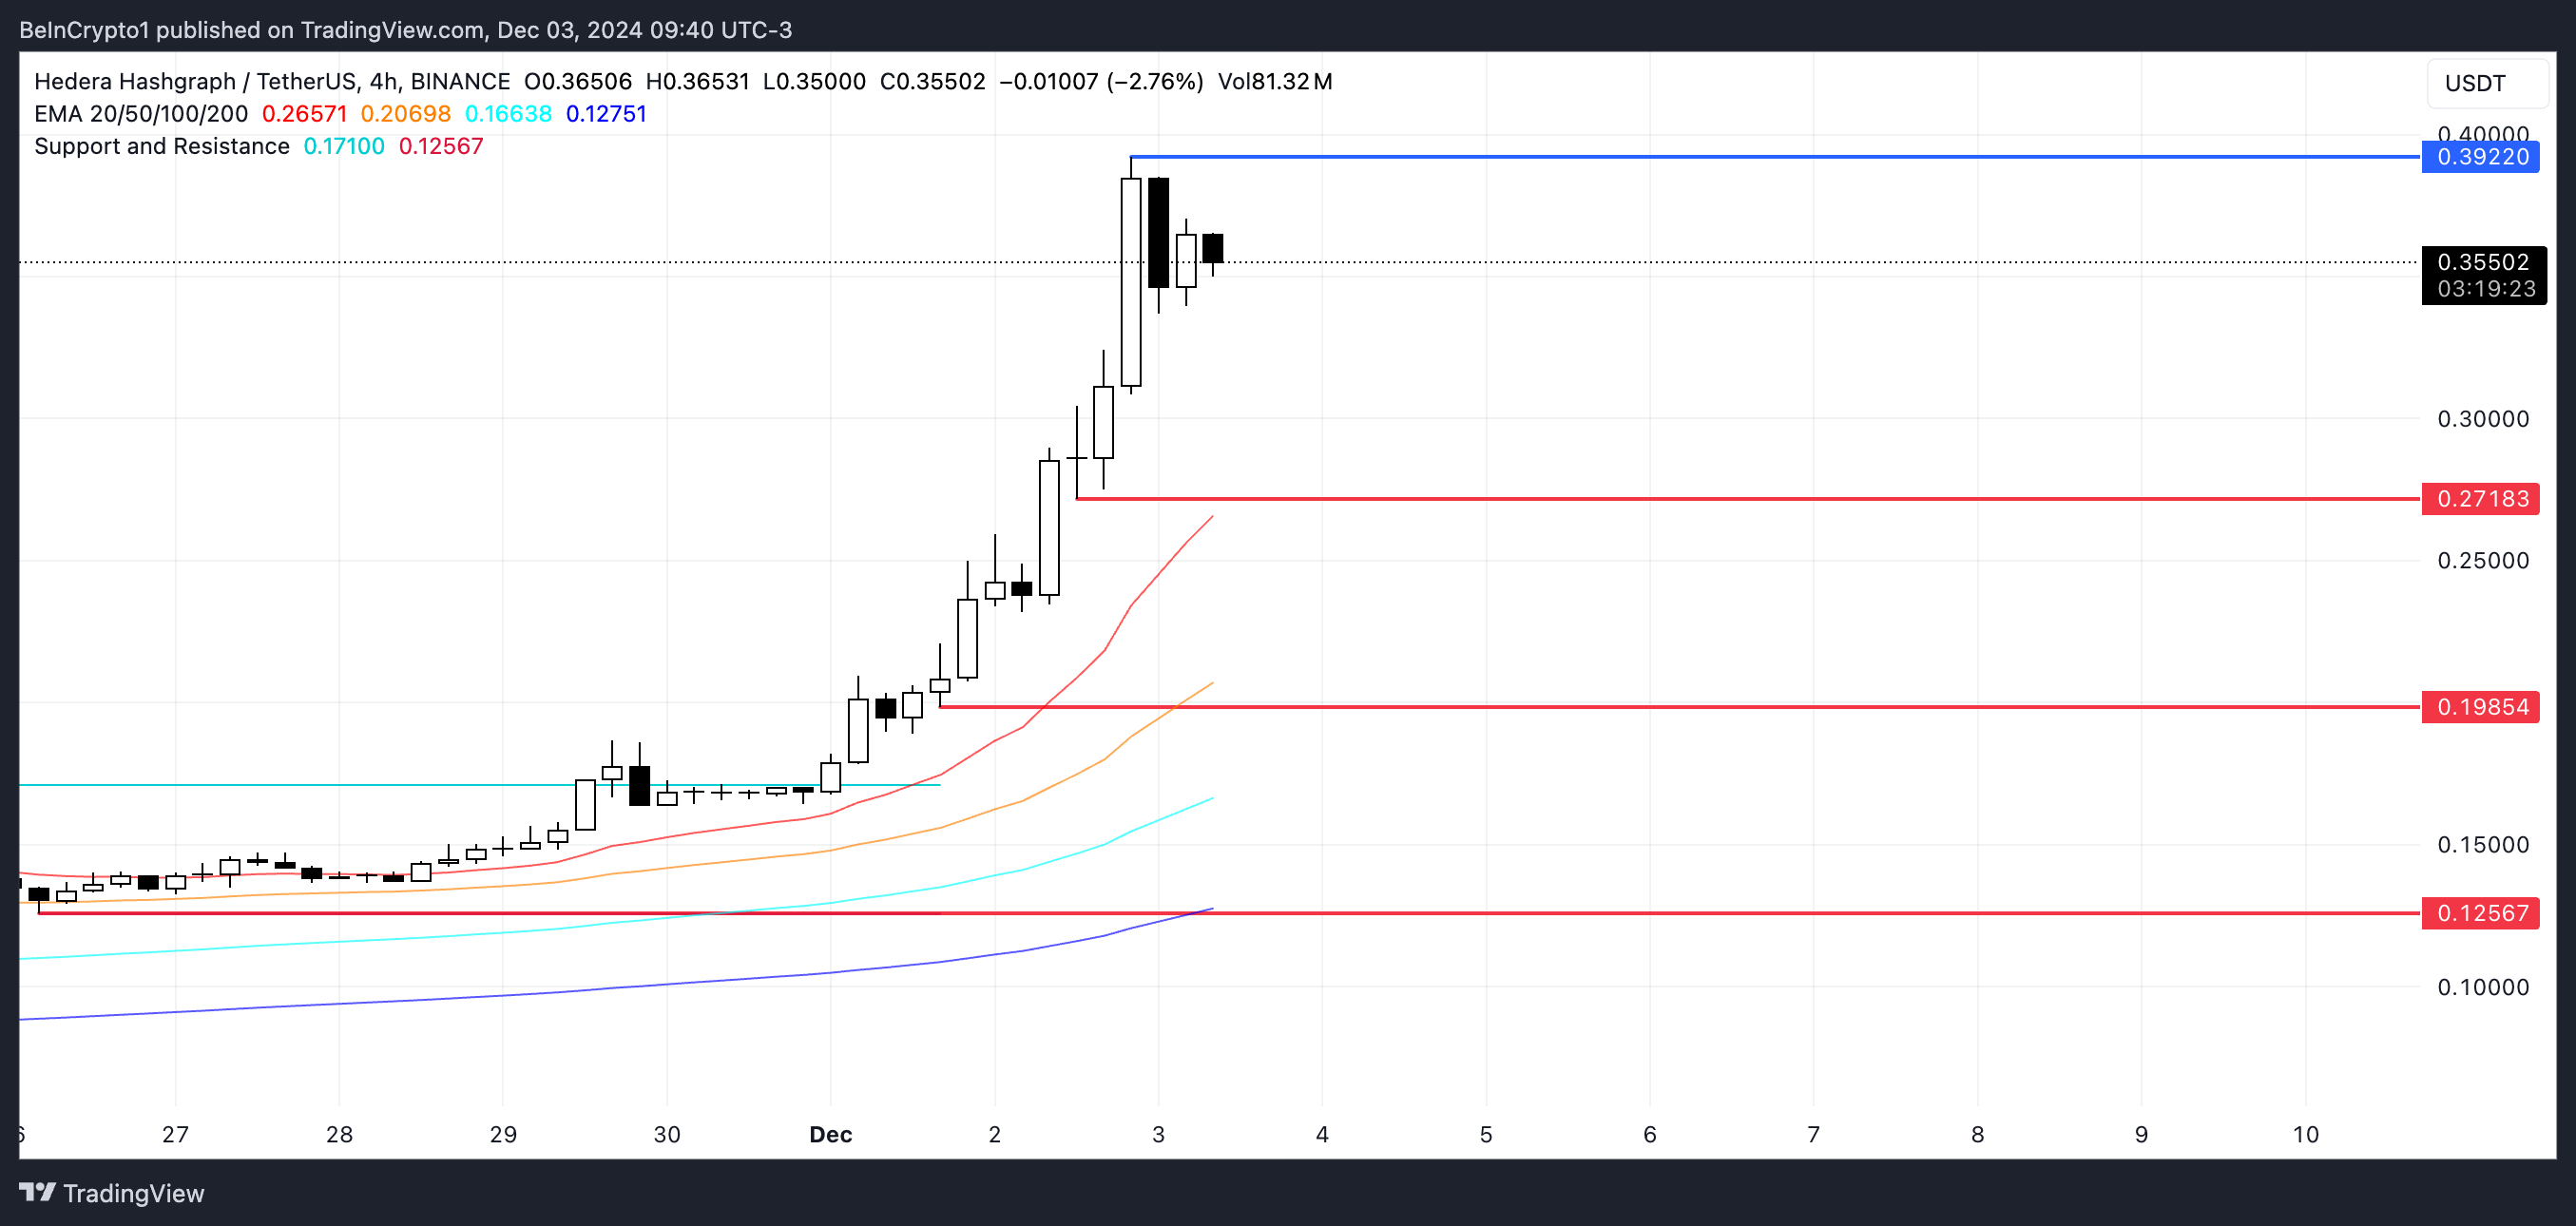
Hedera's price movement has shown exceptional bullish momentum, surging 721% in the past 30 days to reach levels not seen since 2021. The EMAs (Exponential Moving Averages) are in perfect bullish alignment, with the shorter timeframes positioned above the longer ones, suggesting continued upward momentum.
If the $0.39 resistance level is breached, it could trigger further upside to the psychological levels of $0.45 and $0.50, representing a potential 42% upside.

However, the extended rally has pushed the price significantly above the key EMAs and the Ichimoku Cloud, indicating HBAR's price may have become overbought.
The support levels at $0.27 and $0.19 could provide bounce points during a corrective move, and $0.12 could play a crucial support role if selling pressure intensifies.


