The price of Bitcoin (BTC) has reached a historic milestone, surpassing $100,000 for the first time, and achieving a market capitalization of $2 trillion. This makes BTC more valuable than Saudi Aramco and positions it close to the market cap of the tech giants.
The EMA lines are showing strong bullish momentum, and the key indicators suggest room for further growth, indicating that the current BTC uptrend is likely to continue.
Bitcoin's Current Trend Could Strengthen Further
The Bitcoin DMI chart shows that the ADX has risen from 15 to 24.4 in a single day, signaling a strong trend. This increase suggests that BTC is transitioning from a weak market state to a more defined trend.
Combined with the bullish signals from other indicators, the rising ADX reflects the accumulation of momentum that could drive further price movements.

The ADX (Average Directional Index) measures the strength of a trend, with values above 25 indicating a strong trend and below 25 indicating a weak or corrective market. BTC's current ADX is 24.4, with D+ at 31.2 and D- at 9.8, suggesting that buyers are maintaining substantial control.
While the trend strength has not yet reached the levels seen during the $90,000 rally, where the ADX exceeded 40, the current upward trajectory suggests that if the momentum continues to build, the potential for further price appreciation remains.
Bitcoin NUPL Indicates Room for Growth
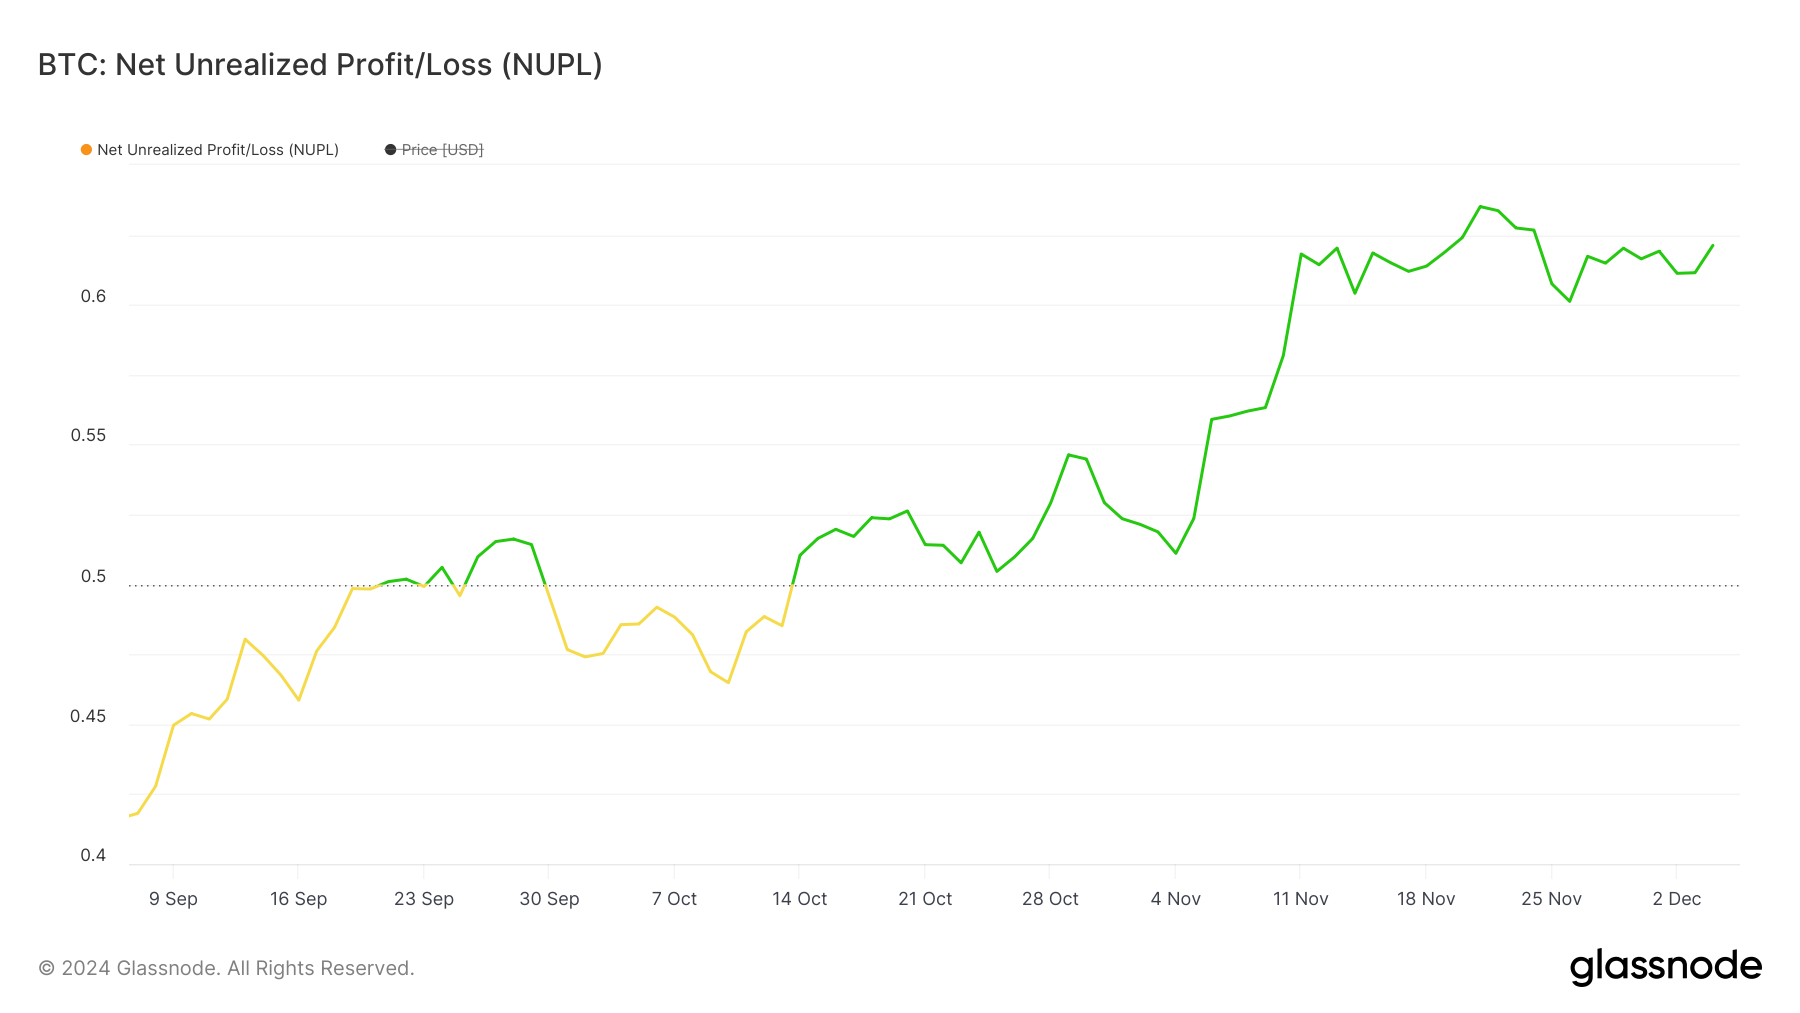
The Bitcoin NUPL chart shows that the current NUPL is 0.62, slightly down from 0.63 a few days ago. NUPL (Net Unrealized Profit/Loss) measures the ratio of market participants in profit versus loss, providing insight into market sentiment.
Values between 0.5 and 0.7 are classified as the "belief-disbelief" phase, where optimism is growing but has not yet reached its peak.

Despite BTC's impressive 49.65% rise over the past 30 days, the NUPL at 0.62 indicates that the market has not yet entered the "euphoria" zone, which is typically reached when NUPL hits 0.7.
This suggests that sentiment is bullish, but Bitcoin prices have not yet become excessively stretched. Historically, reaching the euphoria stage has coincided with significant price corrections, and BTC appears to have room for additional growth before reaching that level.
BTC Price Prediction: $110,000 by December?
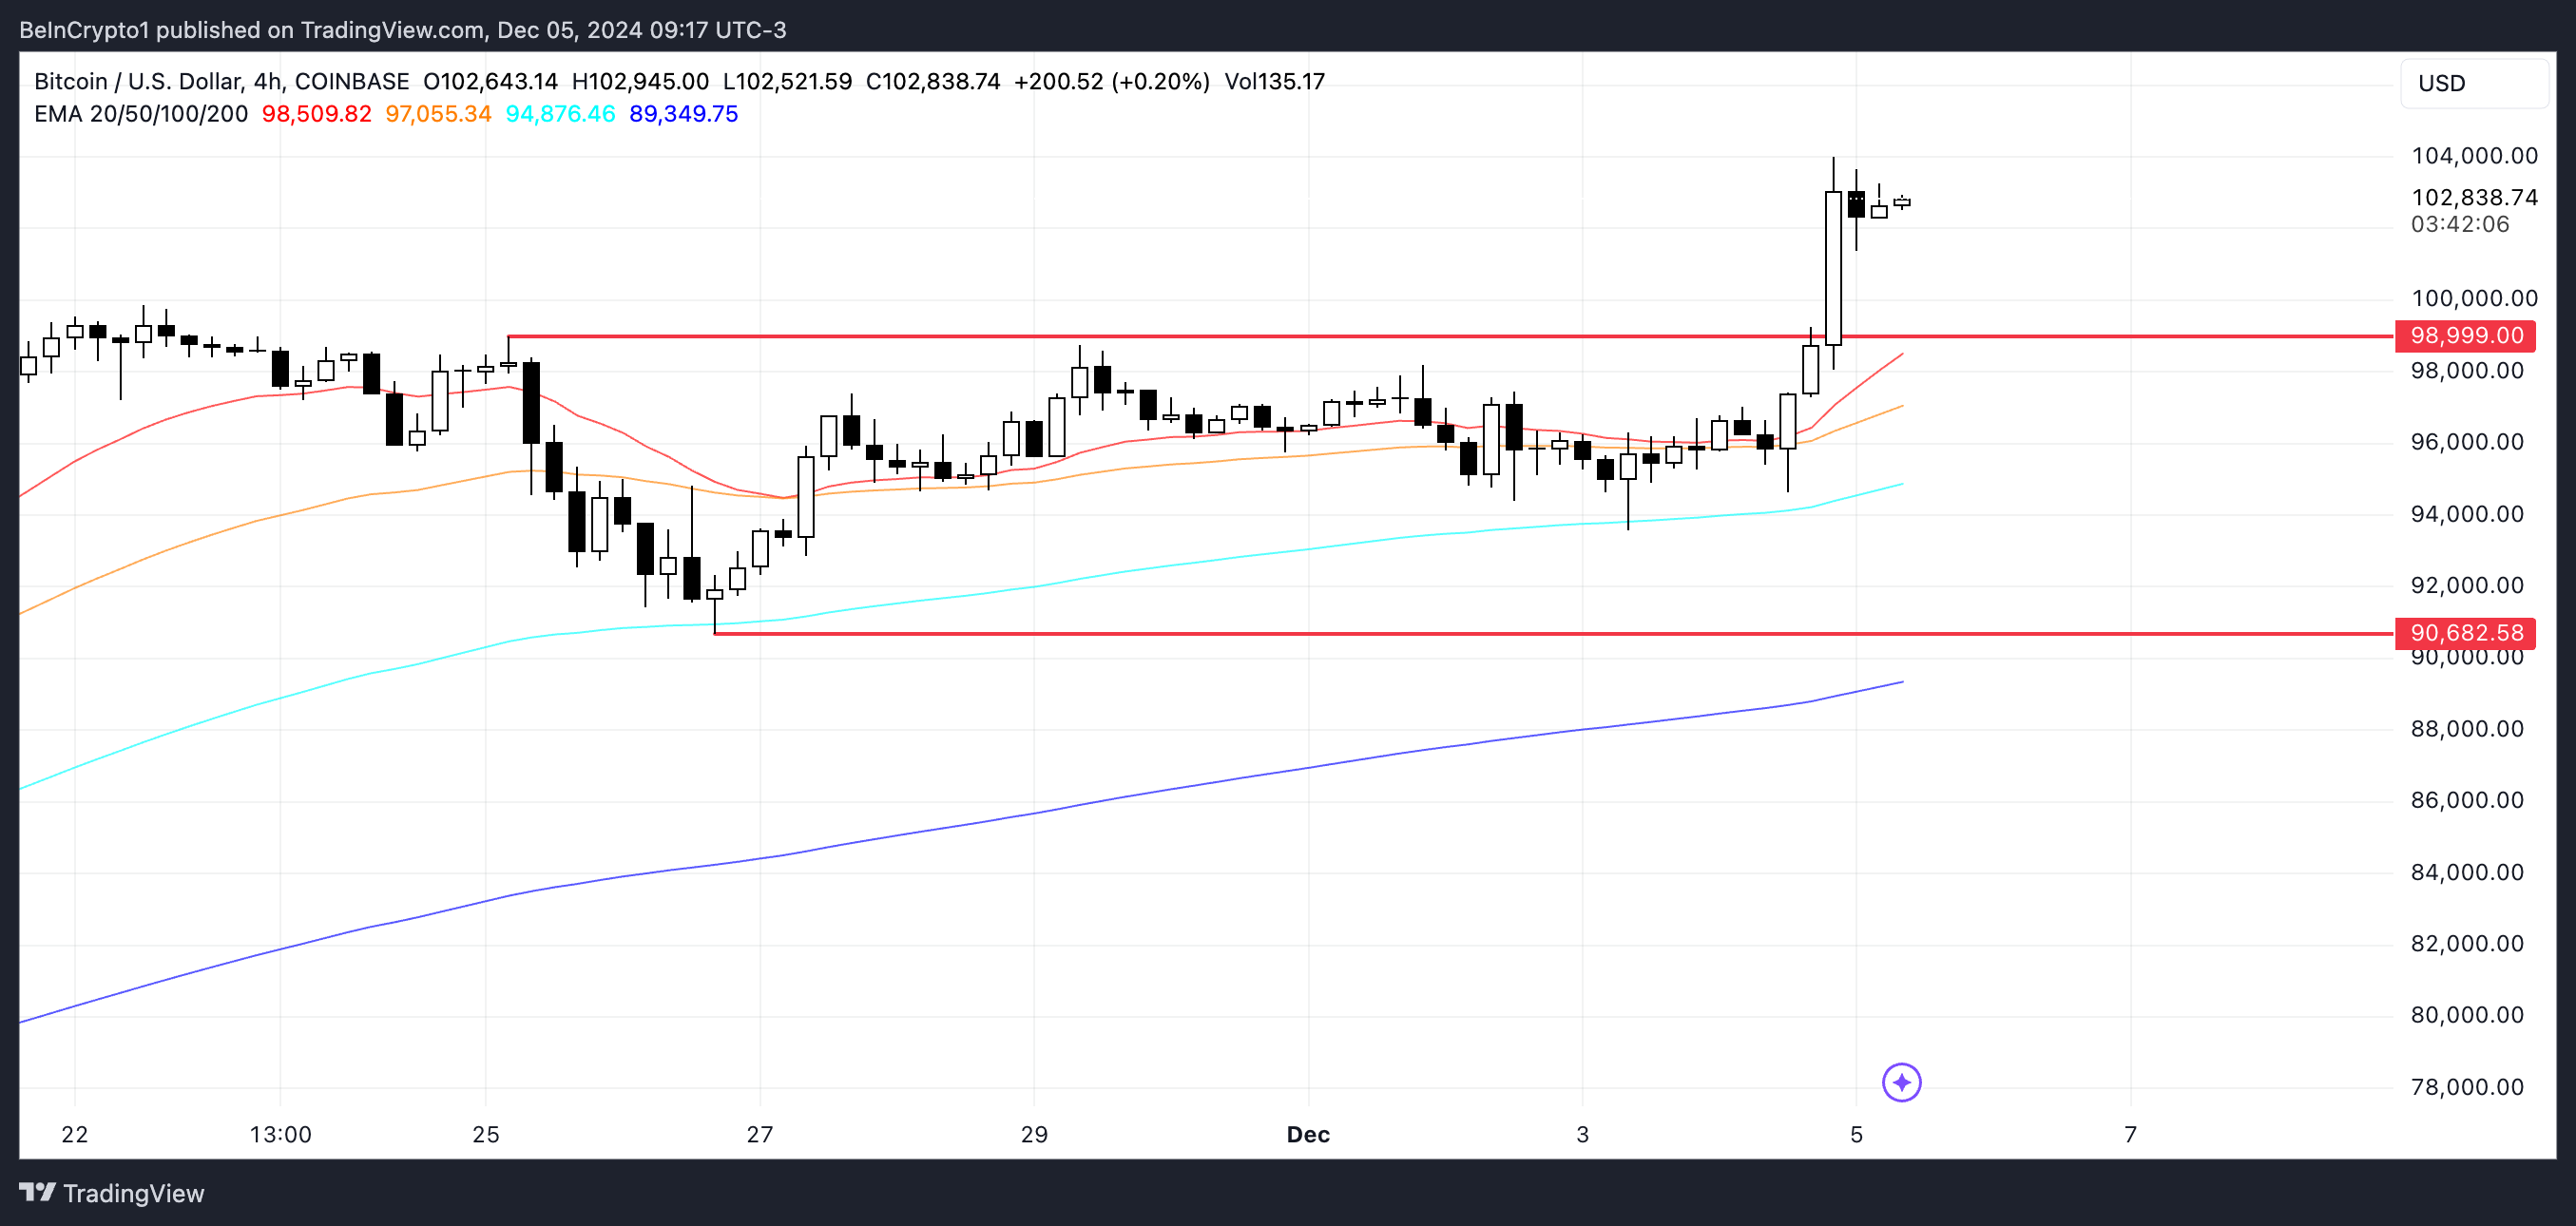
The BTC price chart shows the EMA (Exponential Moving Average) lines in a strong bullish configuration, with the short-term lines above the long-term lines and the price trading above all of them.
This alignment indicates strong bullish momentum. If the trend strengthens further and NUPL remains below the euphoria zone, BTC could soon test the $110,000 level. This key resistance has now dropped to less than 7%.

However, before a new surge, BTC price may retest the crucial $99,000 support. If this level is not maintained, the price could drop further to $90,000 before attempting new all-time highs.


