

The price of Mantra (OM) has faced an important technical juncture as several indicators point to potential downward pressure. The DeFi token has declined 13% over the past 7 days and is currently trading 21% below its all-time high reached on November 18.
Technical indicators paint a mixed picture, with the RSI remaining in neutral territory but the Ichimoku Cloud suggesting increasing bearish momentum. Adding to the uncertainty, a death cross formation is looming and could accelerate the downward move if confirmed.
OM RSI Neutral Since December 3
The Relative Strength Index (RSI) is relatively neutral at 38.3 and has seen little volatility since December 3. The RSI is a momentum indicator that ranges from 0 to 100, with readings below 30 considered oversold and above 70 overbought.
The middle range, especially around 40-60, generally indicates a neutral market state where neither buyers nor sellers have decisive control.
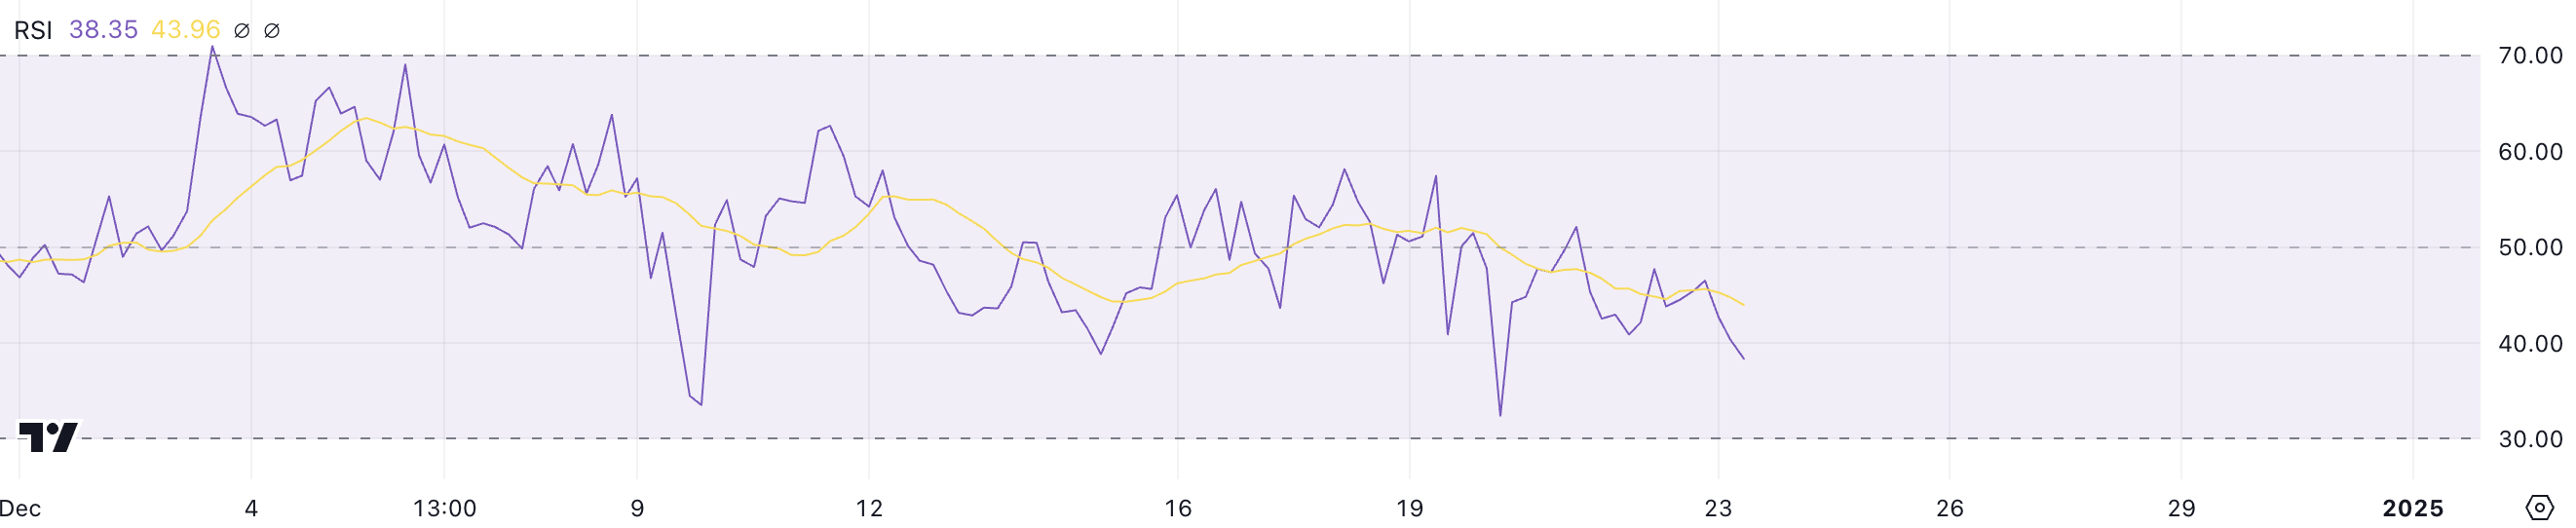
The Mantra RSI currently sits at 38.3, slightly below the neutral midpoint of 50, suggesting a slight bearish bias but not yet in oversold territory. The extended period of neutral RSI readings may indicate a consolidation phase, with the potential for directional moves if the indicator decisively breaks above 50 (bullish) or below 30 (bearish).
The current reading suggests traders may be waiting for stronger signals before making significant moves, but the slight downward tilt of 38.3 warrants attention to potential downside risks.
Ichimoku Cloud Paints Bearish Setup for OM
The OM Ichimoku Cloud chart has shown a developing downtrend over the past week.
The green line (Chikou Span) has crossed below the price action, and the blue line (Conversion Line) has fallen below the red line (Base Line), forming a bearish crossover around December 19.
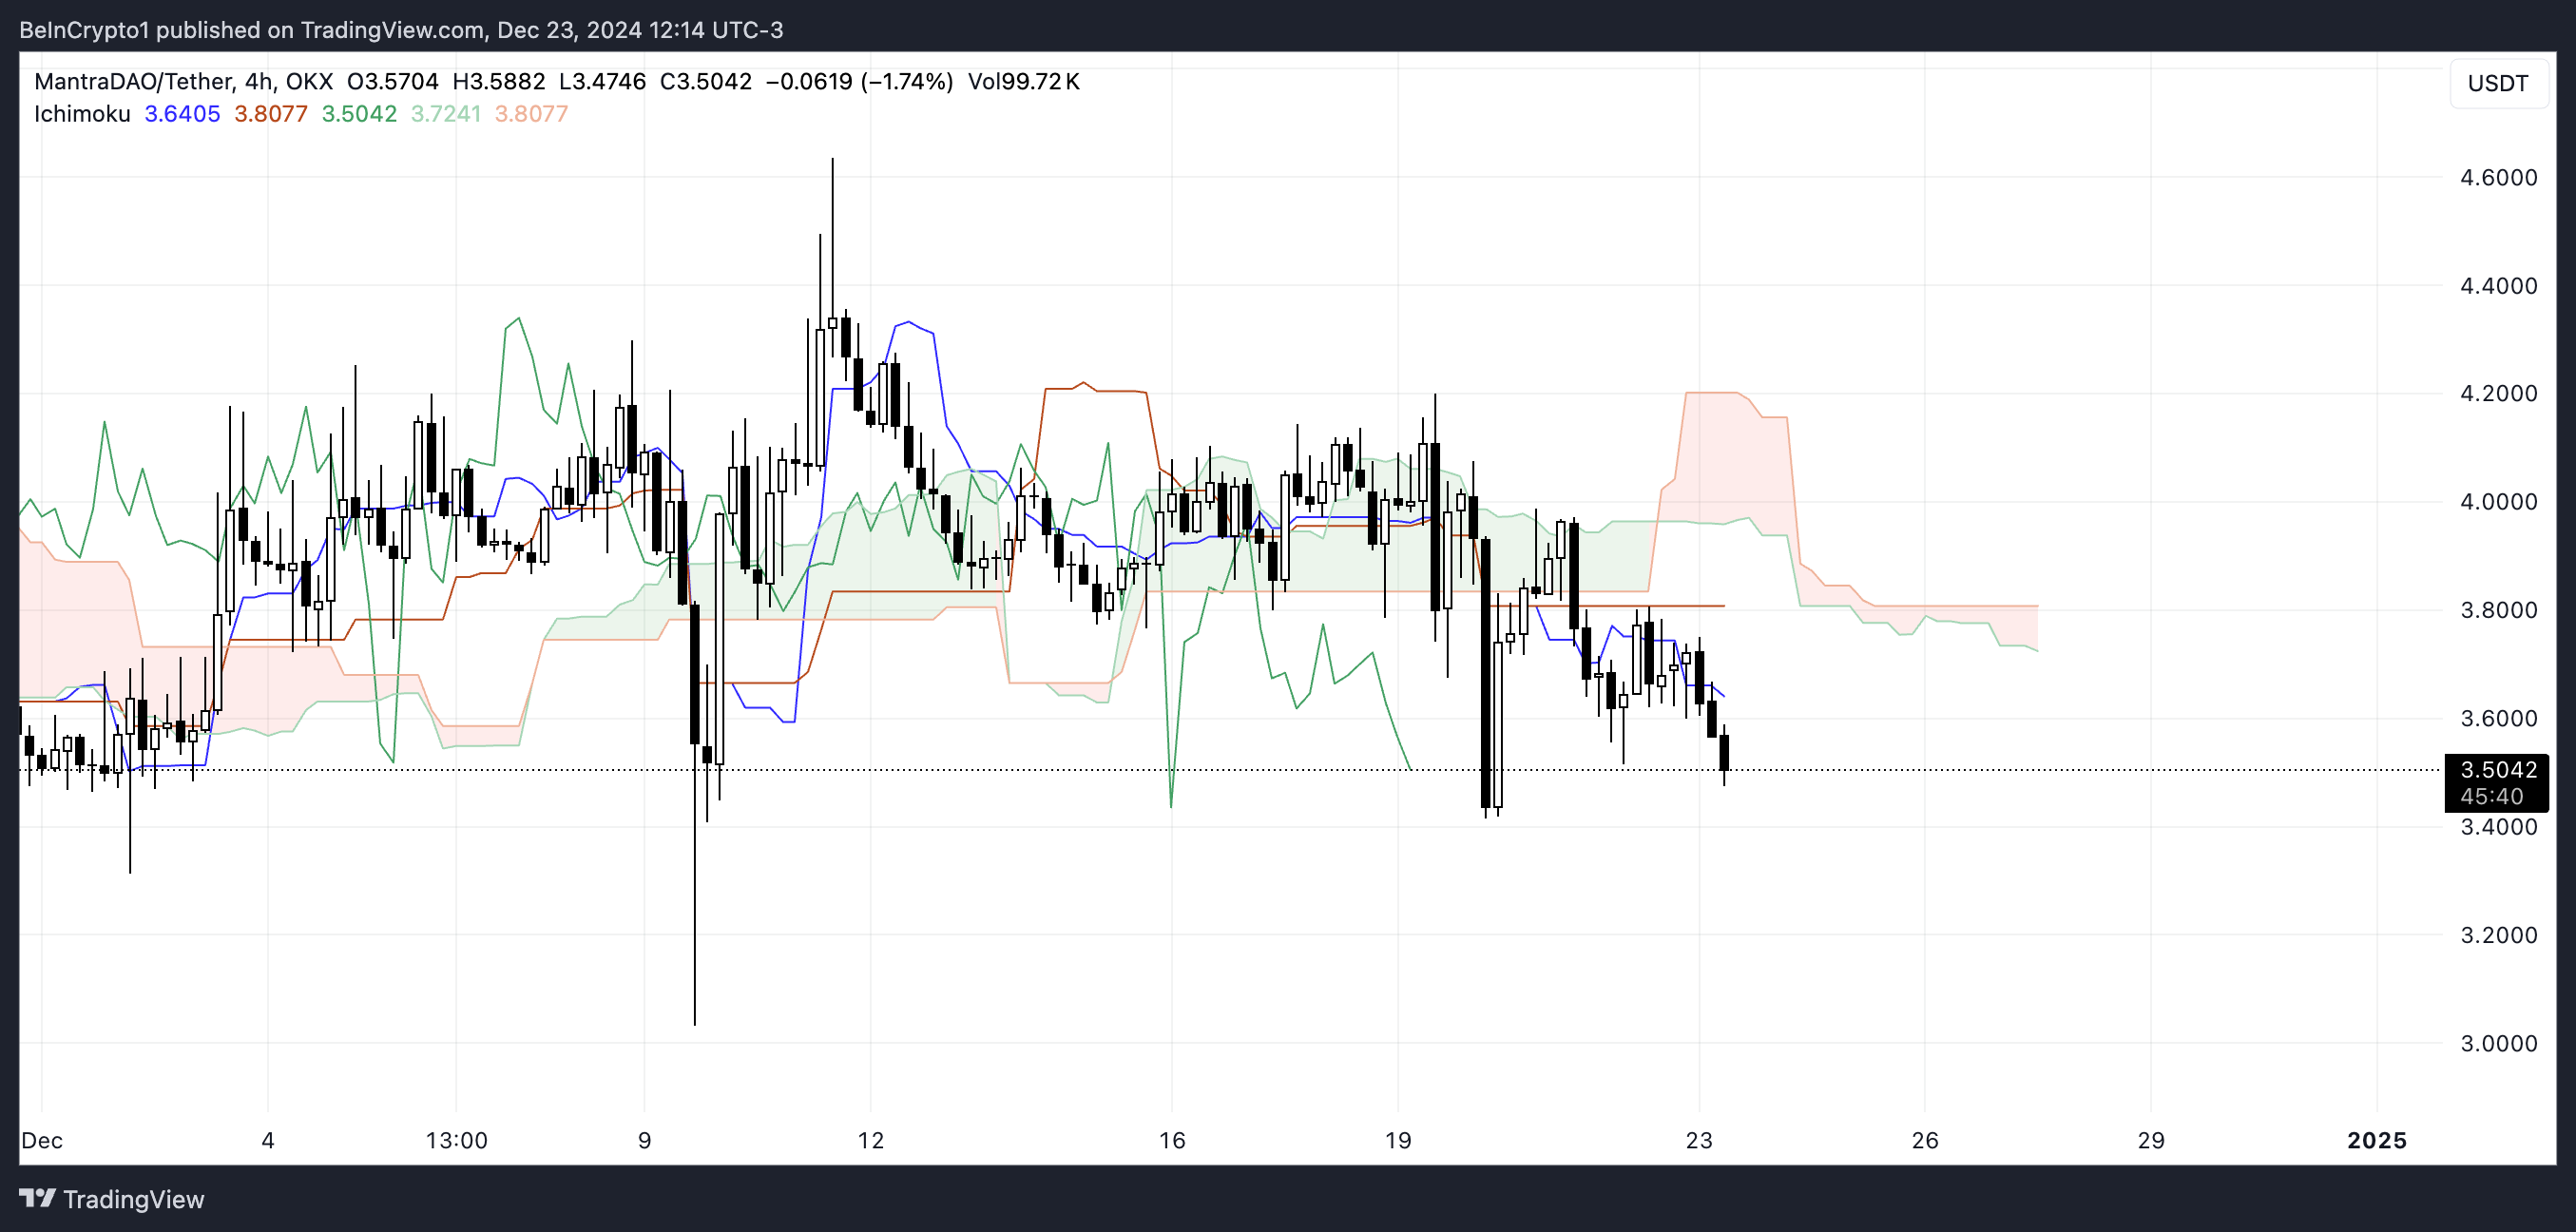
The cloud formation itself has transitioned from green to red, indicating a shift in sentiment from bullish to bearish. The price is currently trading below the cloud and all major Ichimoku lines, suggesting strong bearish momentum.
However, as all the lines begin to converge near the current price level, this could signal a potential consolidation phase or a trend change.
OM Price Prediction: $3.31 Support Level Crucial
The short-term moving averages for OM are currently above the long-term moving averages, but the decreasing momentum suggests a potential death cross formation.
If this bearish signal materializes as the short-term MA crosses below the long-term MA, Mantra price could be pushed down to the $3.31 support level, and potentially further to $3.03 if the first support fails.
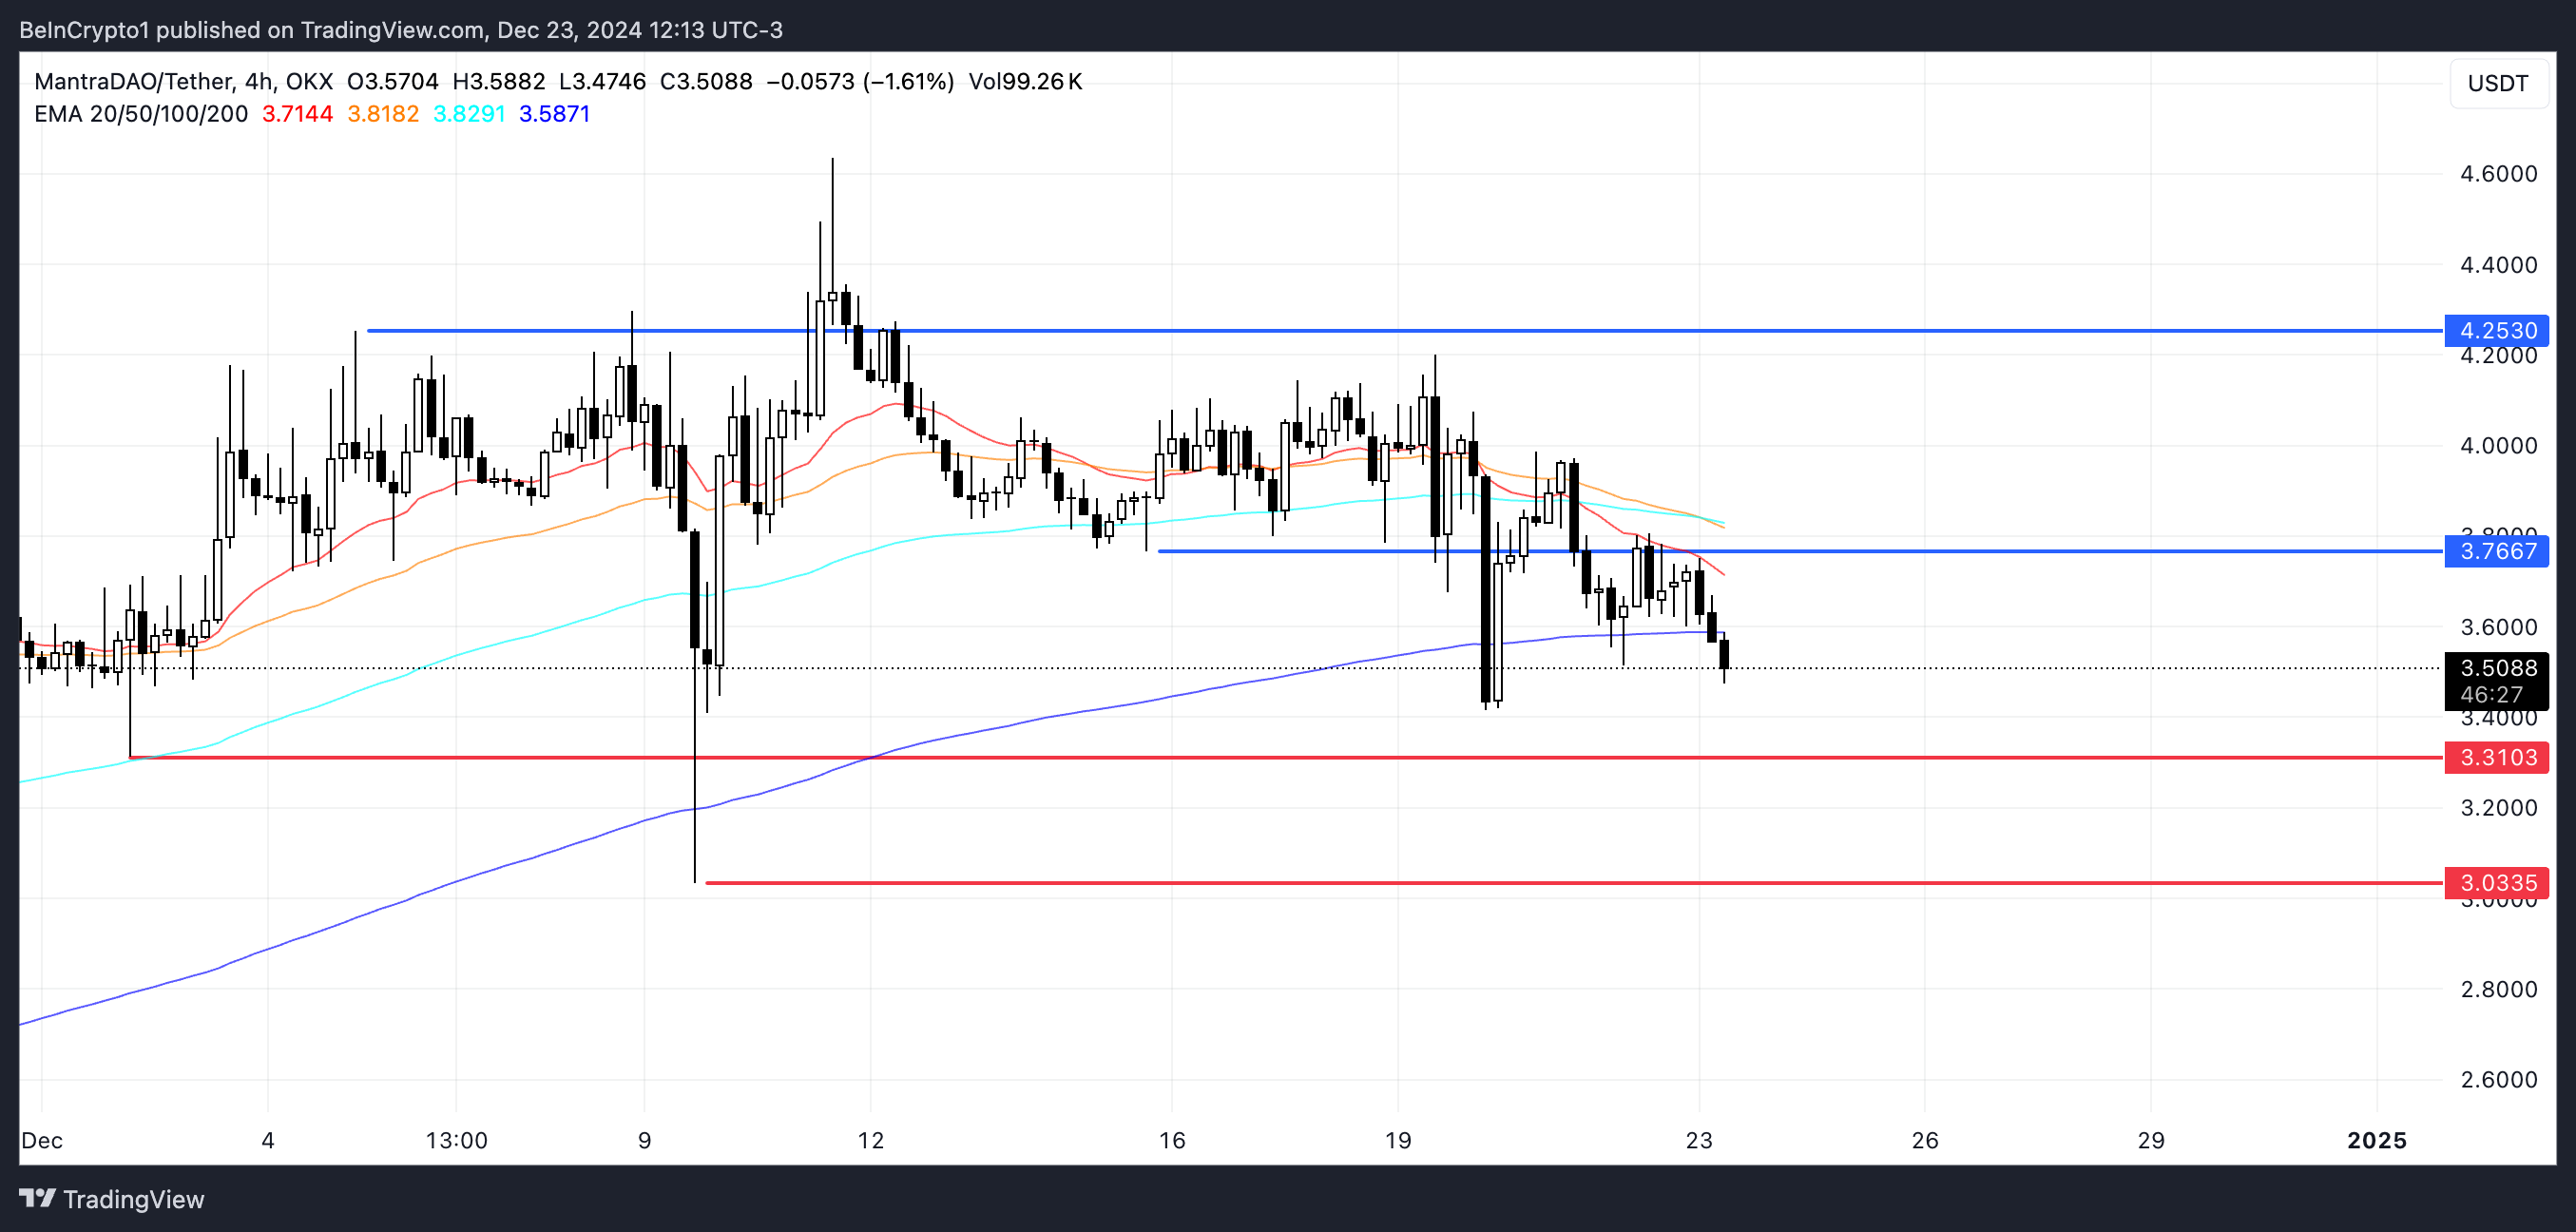
Conversely, if OM price recovers bullish momentum before the death cross formation, it could target the immediate resistance at $3.76. Successfully breaking above this level could open the door for an extended upside towards the $4.25 level, but this scenario may require a clear shift in market sentiment and a new surge in the real-world asset (RWA) narrative.


