HBAR, the native token that powers the Hedera Hashgraph distributed ledger, has seen an 11% price increase in the past 24 hours. This price increase comes as demand for the token has increased significantly in recent days.
Technical analysis suggests that HBAR may be ready for further upside. This analysis highlights price levels that token holders should pay attention to.
HBAR token holders strengthen their buying power
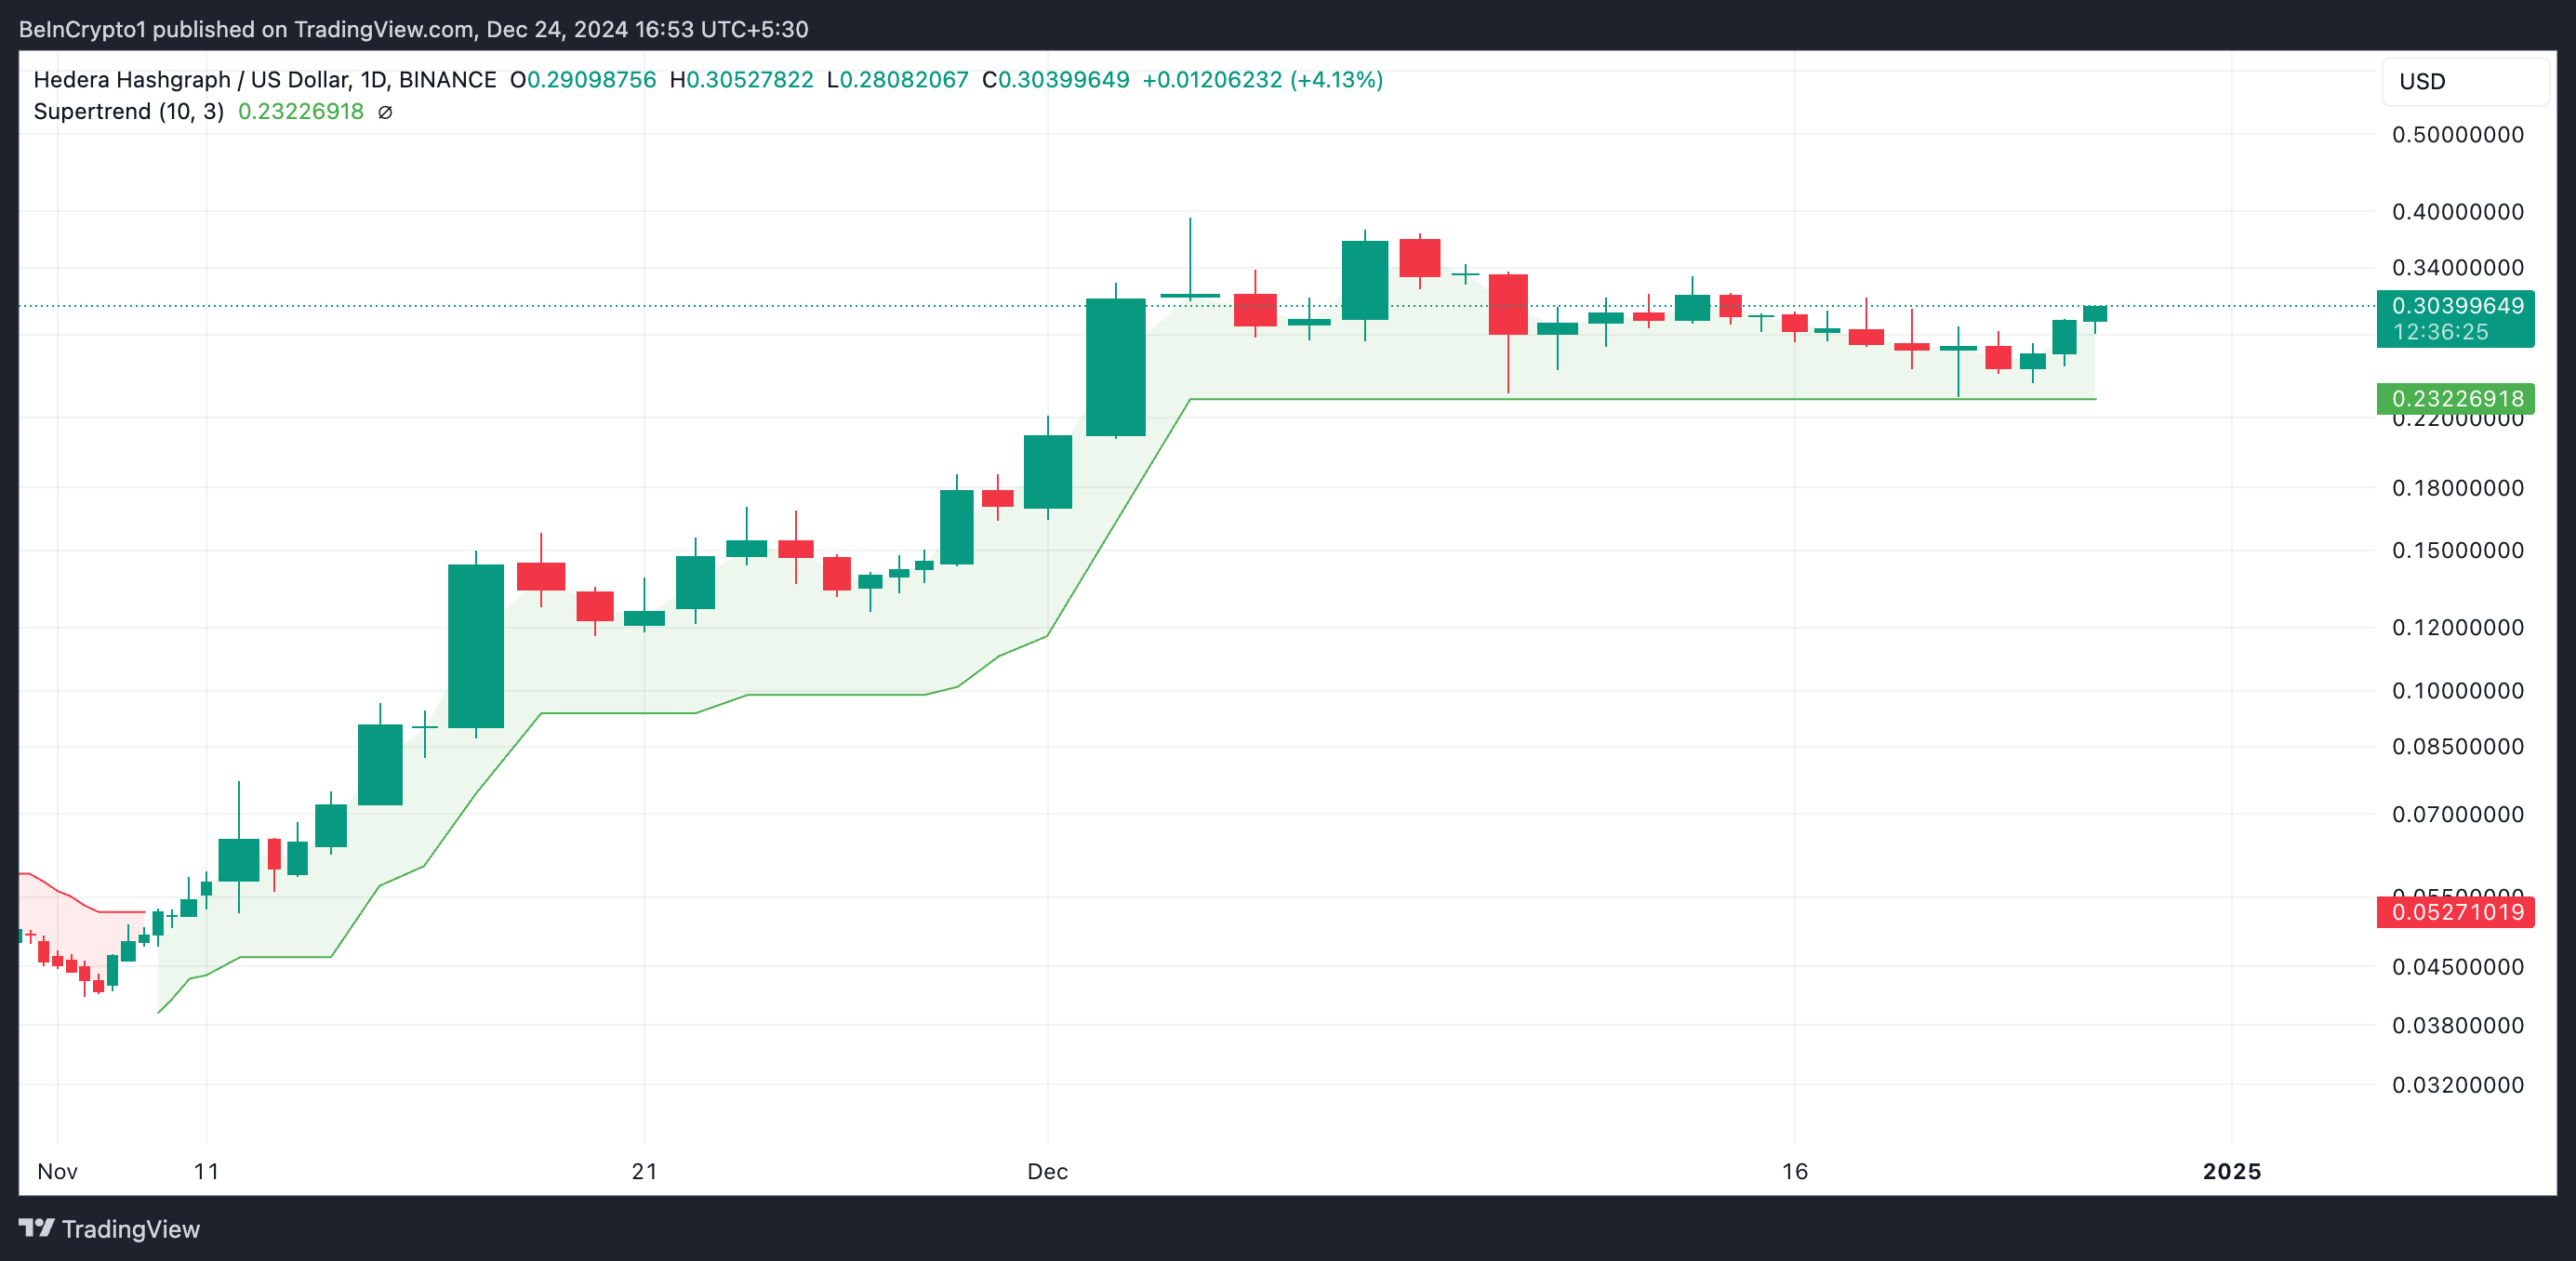
According to the daily chart of HBAR , despite the recent correction, the price remains above the super trend indicator, which continues to provide dynamic support at $0.23.

The Super Trend indicator tracks the direction and strength of an asset's price trend. It is displayed as a line on the price chart, which changes color to indicate the trend: green for an uptrend, red for a downtrend.
When the price of an asset is above the super trend line, it indicates bullish momentum in the market. In this case, this line provides dynamic support, and as long as the price remains above it, the bullish trend is likely to continue.
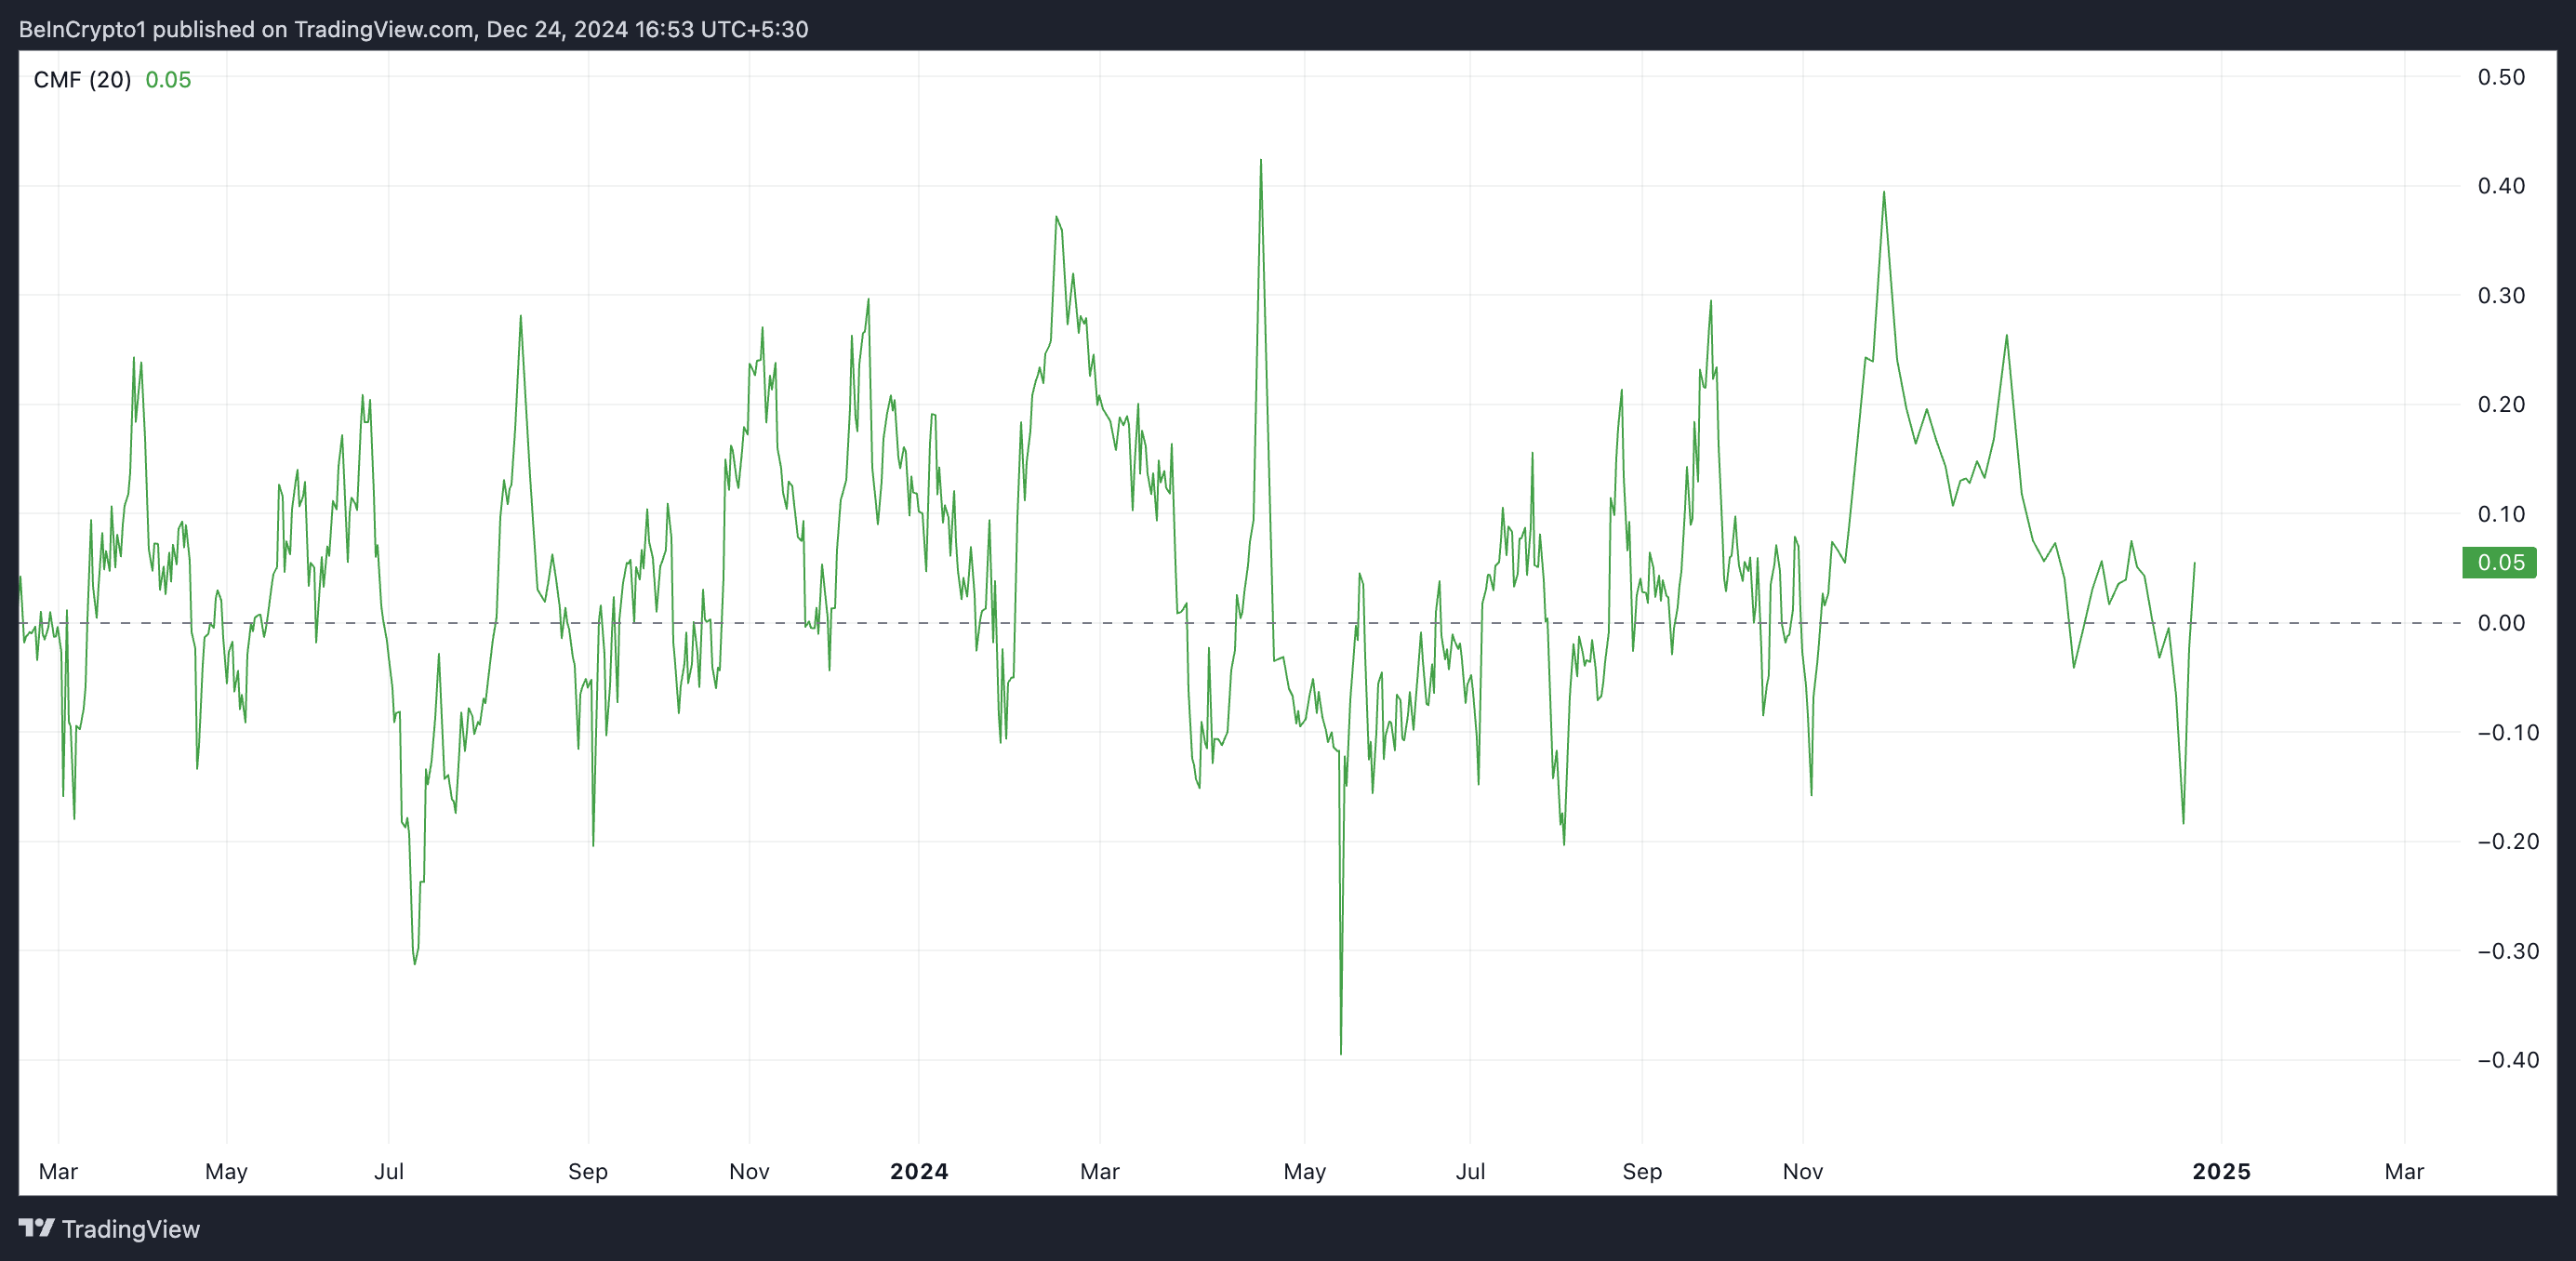
Additionally, HBAR’s rising Chaikin Money Flow (CMF) suggests the possibility of a sustained rally, which stands at 0.05 at press time.

This indicator measures the flow of funds into the asset market. For HBAR, when the value is positive during a price increase, it indicates strong buying pressure, meaning that the volume flowing into the asset is greater than the volume flowing out. This suggests that the price increase is supported by real accumulation, increasing the likelihood of a sustained uptrend.
HBAR Price Prediction: Bullish Outlook $0.39, Bearish Outlook $0.24
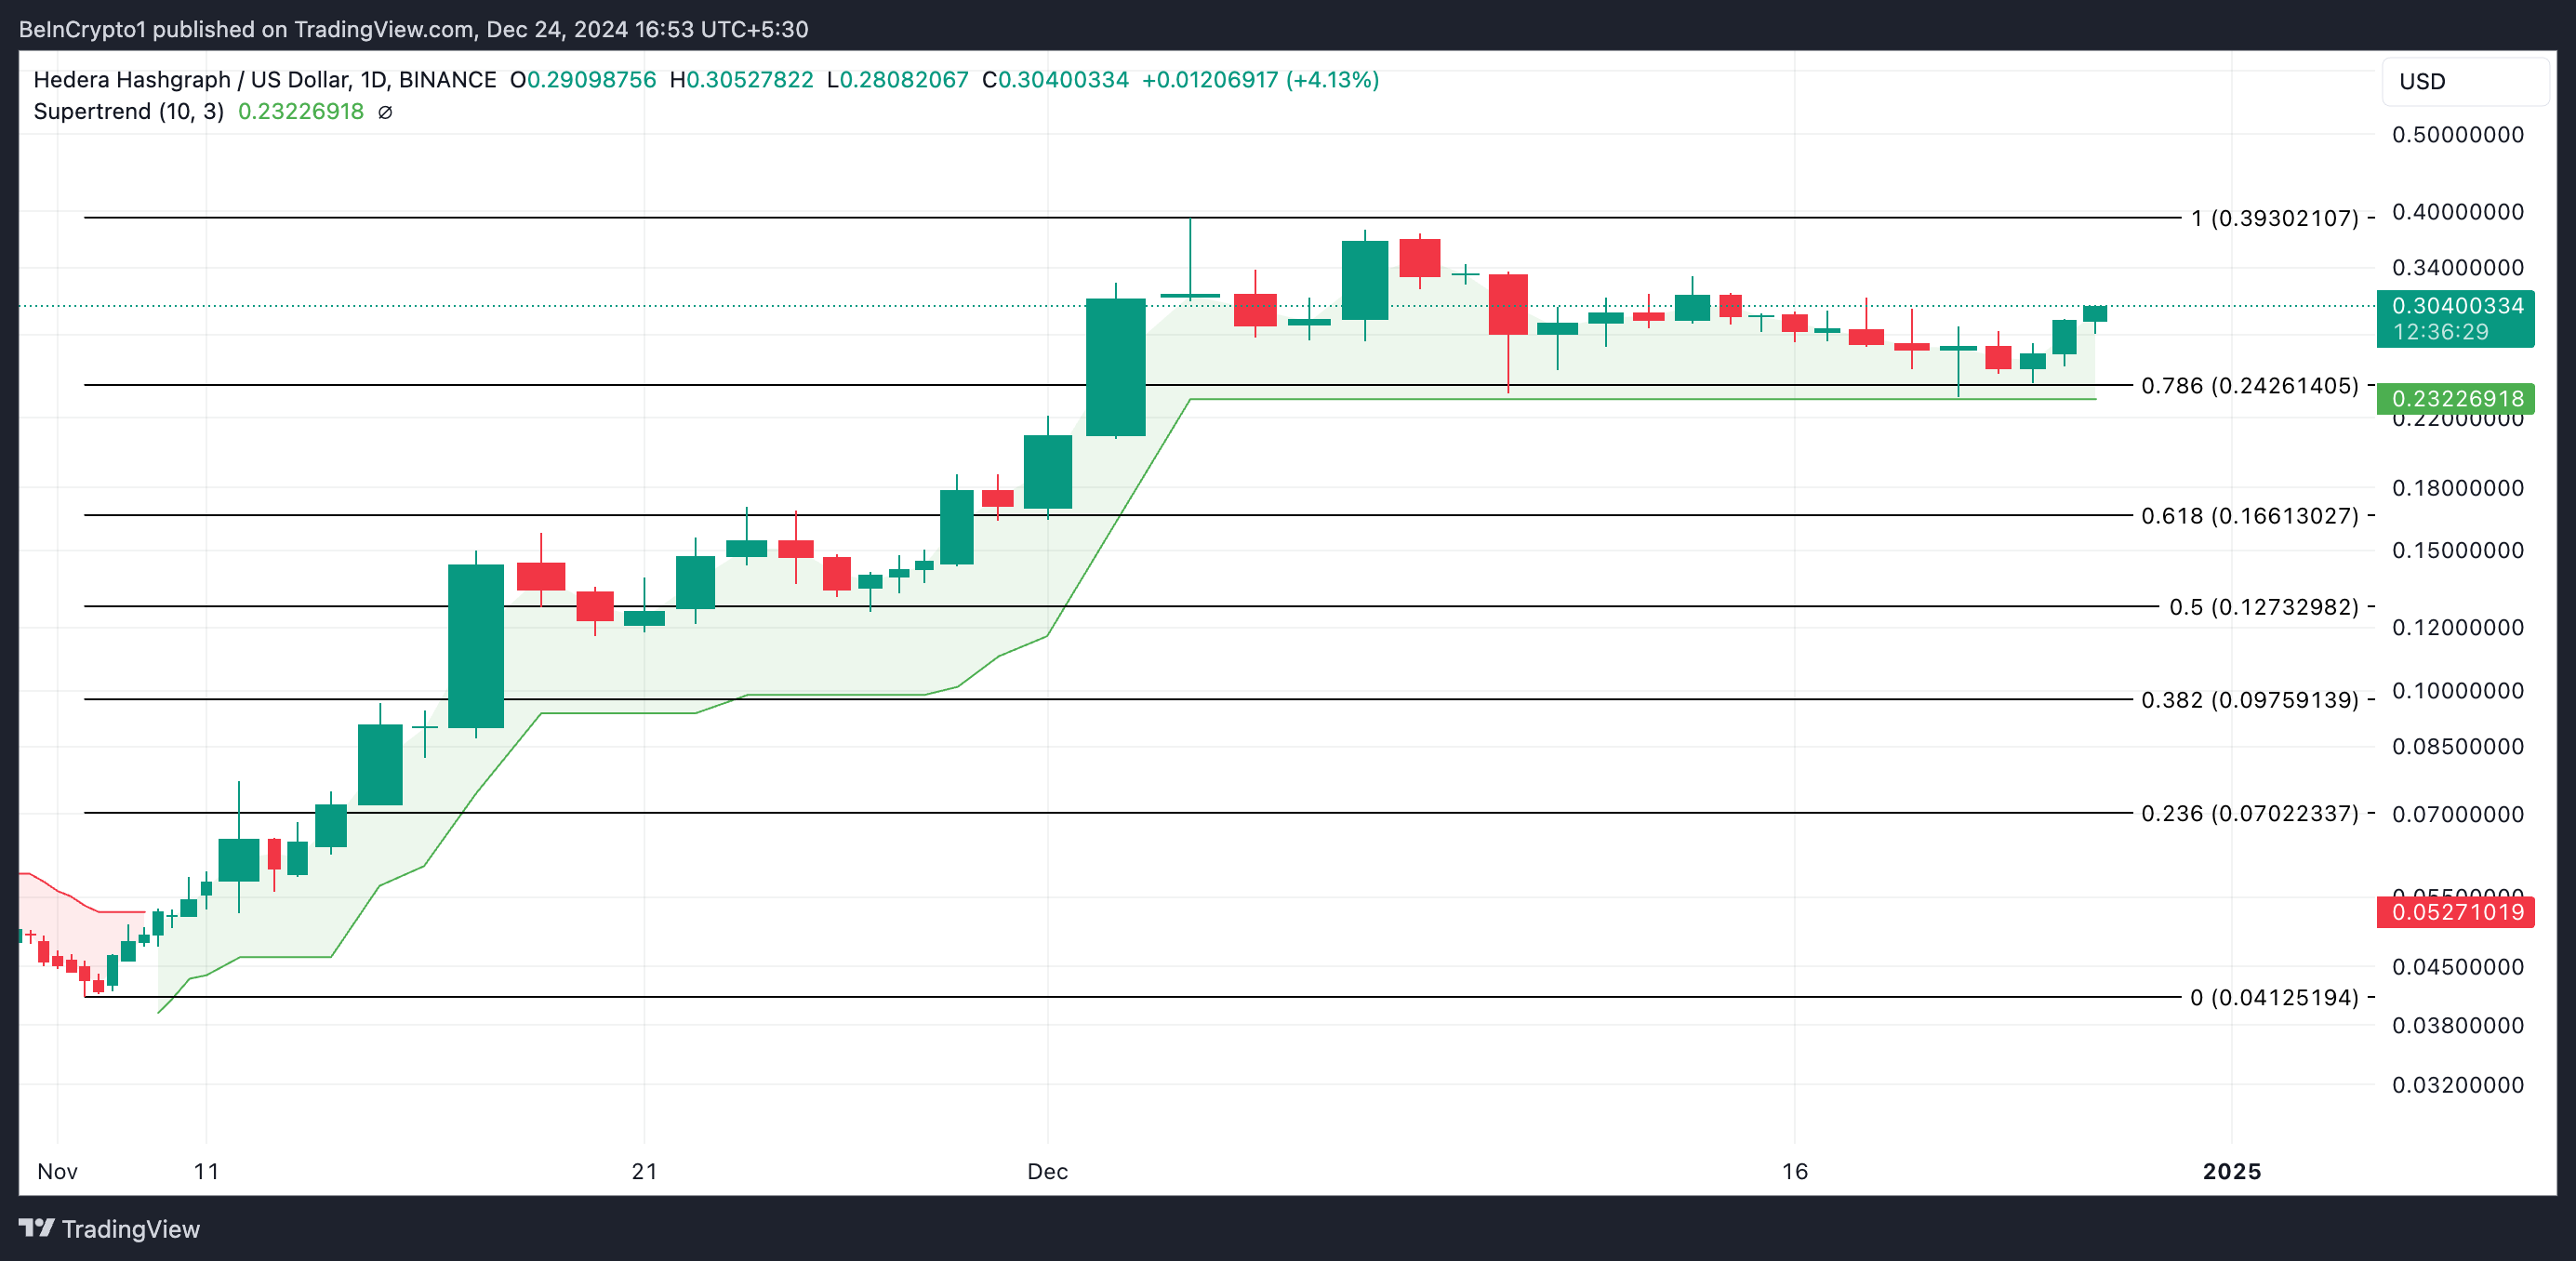
According to the Fibonacci retracement tool, the price of HBAR will revisit the 3-year high of $0.39 and rise above it. For this to happen, the price level must turn into support.

On the other hand, if the selling pressure reappears, the price of HBAR will lose some of its recent gains and head towards $0.24. A drop below this level will lead to a further decline to $0.23, the dynamic support of the super trend. If this level is not maintained, the price of the HBAR token may plunge to $0.16.


