Author: Carol, PANews
In 2024, Bitcoin broke through the $100,000 mark in an upward trend, establishing a new milestone for the development of digital assets. The three keywords "ETF Approval", "Halving", and "US Election" drove the market changes of Bitcoin throughout the year. Behind this overall picture, what specific changes in the trading market, on-chain fundamentals, and application layer of Bitcoin are worth noting? How do these changes potentially impact the development in 2025?
PANews data column PAData has analyzed the changes in Bitcoin in 2024 from multiple dimensions, and in general:
Trading Market:
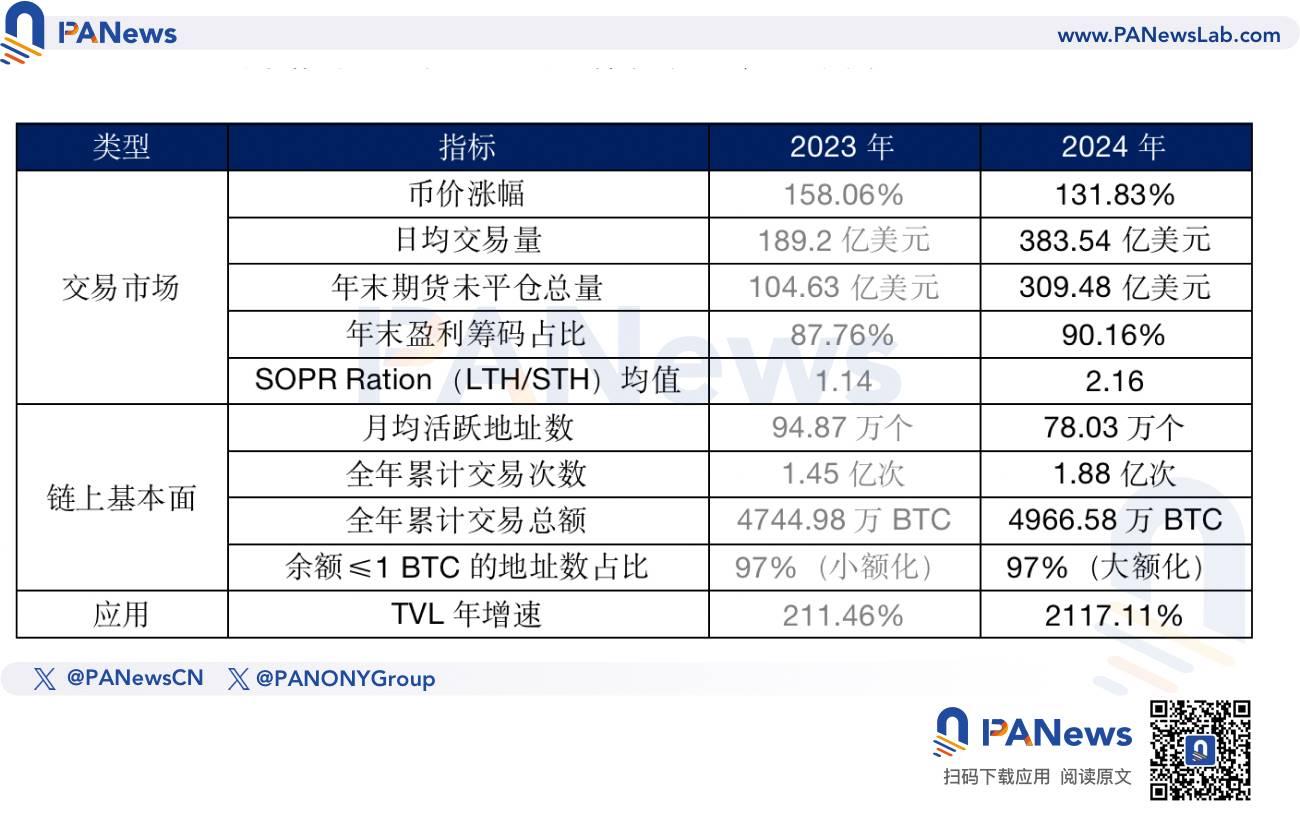
The annual increase in the price of Bitcoin reached 131.83%, less than the 158.06% of the previous year.
The main driver of the rise in Bitcoin's price this year was the gradual improvement and relaxation of the regulatory environment, rather than just the scarcity of supply (halving).
The profitability level of long-term holders is better this year, and long-term holders tend to reduce their risk exposure earlier when the market is approaching overheating.
This year's trading market saw both rising prices and trading volumes. The annual average daily trading volume was about $38.354 billion, an increase of 102.72% over the previous year. The total open interest at the end of the year was about $30.948 billion, an increase of 195.79% over the end of the previous year.
The total holdings of Bitcoin ETFs reached 11.2006 million BTC, a strong annual growth of 80.87%.
On-chain Fundamentals:
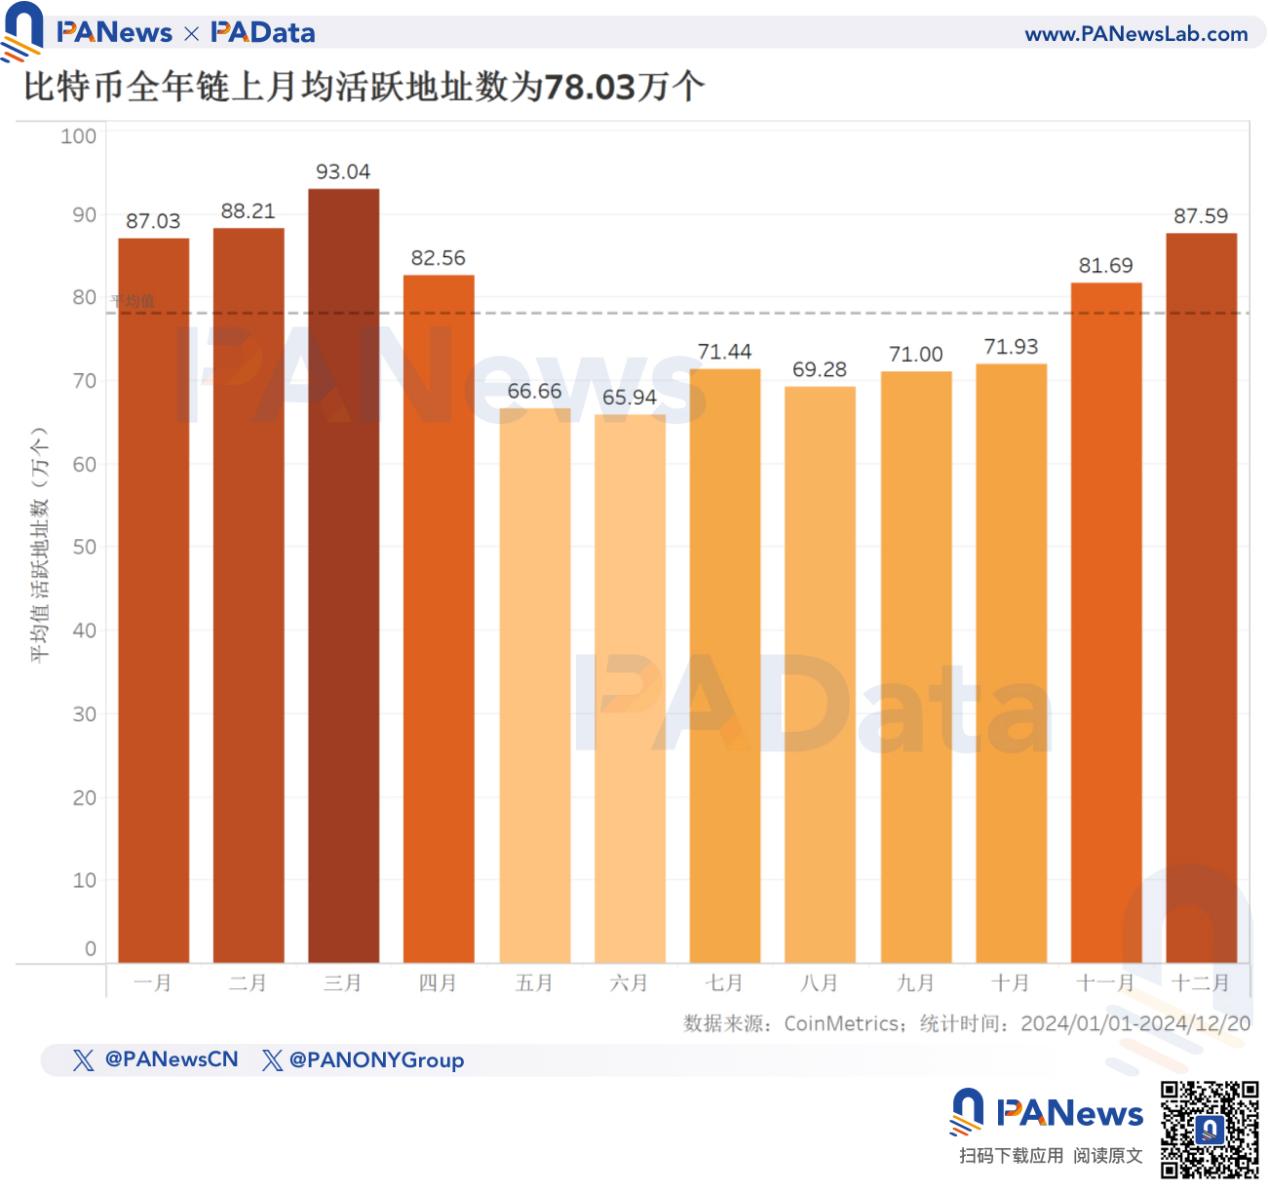
The average monthly active addresses on the Bitcoin network this year was about 780,300, a decrease of 17.75% compared to the previous year. This may indicate that in the context of a clear upward trend, long-term holding strategies dominate, and the market may shift to a low-liquidity growth phase led by institutional investors.
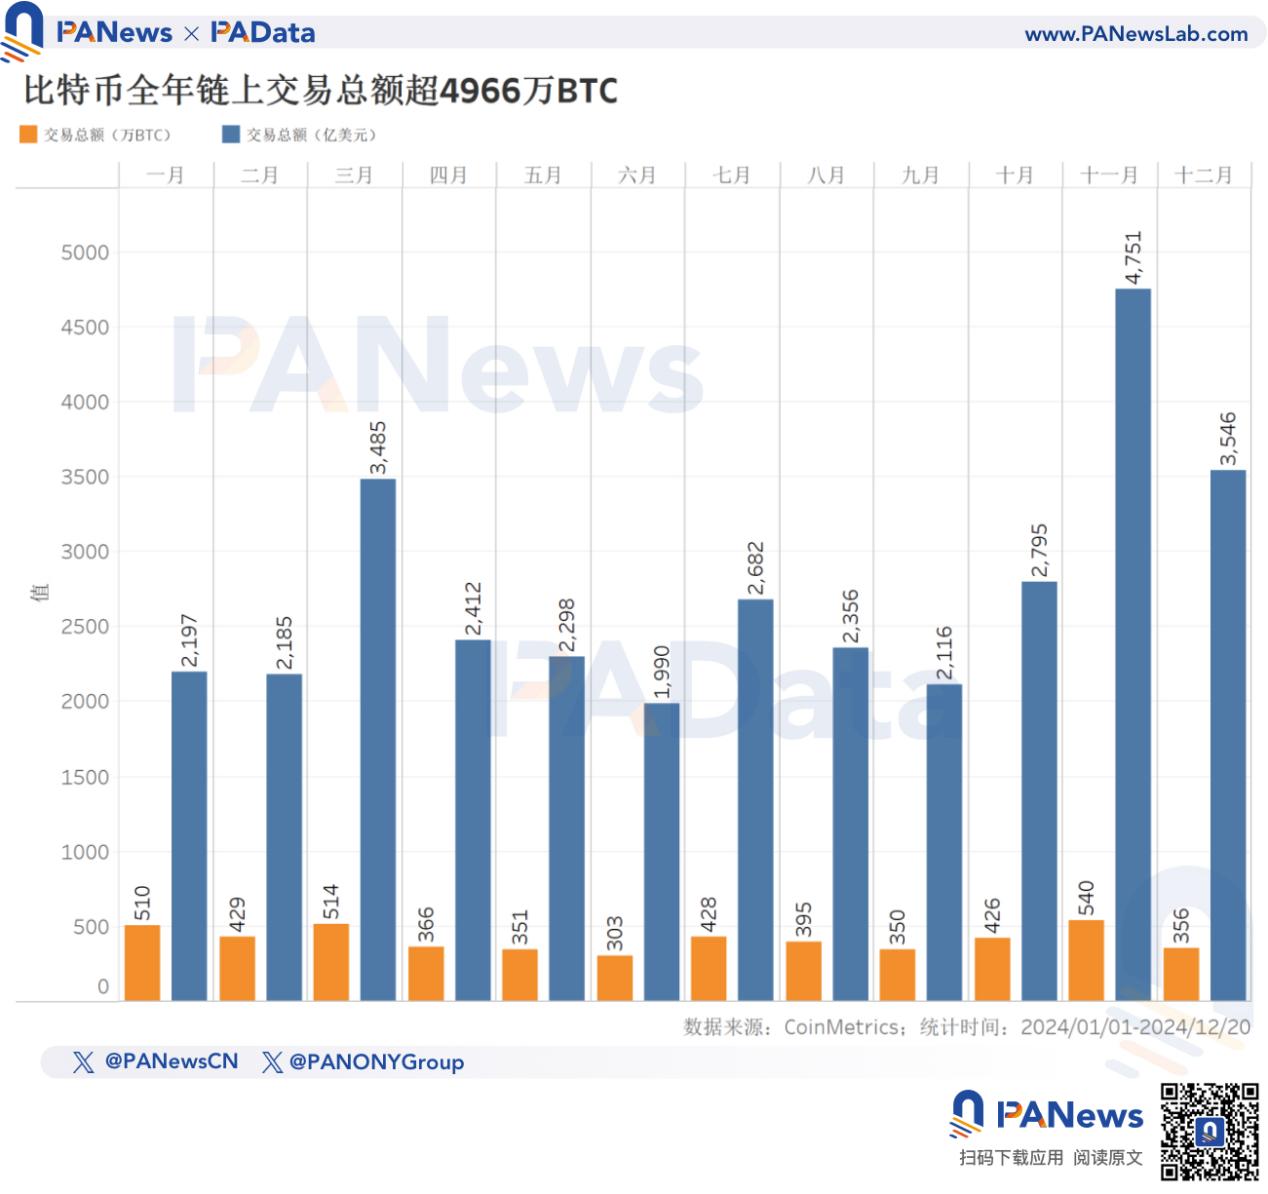
The total on-chain transaction volume for the year was about 49.6658 million BTC, equivalent to $3.28 trillion. The total transaction volume in BTC terms increased slightly by 4.67% compared to the previous year.
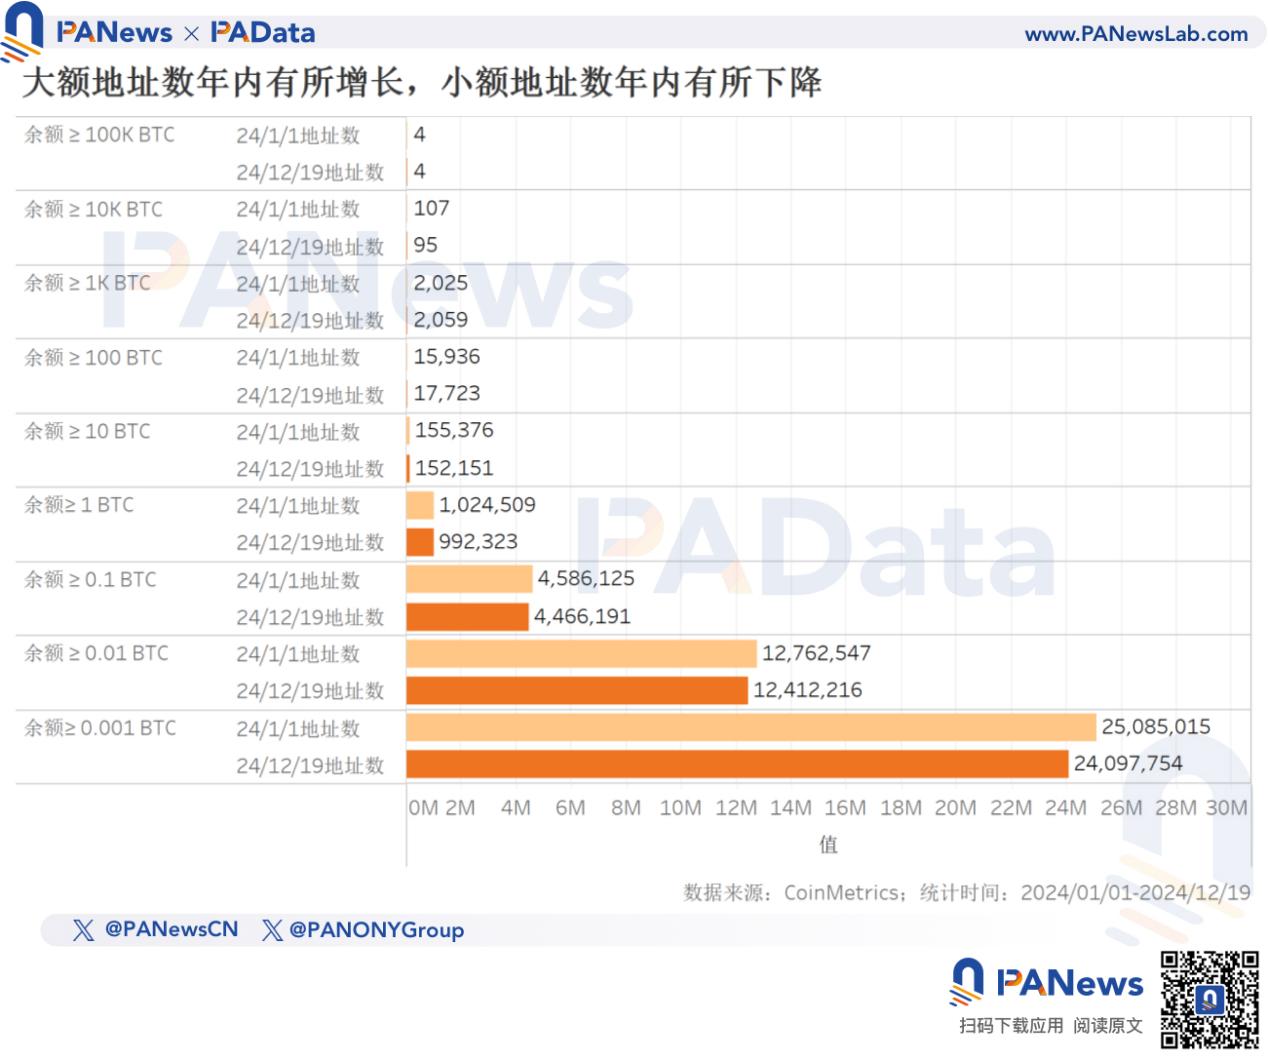
The number of addresses holding between 100 and 1,000 BTC increased by 11.21%, indicating a reversal of the trend towards smaller address balances in recent years, with a trend towards larger balances this year.
Application Layer:
The TVL of Bitcoin at the end of the year was about $6.755 billion, with an annual increase of 2117.11%, of which Babylon's TVL accounted for 82.37%.
Staking has replaced payment (Lightning Network) as the mainstream application of Bitcoin.
Outlook for Next Year:
The tightening of both short-term and long-term liquidity under the QT background poses the main pressure for Bitcoin to continue its upward trend next year.
This year's rise is related to the expected improvement in the regulatory environment after the election. If the regulatory environment can be further relaxed next year, it will be conducive to the continued rise of Bitcoin.
BTCFi may develop further, but for its application to become the main logic for Bitcoin pricing, it still needs to achieve sustained expansion of application scale, which may still be difficult next year.
Trading Market: Annual Price Increase Exceeds 131%, ETF Holdings Exceed 1.12 Million BTC
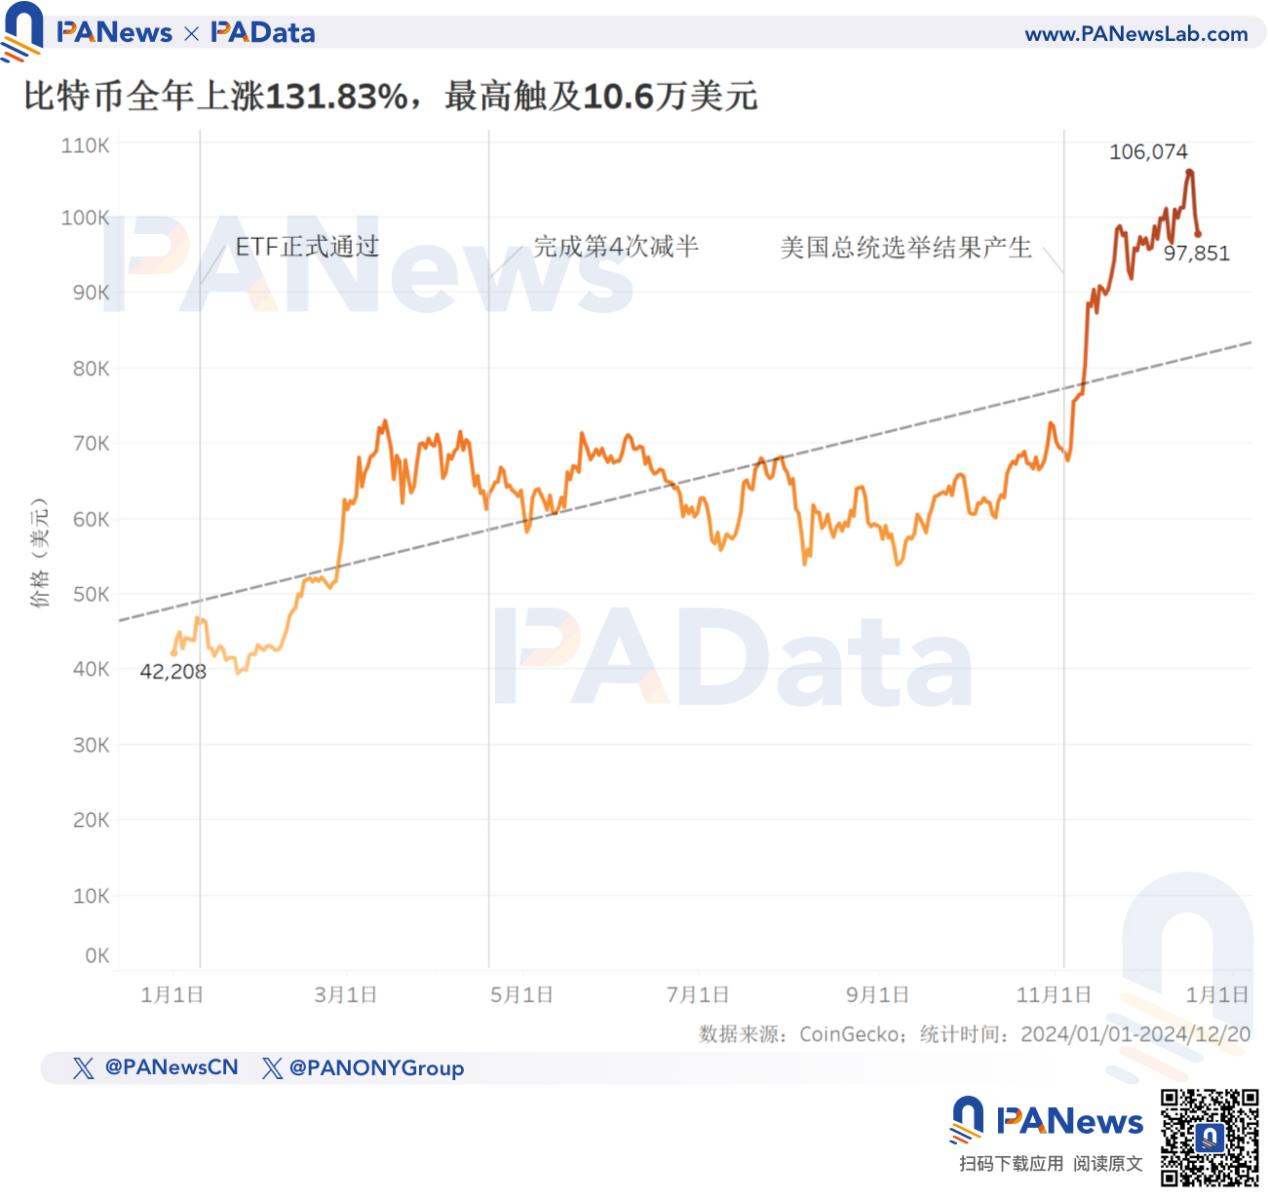
In 2024, the price of Bitcoin rose from $42,208 at the beginning of the year to $97,851 at the end of the year (as of December 20), with an annual increase of 131.83%. On December 17, it even strongly broke through the $100,000 mark, reaching a record high of $106,074, with a maximum annual increase of about 151.31%. Although it began to correct slightly at the end of the year, the price is still running at historical highs.
In terms of the overall trend, this year, Bitcoin experienced three stages: "rise - sideways - rise", which basically corresponded to the three major events of "ETF Approval", "4th Halving", and "US Presidential Election". In general, the logic behind this year's rise in Bitcoin was not solely attributable to the scarcity of supply brought about by the halving, or at least not entirely the traditional logic of supply scarcity. The approval of ETFs and the results of the US election indicated that the main driver of the rise in Bitcoin's price was the gradual improvement and relaxation of the regulatory environment, which attracted a large amount of institutional capital to the market, injecting liquidity and further pushing up the price.
According to data from glassnode, the profitability of the coins at the end of the year has reached 90.16% (as of December 20), a historical high. In terms of profitability strategy, the LTH-SOPR/STH-SOPR (the output profitability ratio of long-term holders to short-term holders) has risen from 1.55 at the beginning of the year to 2.11 at the end of the year, with an annual average of 2.16. Especially since late November, this ratio has been greater than 3 multiple times, and even exceeded 4 at the highest. A ratio greater than 1 indicates that the profitability level of long-term holders is higher than that of short-term holders, and the larger the value, the higher the profitability level of long-term holders.
Overall, the profitability level of long-term holders is better this year, and this advantage becomes more obvious towards the end of the year. In addition, combined with the price trend, the profitability peak of long-term holders appears earlier than the price peak, indicating that long-term holders tend to reduce their risk exposure earlier when the market is approaching overheating.
This year, the Bitcoin trading market saw both rising prices and trading volumes.
According to statistics, the average daily trading volume of Bitcoin for the whole year was about $38.354 billion, with a single-day high exceeding $190.4 billion. The trading peaks occurred after November, with average daily trading volumes of $74.897 billion and $96.543 billion in November and December respectively, significantly higher than the previous monthly average of $30.8 billion.
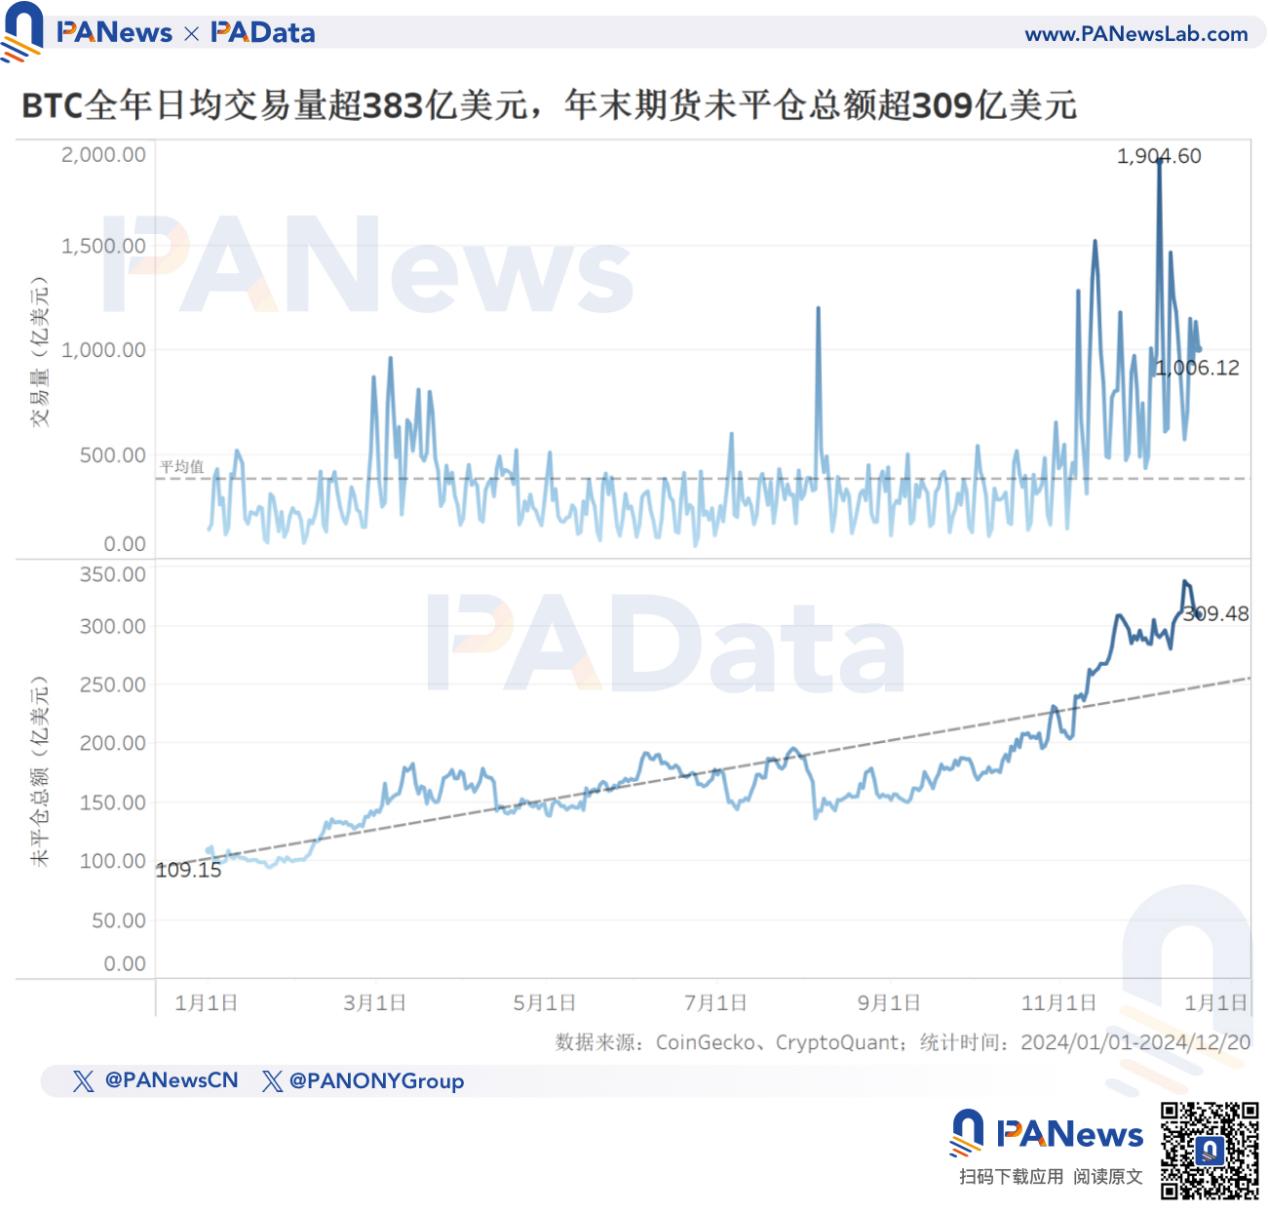
The futures market was also active. The total open interest increased from $10.915 billion at the beginning of the year to $30.948 billion at the end of the year, an annual increase of 183.53%, with a significant increase.
As one of the main factors driving the rise in Bitcoin's price, the asset holdings of various ETFs have always been closely watched. According to statistics, the total holdings of Bitcoin ETFs increased from the initial 619,500 BTC to 11.2006 million BTC at the end of the year, a strong annual growth of 80.87%. The rapid growth period was basically consistent with the period of rapid price increase, both in 2-3 March and after November.
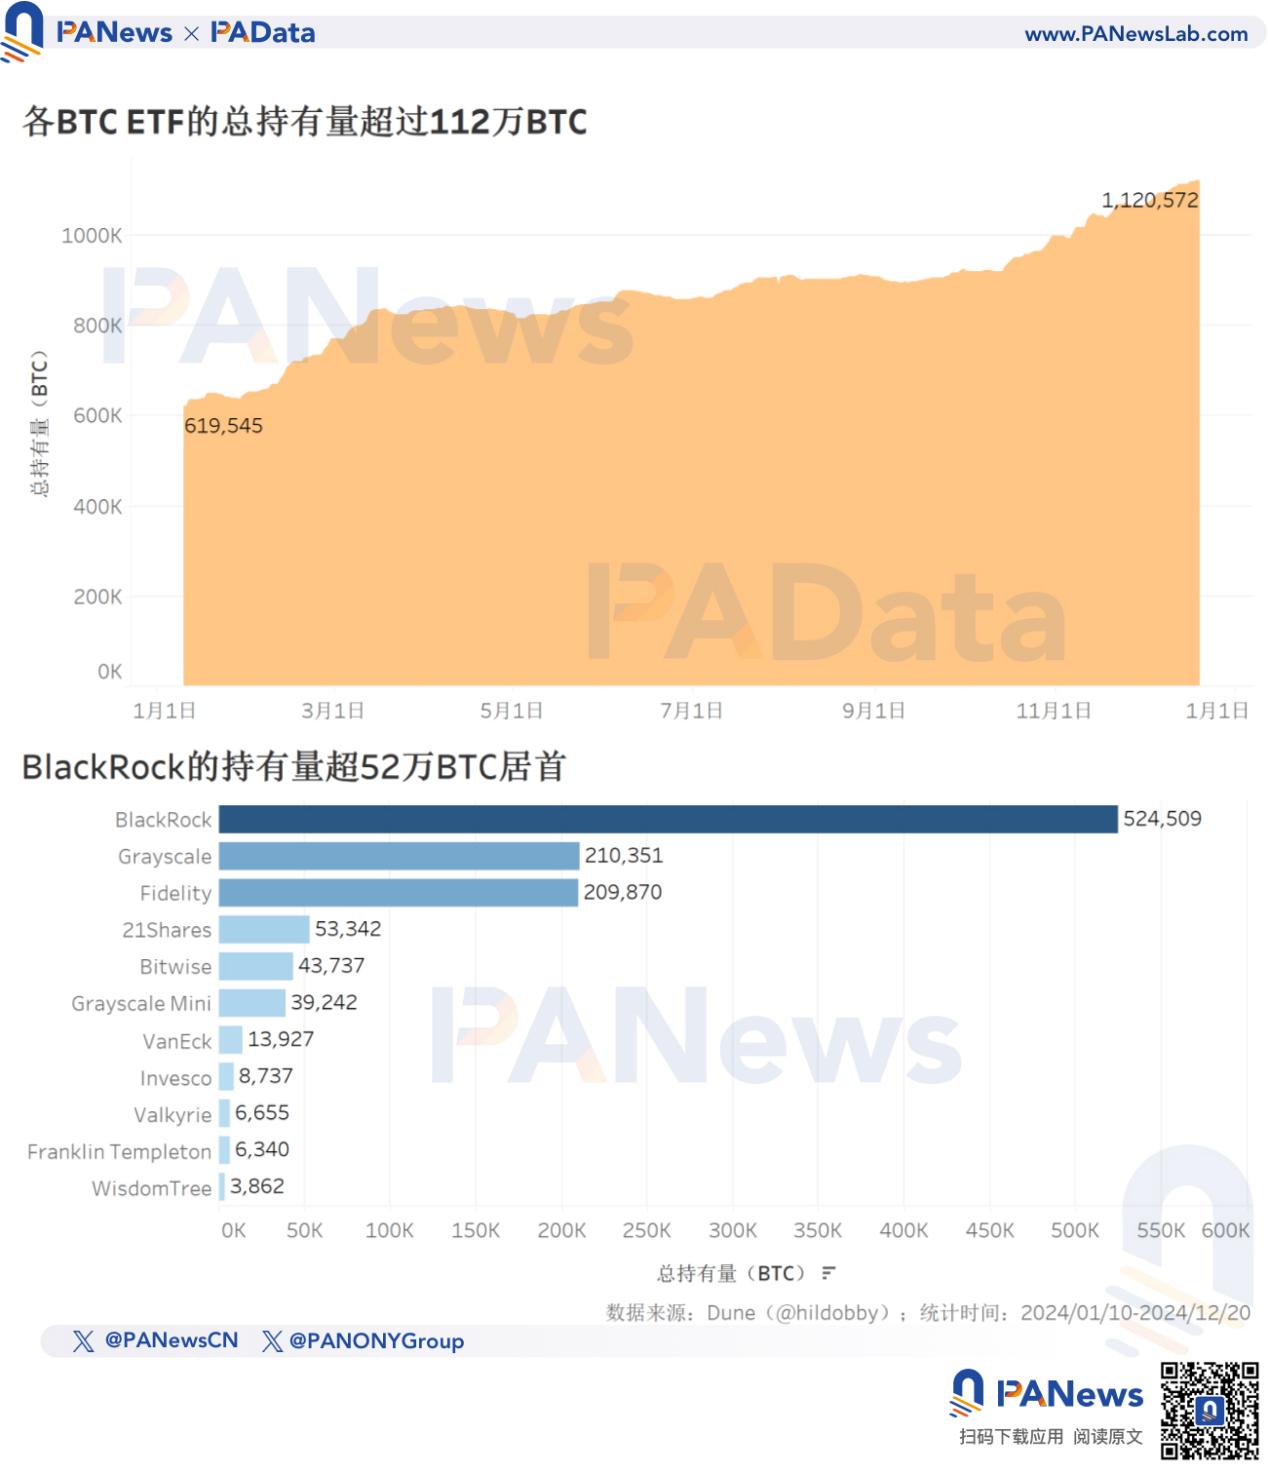
Currently, BlackRock's holdings have reached 524,500 BTC, the largest among all ETFs. In addition, Grayscale and Fidelity also have relatively large holdings, reaching 210,300 BTC and 209,900 BTC respectively. The holdings of other ETFs are relatively low, mostly below 50,000 BTC.
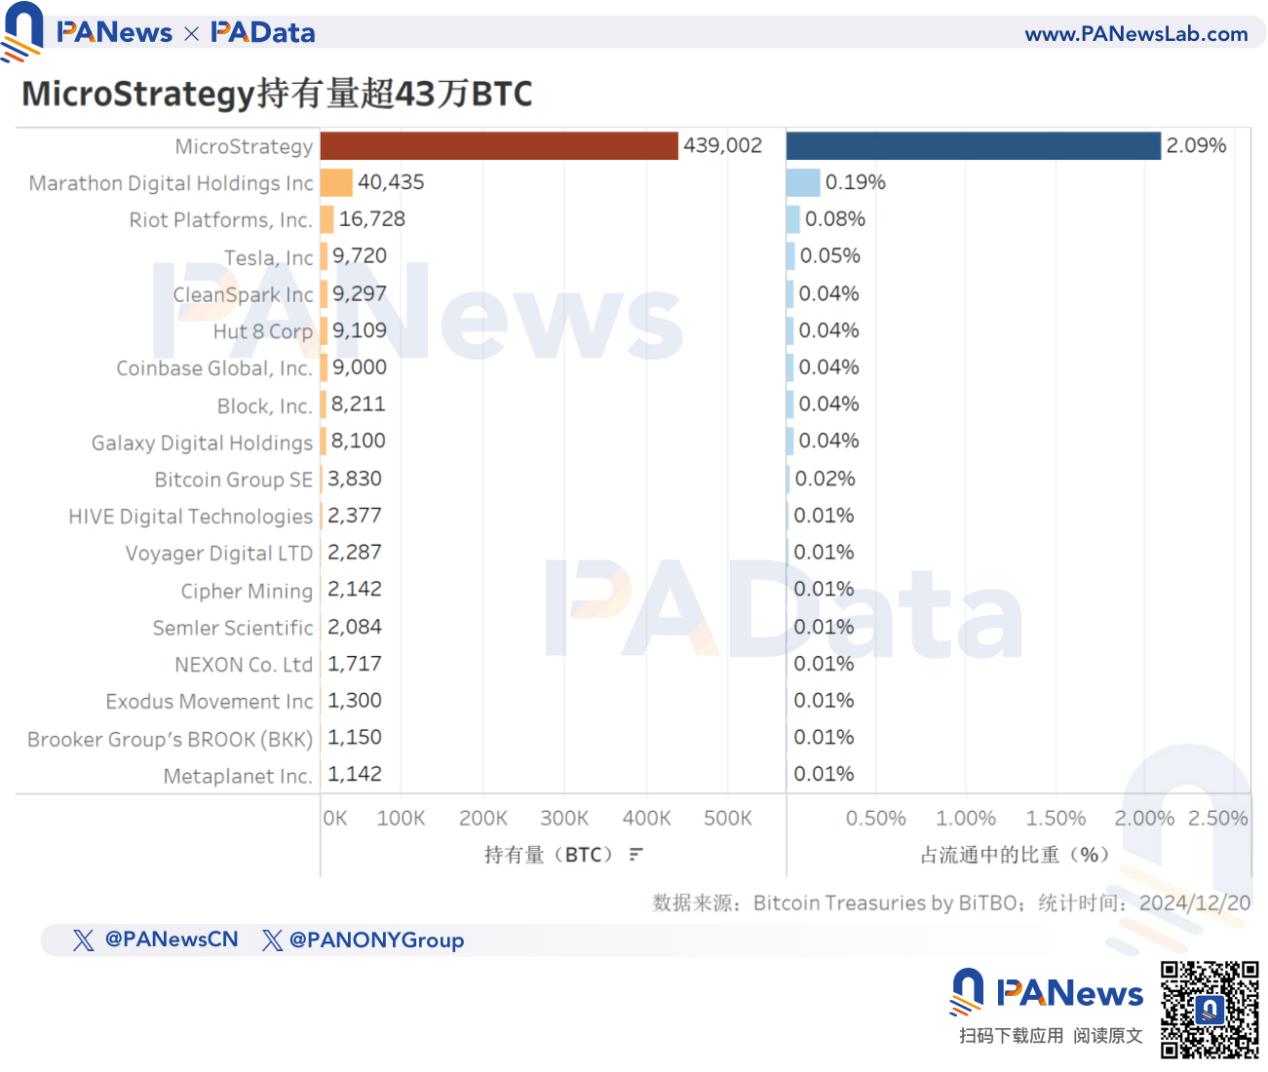
In addition to ETFs, more and more listed companies have also become buyers of Bitcoin, which may bring more possibilities to the market. According to statistics, the company with the largest holdings is currently MicroStrategy, with 439,000 BTC, exceeding the holdings of many ETFs. In addition, the leading companies in the North American Bitcoin mining industry, Marathon Digital Holdings and Riot Platforms, also have relatively large holdings, exceeding 40,000 BTC and 10,000 BTC respectively.
On-chain Fundamentals: Decrease in Active Addresses, Increase in Large Addresses, Transaction Volume Reaches 49.66 Million BTC
The average monthly active addresses on the Bitcoin network this year was about 780,300, a decrease of 17.75% compared to 948,700 in the previous year. Among them, the monthly average active addresses were above 800,000 in January-April and November-December, but below 720,000 in May-October.
Here is the English translation of the text, with the specified terms retained and not translated:Although this is basically consistent with the trend of coin prices, it is worth noting that against the backdrop of Bitcoin prices hitting new highs, the annual average number of active addresses has declined, and the monthly peak number of active addresses has also declined. The changes behind this may mean that in the context of a clear upward trend, the long-term holding strategy is dominant, and the market may shift from the high-frequency trading stage of retail investors to the low-liquidity growth stage dominated by institutional investors.
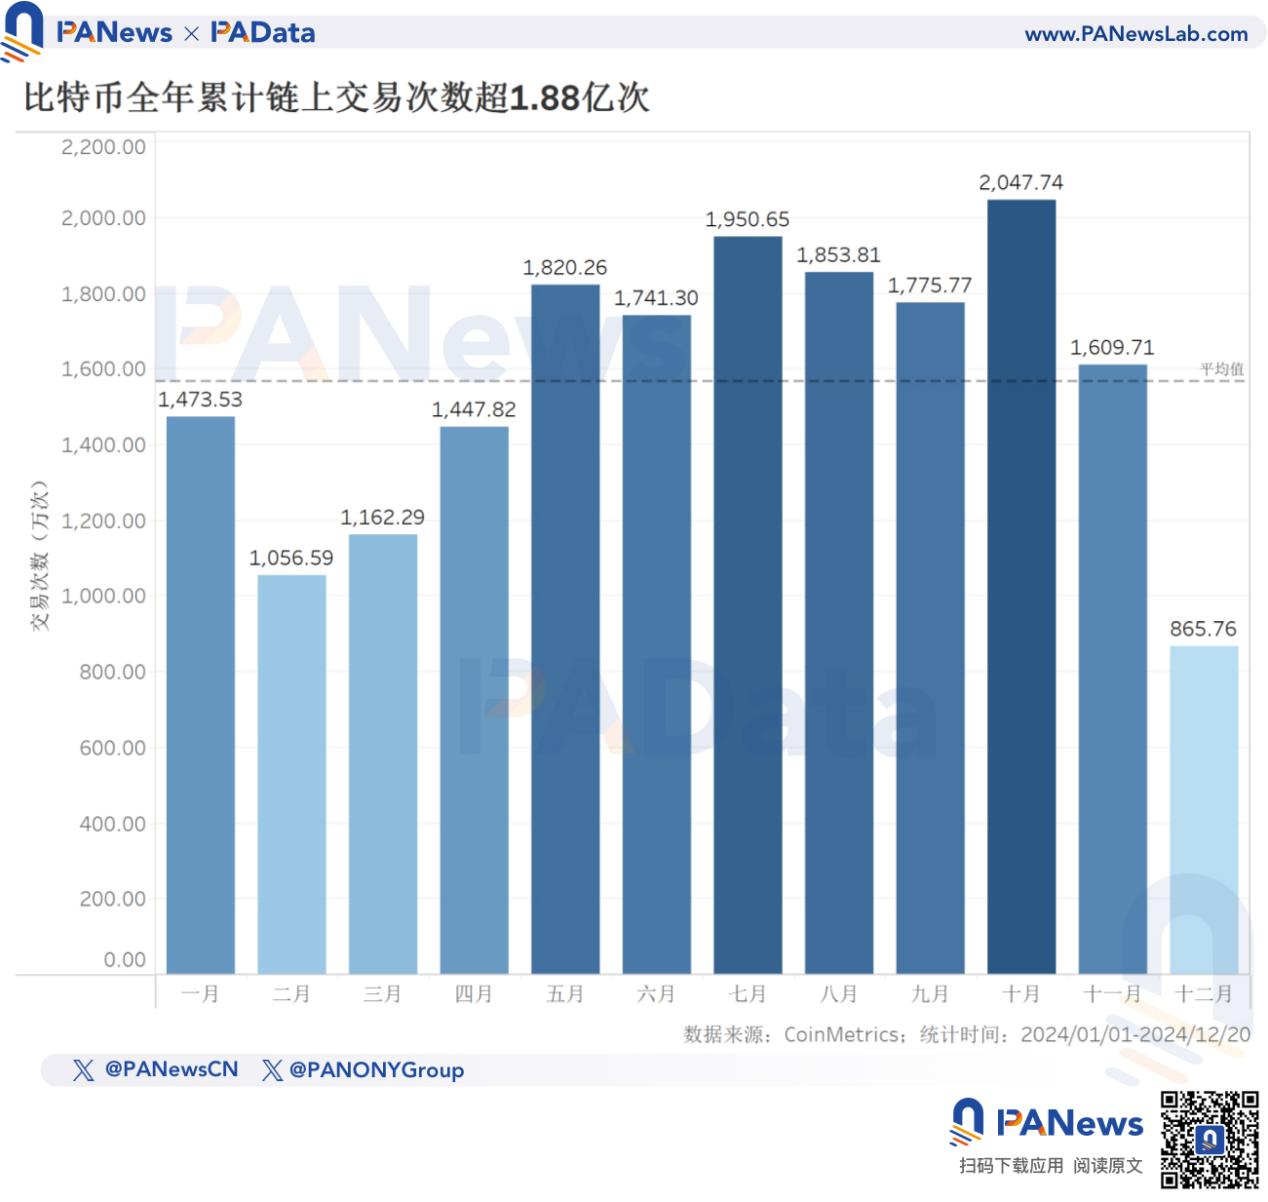
This year, the cumulative on-chain transactions of BTC exceeded 188 million, an increase of about 29.66% compared to last year, with two consecutive years of growth. The monthly average cumulative number of transactions was 15.671 million, with the highest number of transactions in October reaching 20.4774 million. It is worth noting that during the sideways price phase, on-chain transaction volume was actually higher. This may be influenced by many factors, such as short-term arbitrage trading, address reorganization, and contract liquidation.
The total on-chain transaction volume for the year was approximately 49.6658 million BTC, equivalent to $3.28 trillion. The total transaction volume in BTC terms increased slightly by 4.67% compared to last year. The monthly average cumulative transaction volume this year was approximately 4.1388 million BTC, equivalent to about $273.451 billion.
Overall, the relative change trend of the number of transactions and the total transaction volume has continued the differentiation pattern of last year, that is, compared to 2022 and before, the number of BTC transactions has increased, while the total transaction volume has declined. The main reason is the expansion of the application layer under the high coin price environment, such as the outbreak of the Ordinals protocol last year.
From the perspective of the address balance distribution structure, the number of addresses with balances between 0.001 and 0.01 BTC, 0.01 and 0.1 BTC, and 0.1 and 1 BTC is still the largest, currently accounting for 97.24% of the total number of addresses. However, the number of addresses in these three balance ranges has shown a downward trend during the year, decreasing by 3.94%, 2.74%, and 2.62% respectively. Among all balance ranges, only the number of addresses with balances between 100 and 1000 BTC and 1000 and 10000 BTC increased by 11.21% and 1.68% respectively. This means that the trend of address balances becoming smaller in recent years has changed, and this year has shown a trend of larger balances, which may be related to address reorganization and the deployment of institutional capital.
Application Layer: From Ordinals to BTCFi, TVL Surges 2117% Annually
This year, the focus of BTC's application has shifted from Ordinals to BTCFi, further moving from asset issuance to asset usability. According to DeFiLlama's data, the TVL of BTC DeFi has surged from $305 million at the beginning of the year to $6.755 billion at the end of the year, with an annual increase of 2117.11%, and the peak TVL once exceeded $7.3 billion. Currently, BTC has become the fourth-largest blockchain in terms of TVL, only behind Ethereum, Solana, and TRON.
In terms of protocol types, the largest BTC protocol has changed from the payment sector's Lightning Network to the staking sector's Babylon. As of December 20, Babylon's TVL has reached $5.564 billion, accounting for 82.37% of the total. According to Dune (@pyor_xyz) data, as of December 23, Babylon's unique address count has exceeded 140,000, and the staking address growth rate in the last 7 days has reached 100%.
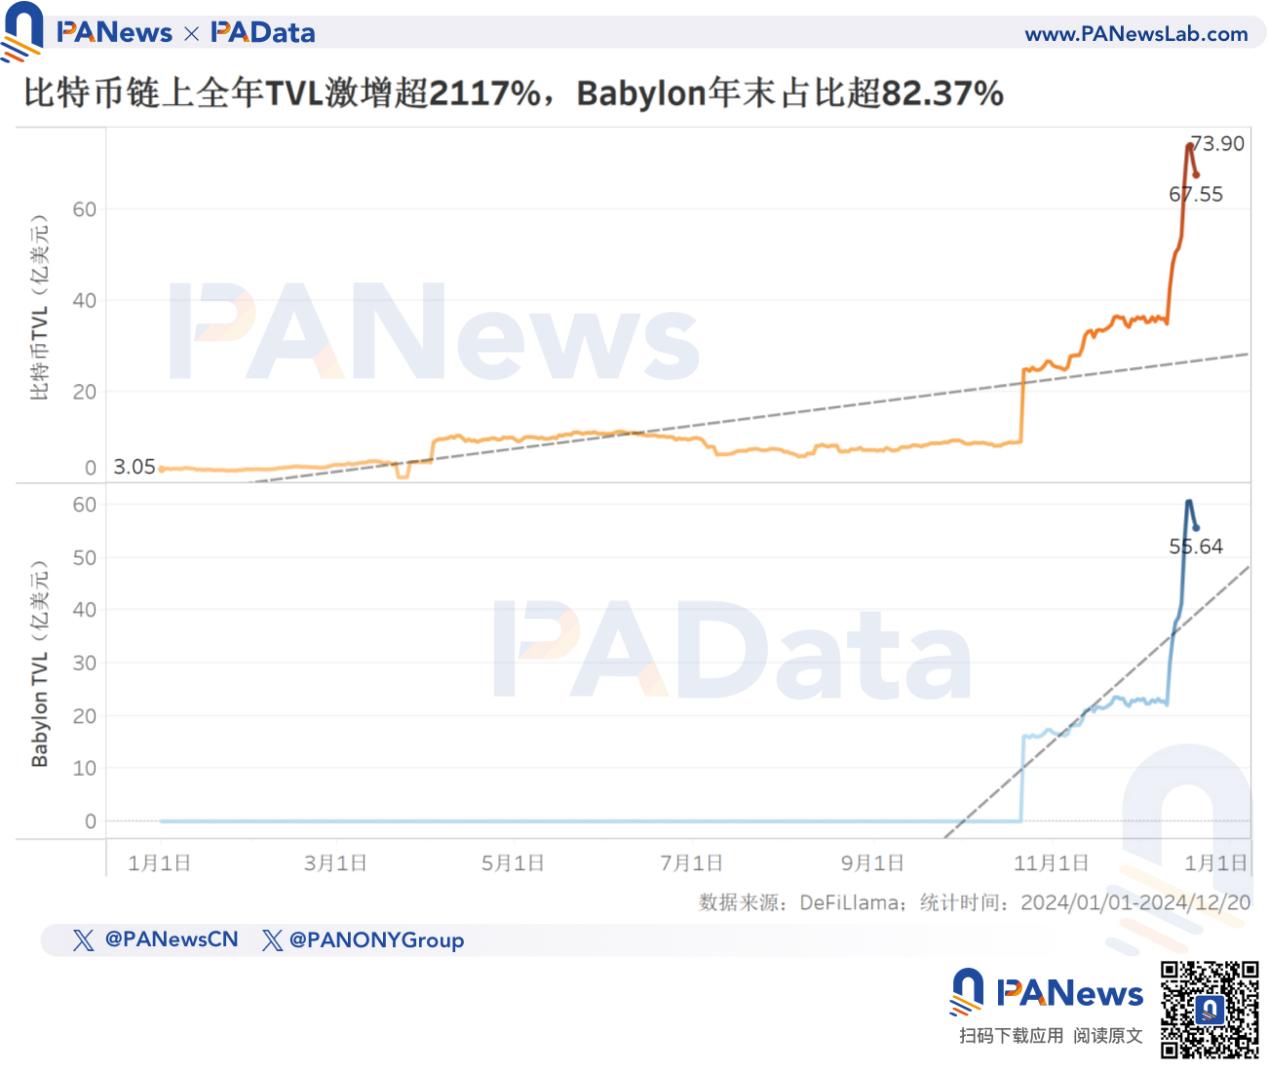
The rapid development of Babylon has driven a series of staking and restaking protocols. Currently, in addition to Babylon, there are 10 other staking protocols on the BTC chain, including Lombard, SolvBTC LSTs, exSat Credit Staking, Chakra, Lorenzo, uniBTC Restaked, alloBTC, pSTAKE BTC, b14g, and LISA BTC LST. These staking protocols may bring network effects to BTC's applications and further promote its application expansion.
Outlook for Next Year
BTC has already seen sufficient upside this year. Looking ahead to 2025, BTC may enter a period of adjustment at the beginning of the year, and its subsequent performance will continue to be influenced by the macroeconomic environment, regulatory environment, and industry development, with volatility also containing opportunities.
From the perspective of the macroeconomic environment, the Fed turned hawkish on rate cuts at the end of this year, and more importantly, the quantitative tightening (QT) policy backdrop remains unchanged, which means that under the goal of controlling inflation, long-term liquidity will still tend to tighten, and short-term liquidity growth may also slow down. Therefore, BTC will face certain pressure to continue its upward trend next year.
However, from the price trend of BTC this year, its sensitivity to changes in the regulatory environment is higher. The result of the US presidential election directly stimulated BTC prices to break through $100,000, and if there is greater relaxation in regulatory policies next year, it may provide momentum for BTC to continue its upward trend.
From the perspective of industry development, the rapid rise of BTCFi has pushed BTC into a new stage of asset application, and staking protocols and other protocols may promote the network effects of these assets, which will further provide value support for BTC's prices. However, if BTC's price is highly influenced by its application, this will be a new upward logic for BTC, different from the scarcity of supply or digital gold, and this has very high requirements for the scale of applications, which may be difficult to achieve in the short term.


