The price of Stellar (XLM) has fallen by 10% over the past 7 days. Current momentum indicators such as RSI are showing a sharp decline, suggesting increased selling pressure and the possibility of approaching oversold conditions.
The Ichimoku Cloud chart indicates that XLM is trading below the cloud, reinforcing the bearish outlook. There are no immediate reversal signals. Traders are closely watching the $0.351 support level. If this level is not maintained, further declines may occur, while a successful rebound could open the door to a recovery above $0.40.
Stellar RSI Neutral... Bearish Trend
The Stellar Relative Strength Index (RSI) is currently at 39.9. This is a sharp decline from above 60 on December 24th. This significant drop indicates a rapid loss of buying momentum, suggesting the market is shifting to a bearish trend.
The move from the previous strong neutral range to the lower RSI area implies increased selling pressure. XLM is nearing oversold territory, but has not yet fully entered that zone.
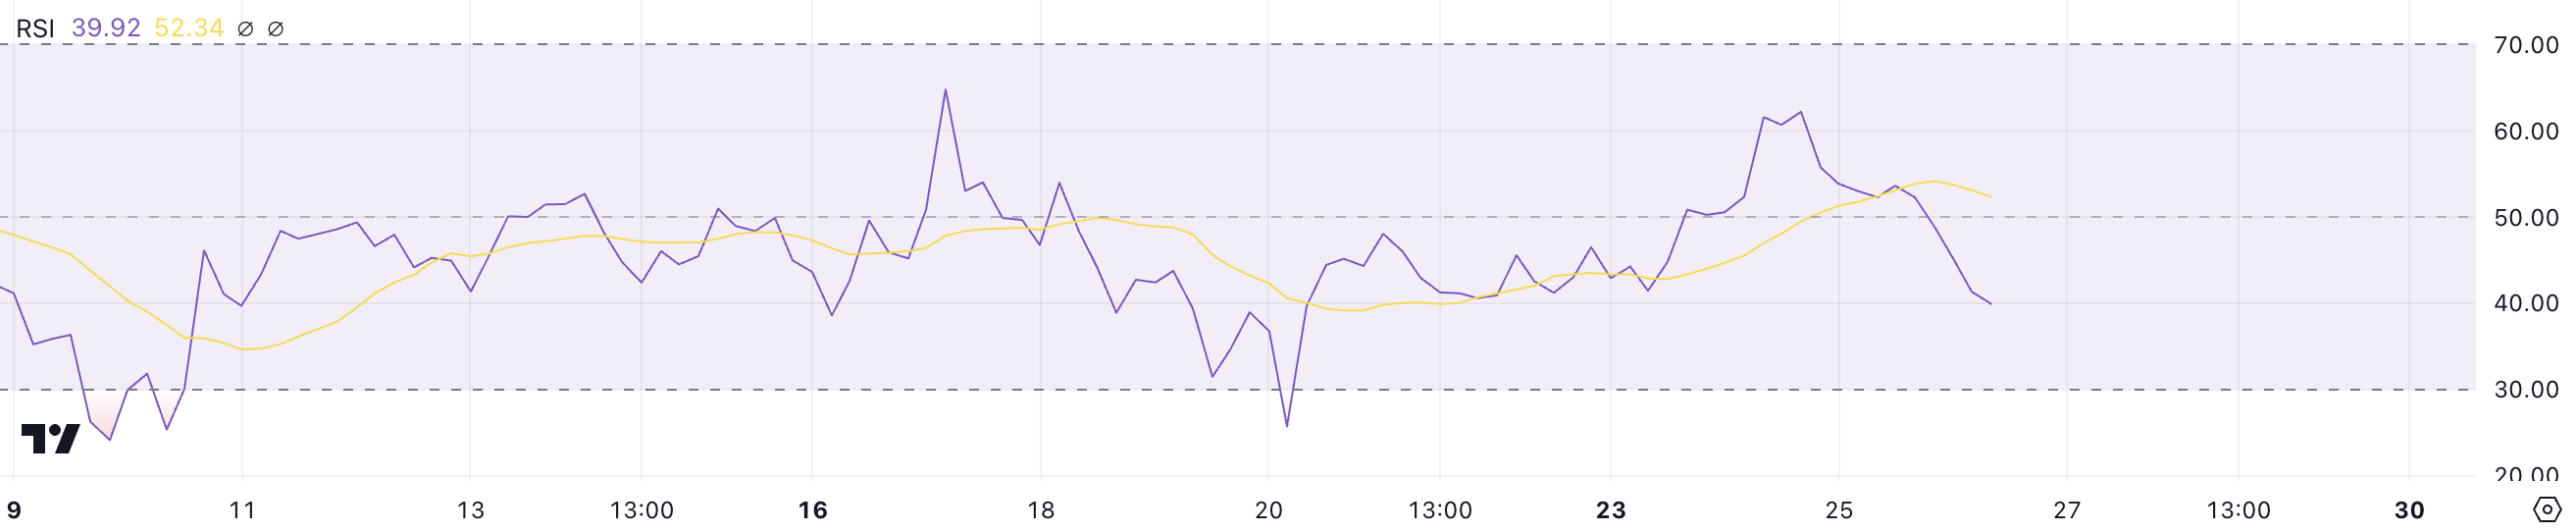
RSI is a momentum indicator that measures the speed and magnitude of price changes on a scale of 0 to 100. Readings above 70 often indicate overbought conditions before a price correction, while values below 30 suggest oversold conditions and a potential rebound.
The rapid decline of the XLM RSI to 39.9 suggests the coin is on the edge of bearish momentum. This implies a higher possibility of further declines in the short term. If selling pressure continues, the price of XLM may test lower levels. However, if buyers stabilize the market, a potential rebound could prevent further losses.
XLM Ichimoku Cloud Strongly Bearish
The Ichimoku Cloud chart for XLM indicates a bearish outlook. The current price is trading below the cloud (red and green shaded areas), suggesting bearish momentum.
The blue conversion line (Tenkan-sen) being below the red base line (Kijun-sen) further confirms the bearish trend and suggests that sellers are dominating the market. Additionally, the recent attempts to break above the cloud have failed, reinforcing the strength of the downtrend.
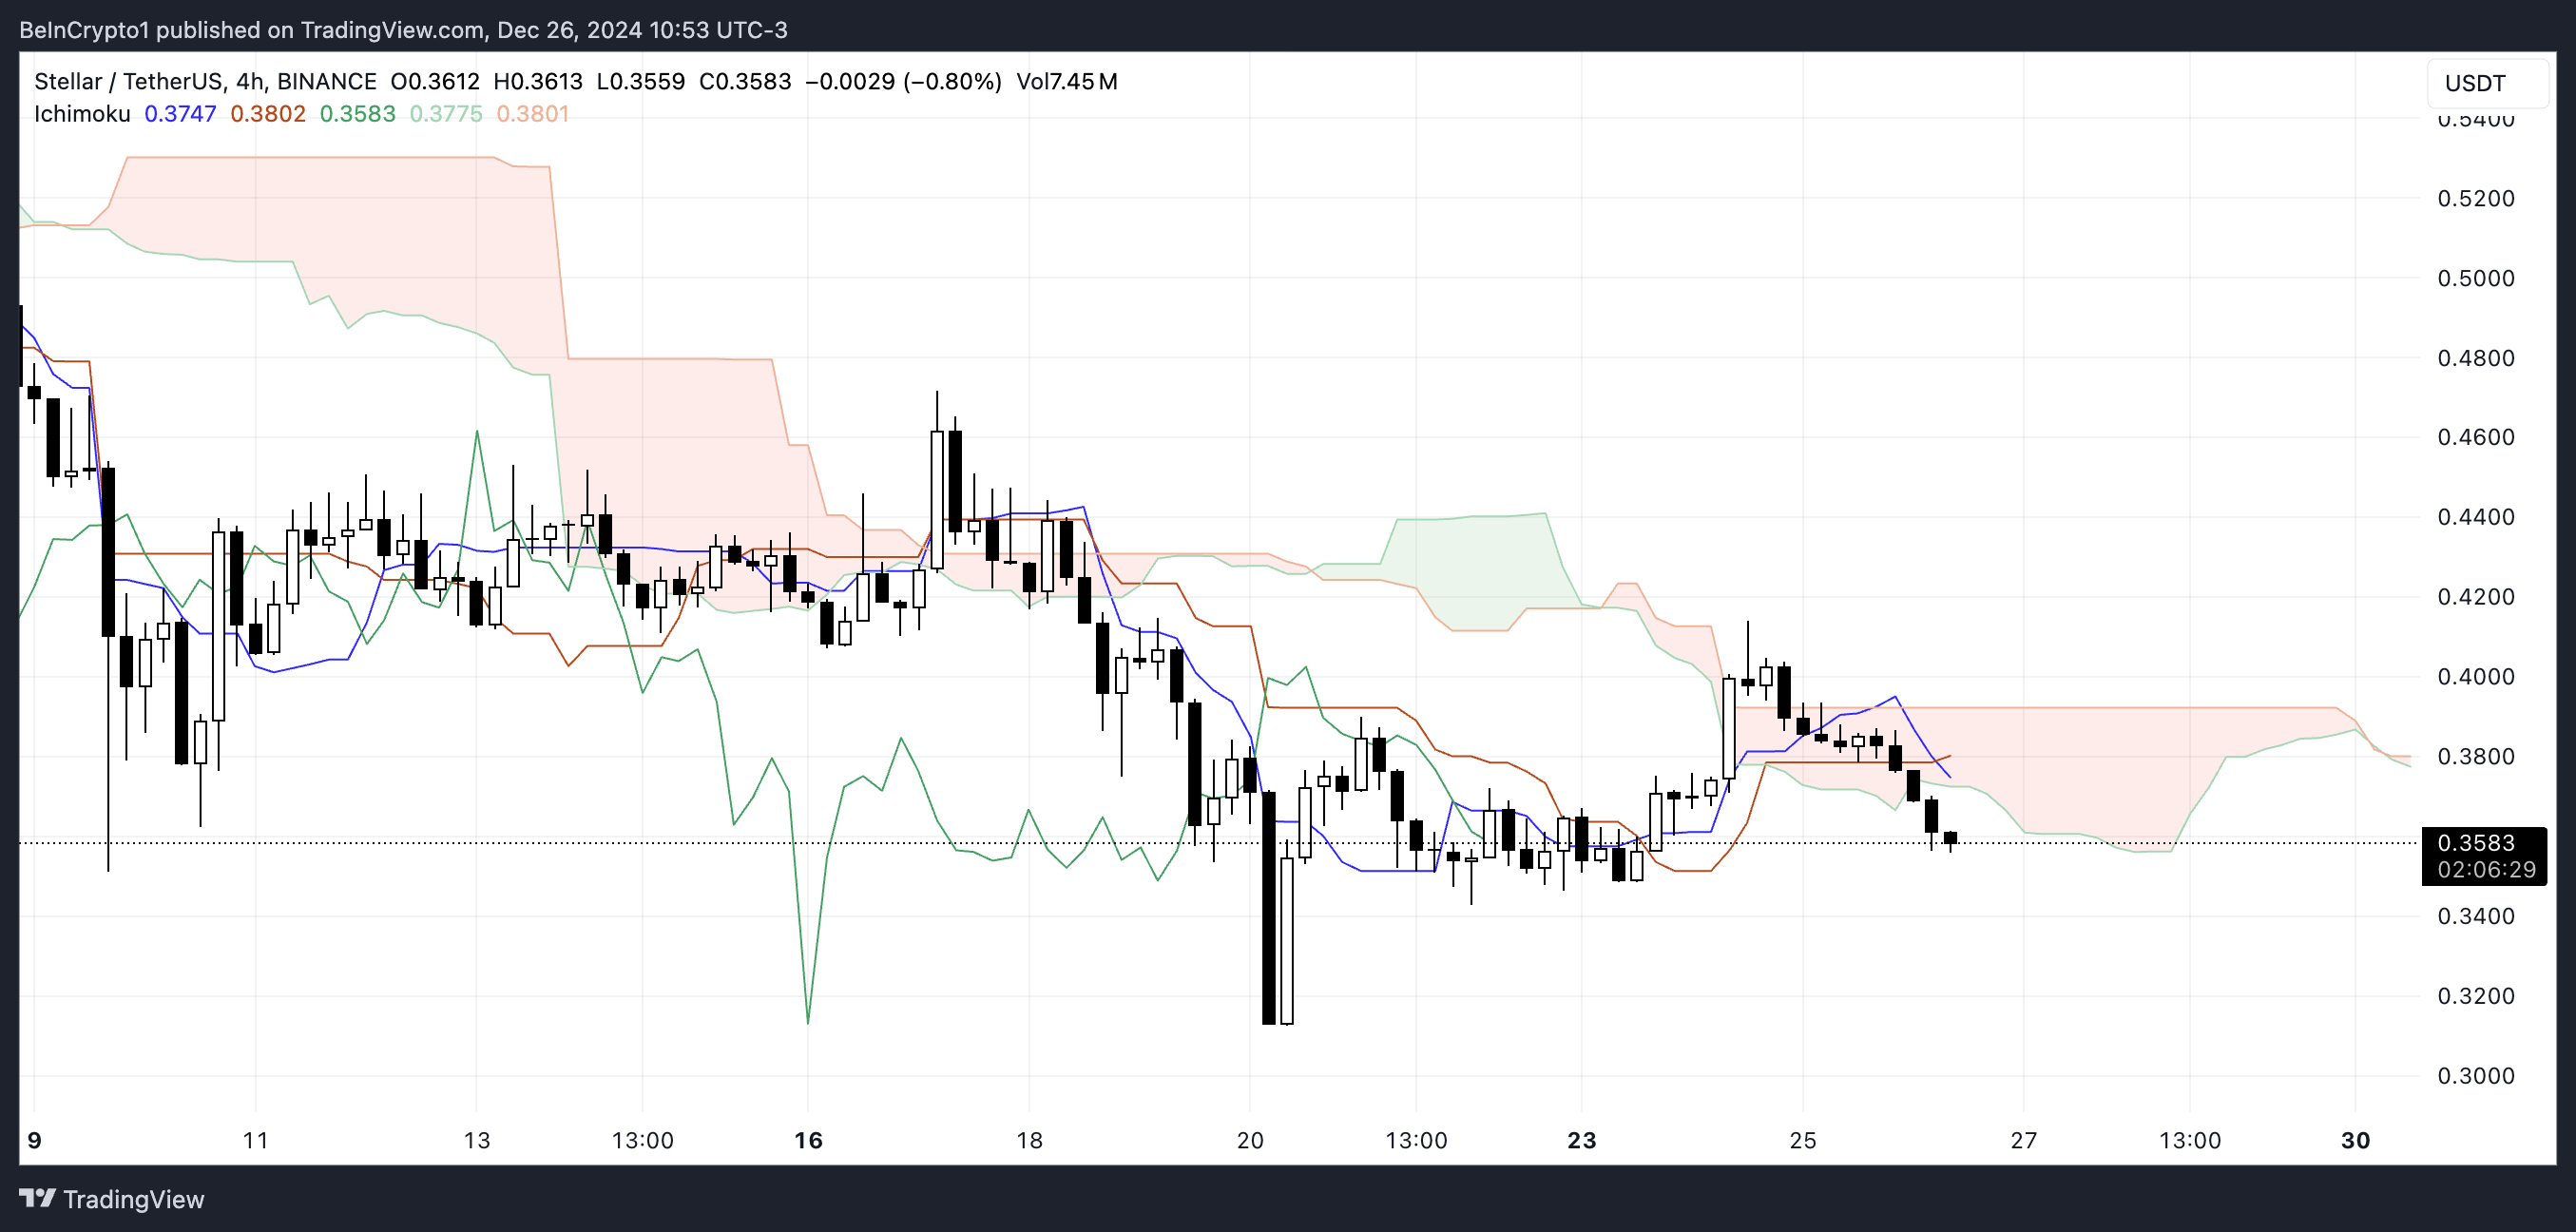
The lagging span (green line) being below the price and the cloud emphasizes the persistent downward pressure.
The future cloud (red) with the leading span A (green edge) remaining below the leading span B (red edge) suggests that the bearish trend is likely to continue in the short term. These indicators suggest that the XLM price is likely to face pressure, and there are limited signs of an immediate reversal unless there is a significant change in momentum.
XLM Price Prediction: Will the $0.351 Support Hold?
The Stellar price is currently trading near the crucial $0.351 support level.
If this support is not maintained, the XLM price may face additional downward pressure and could potentially decline to $0.31.
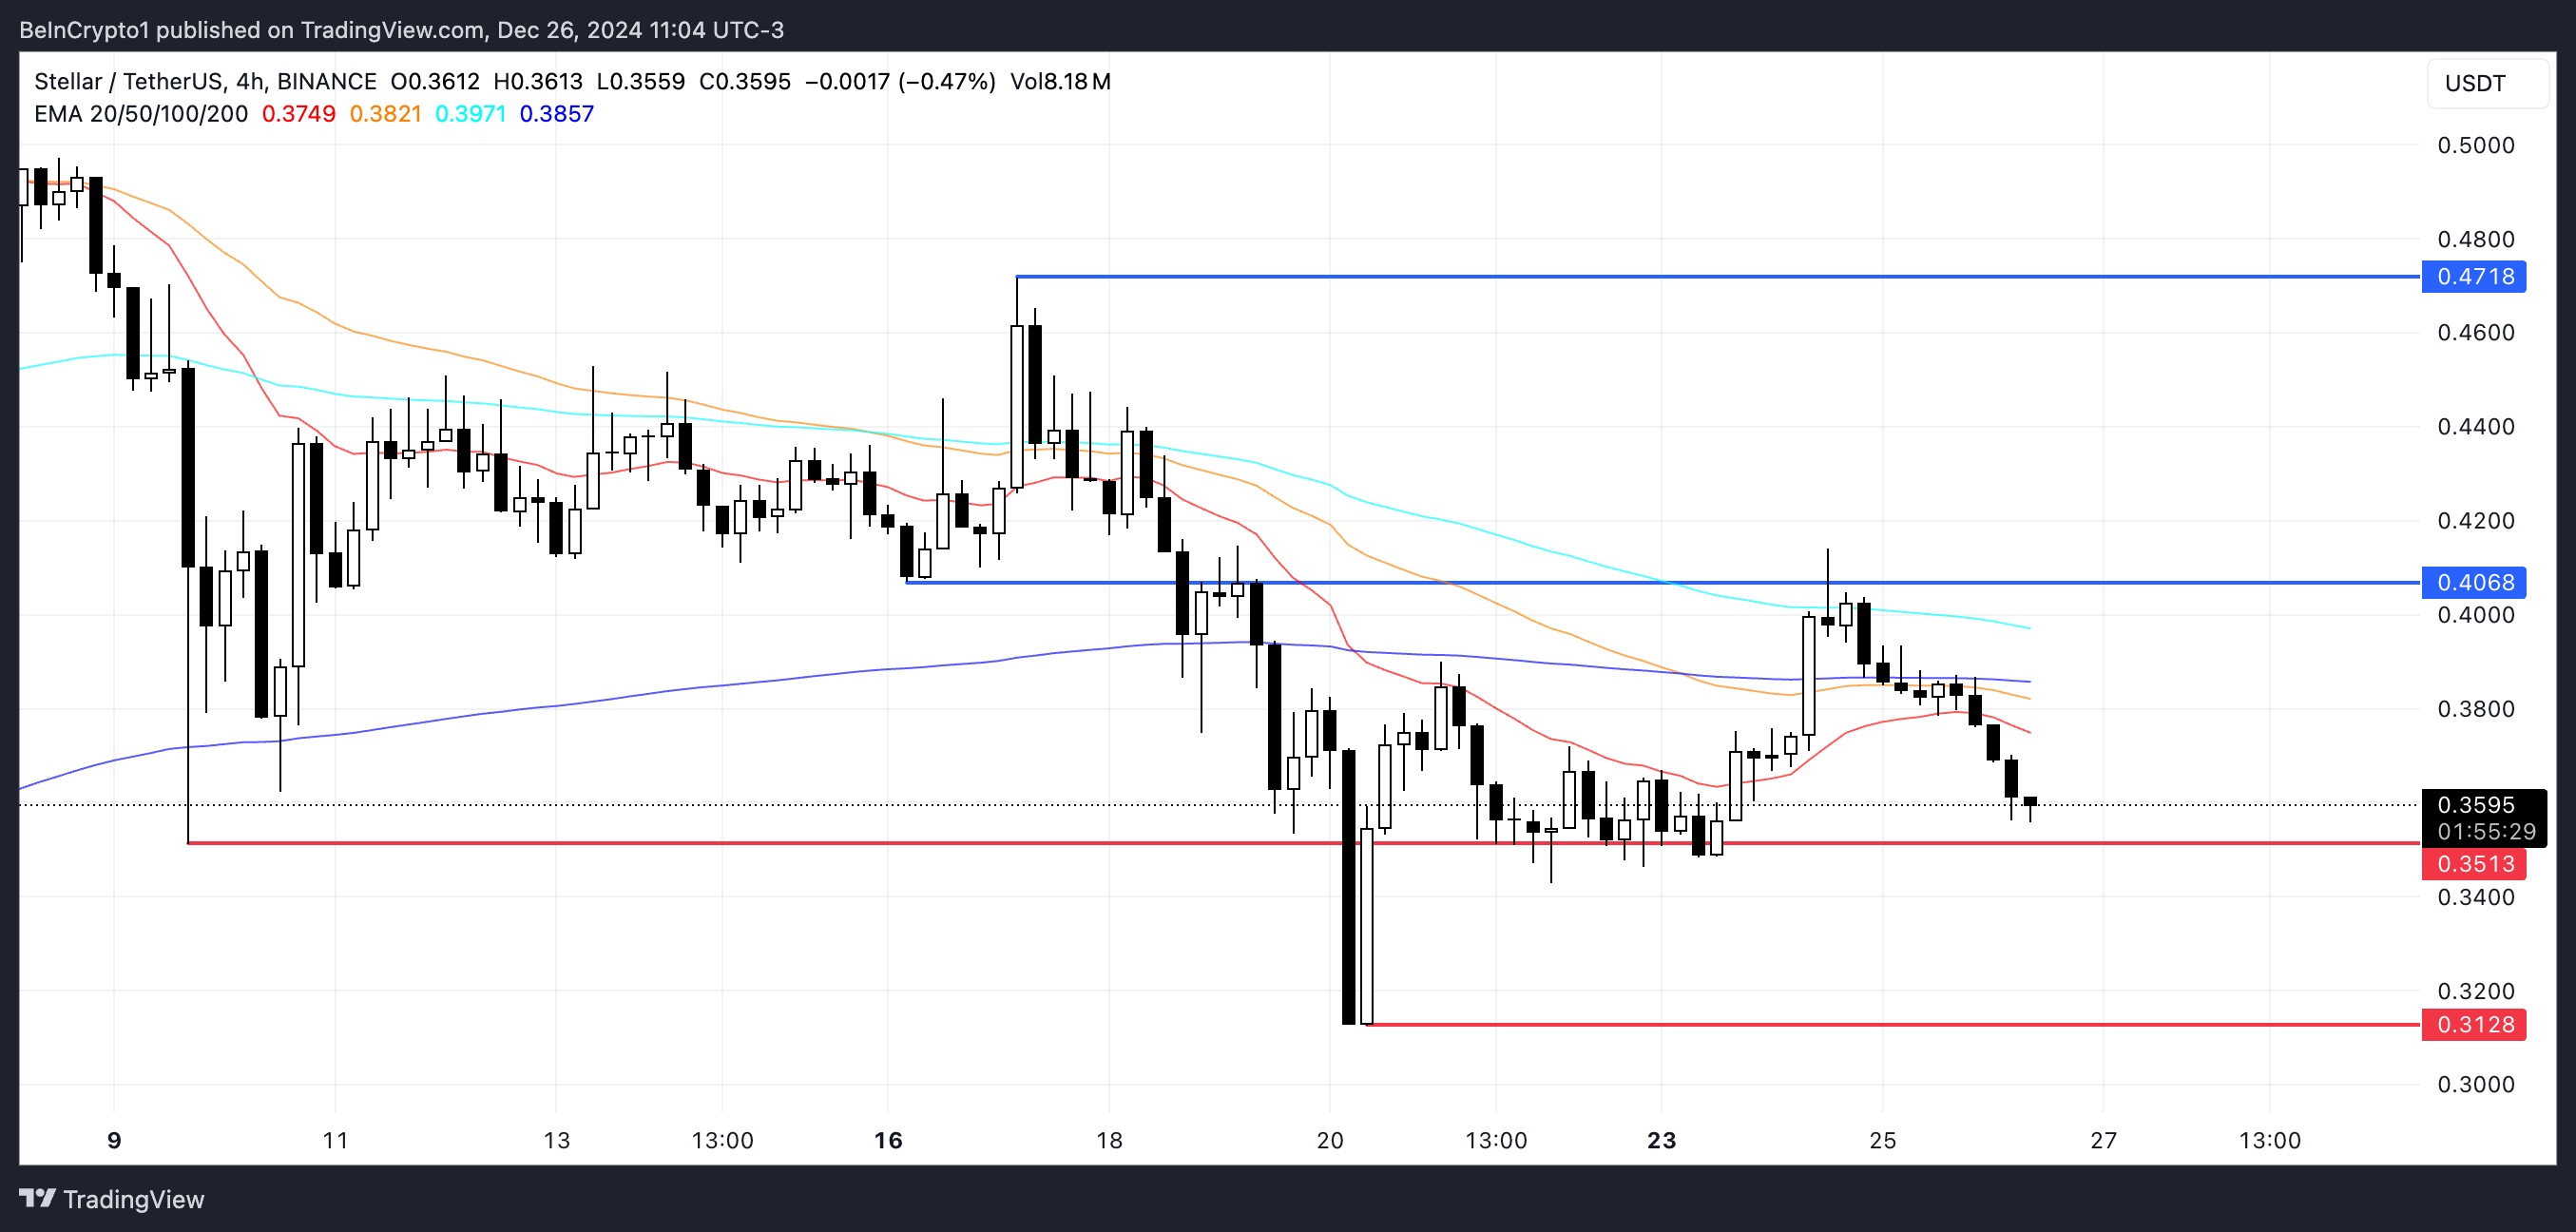
However, if XLM can hold above the $0.351 support and rebound, it could regain upward momentum and test the $0.40 resistance.
A successful break above this resistance could open the door for XLM to further rise and test the next crucial level at $0.47.