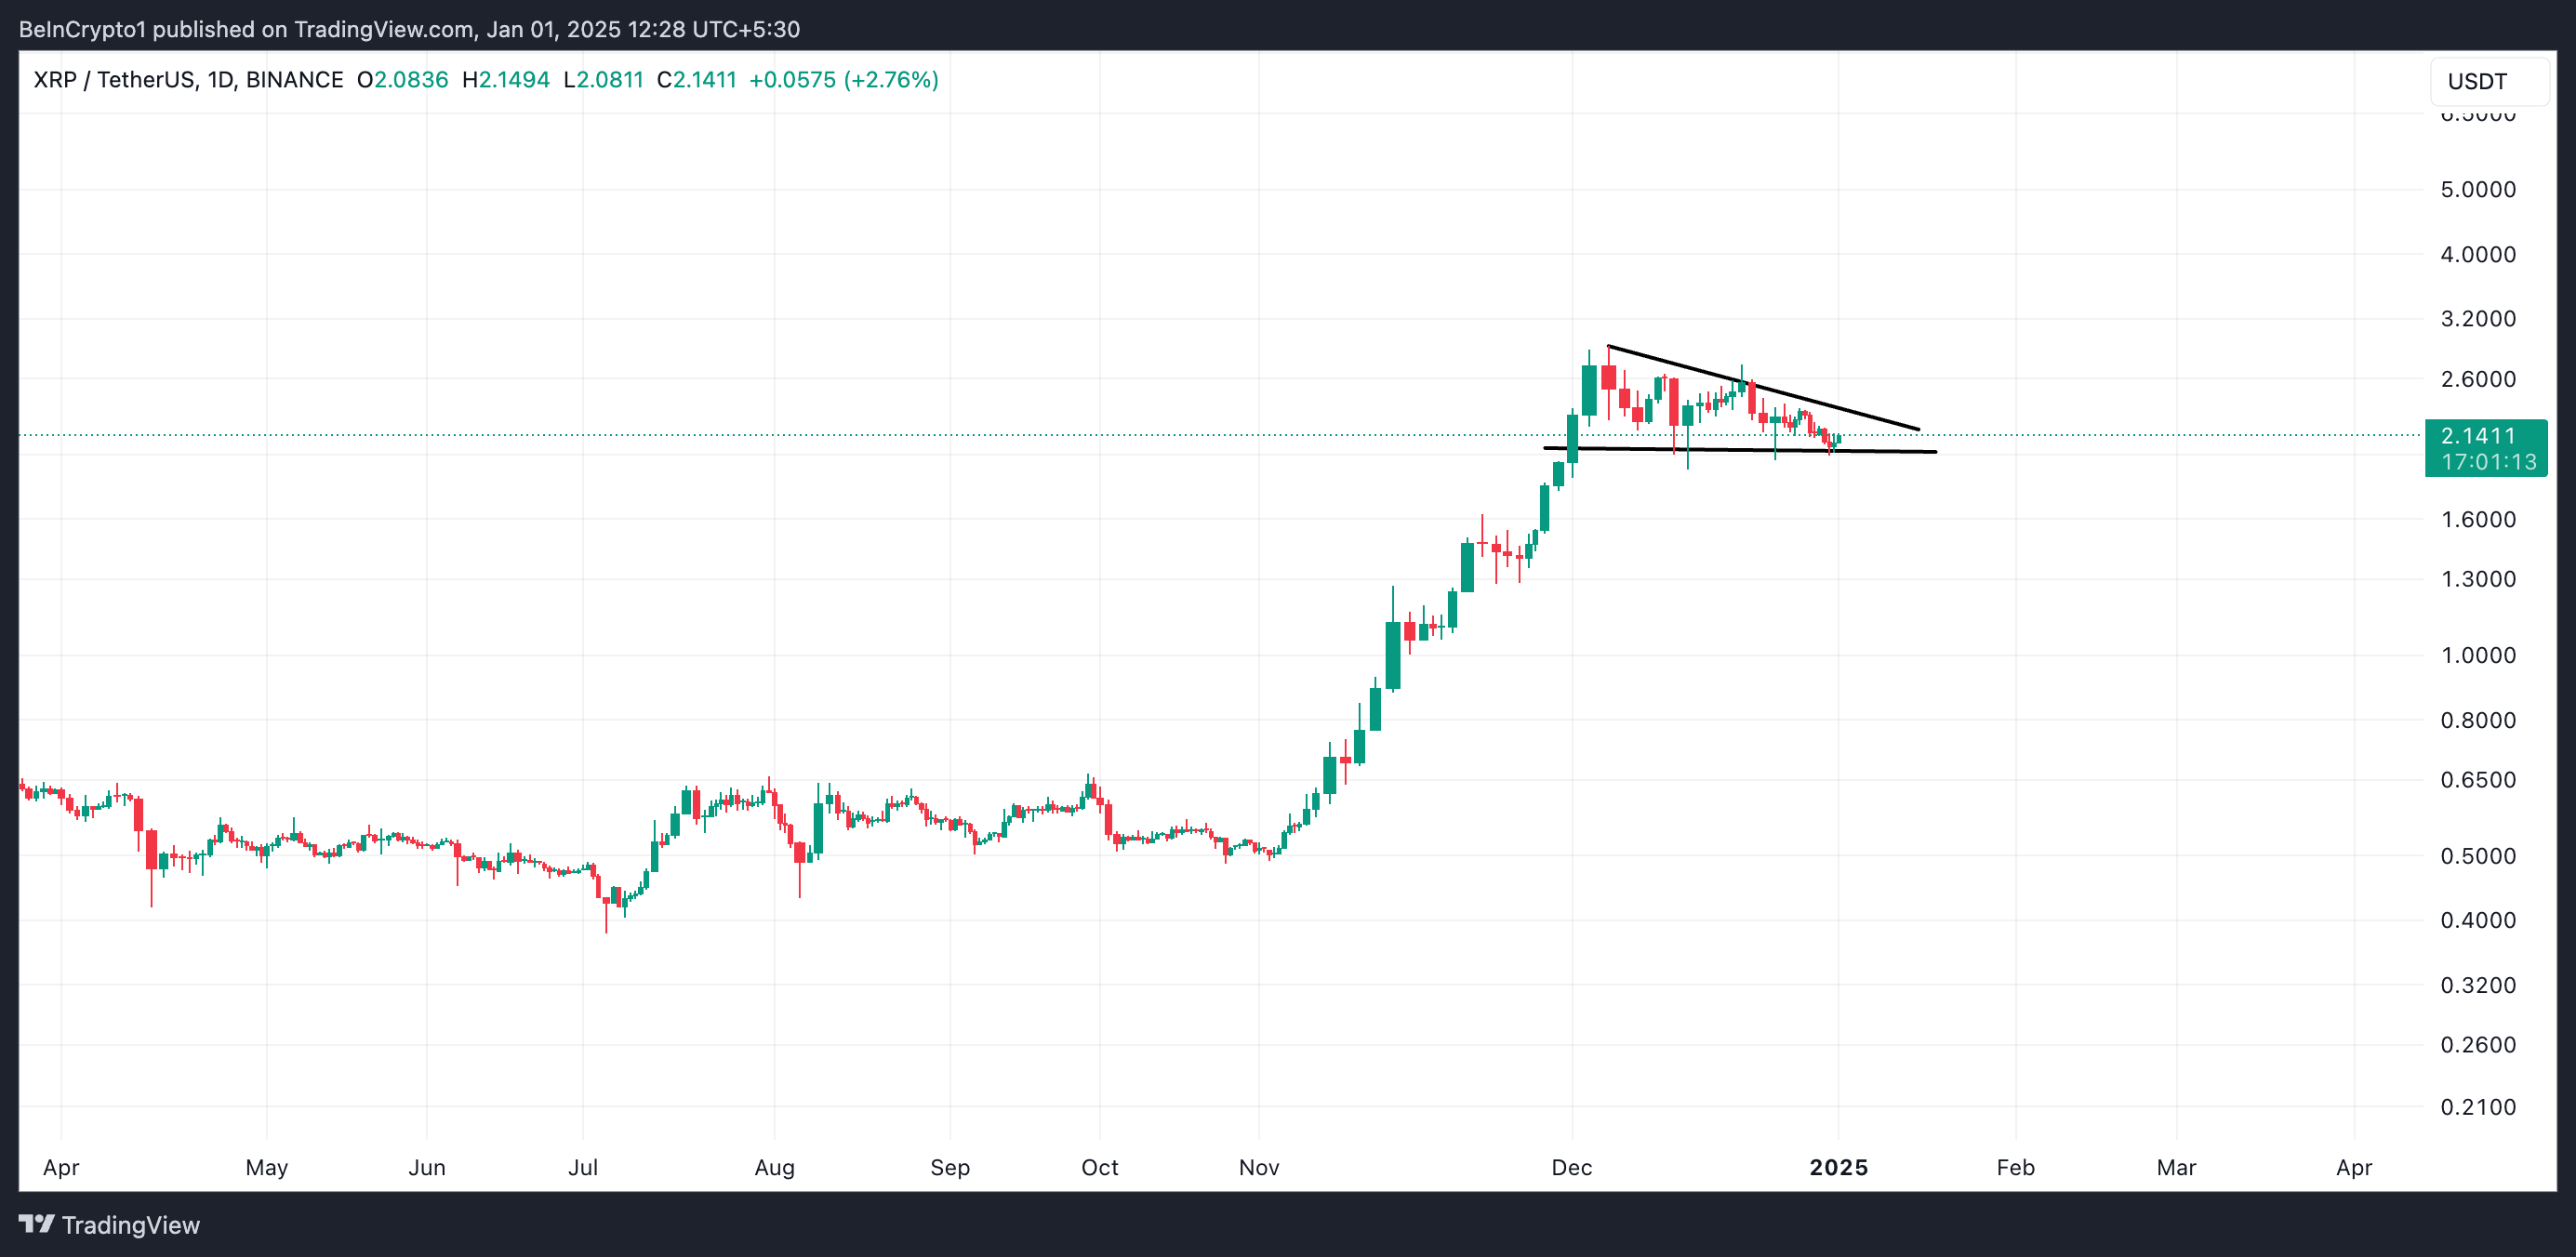
XRP by Ripple has surged about 500% from November 6 to December 3, but the price has since fallen sharply in recent weeks. After reaching a multi-year high of $2.90 on December 3, this altcoin has been in a downtrend.
As the bearish momentum strengthens, this cryptocurrency may dip below the $2 support level in the short term. This analysis explains why.
XRP Sees Surge in Selling Pressure
According to the XRP/USD chart analysis, after peaking at $2.90 on December 3, this cryptocurrency has been trapped in a bearish technical pattern known as a descending triangle.
This pattern occurs when an asset's price maintains a horizontal support level while creating a series of lower highs. This indicates that selling pressure is increasing, and a potential bearish breakout is signaled if the price breaches the support line.

In the case of XRP, this support is forming at the crucial $2 price level. However, as the selling pressure intensifies, defending this price range may become difficult. One of the reasons is the recent decline in XRP whale accumulation.
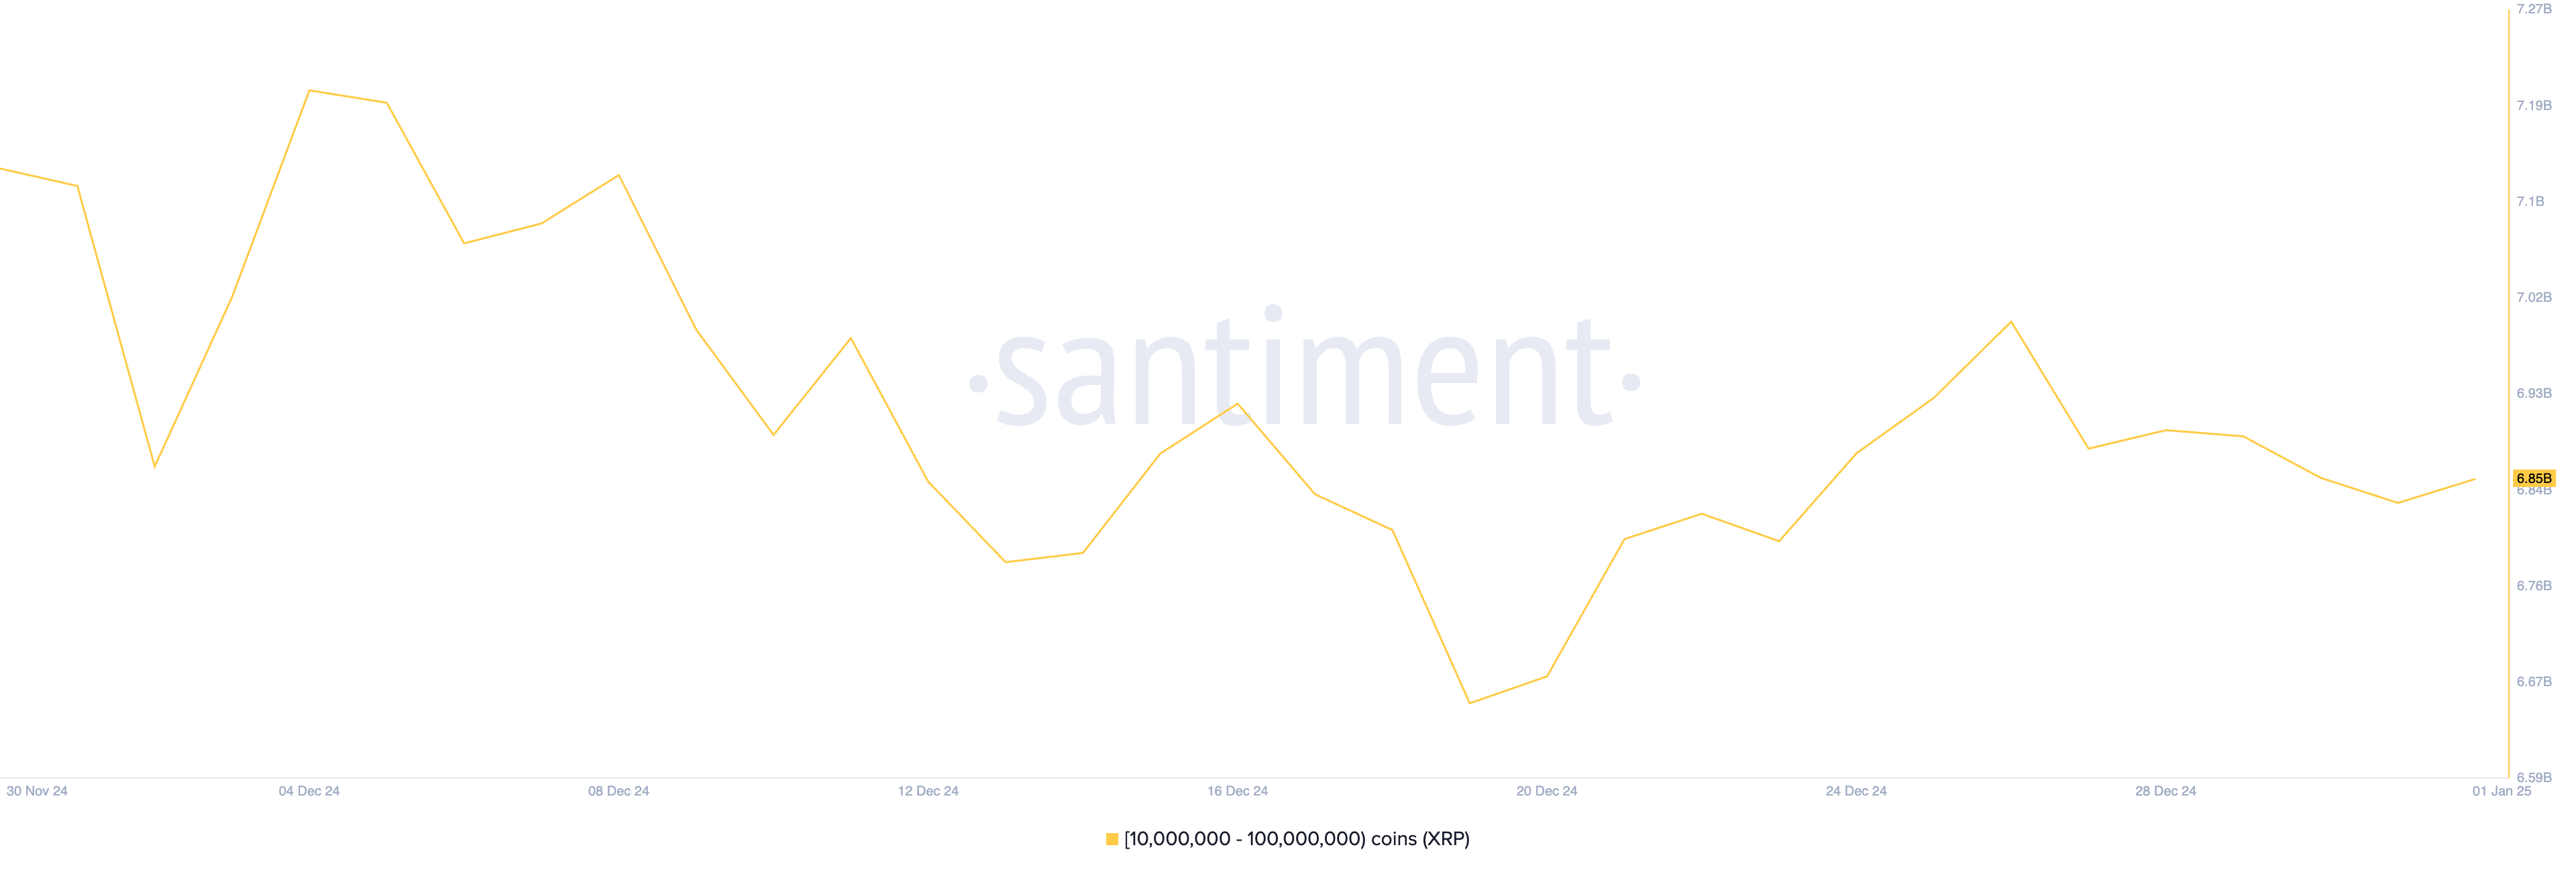
According to the cryptocurrency online data platform Santiment, XRP whales holding between 10 million and 100 million tokens have reduced their holdings by 350 million XRP since December 4. This means that this group of XRP investors has sold tokens worth approximately $74.6 million during the review period, adding to the downward price pressure.

The decrease in whale accumulation is concerning. These large holders often provide stability to the market by holding substantial amounts of tokens. Their selling activity can instill fear among smaller investors, exacerbating the price decline and increasing market volatility.
XRP Price Prediction: Selling Pressure Intensifies, Potential Dip Below $2
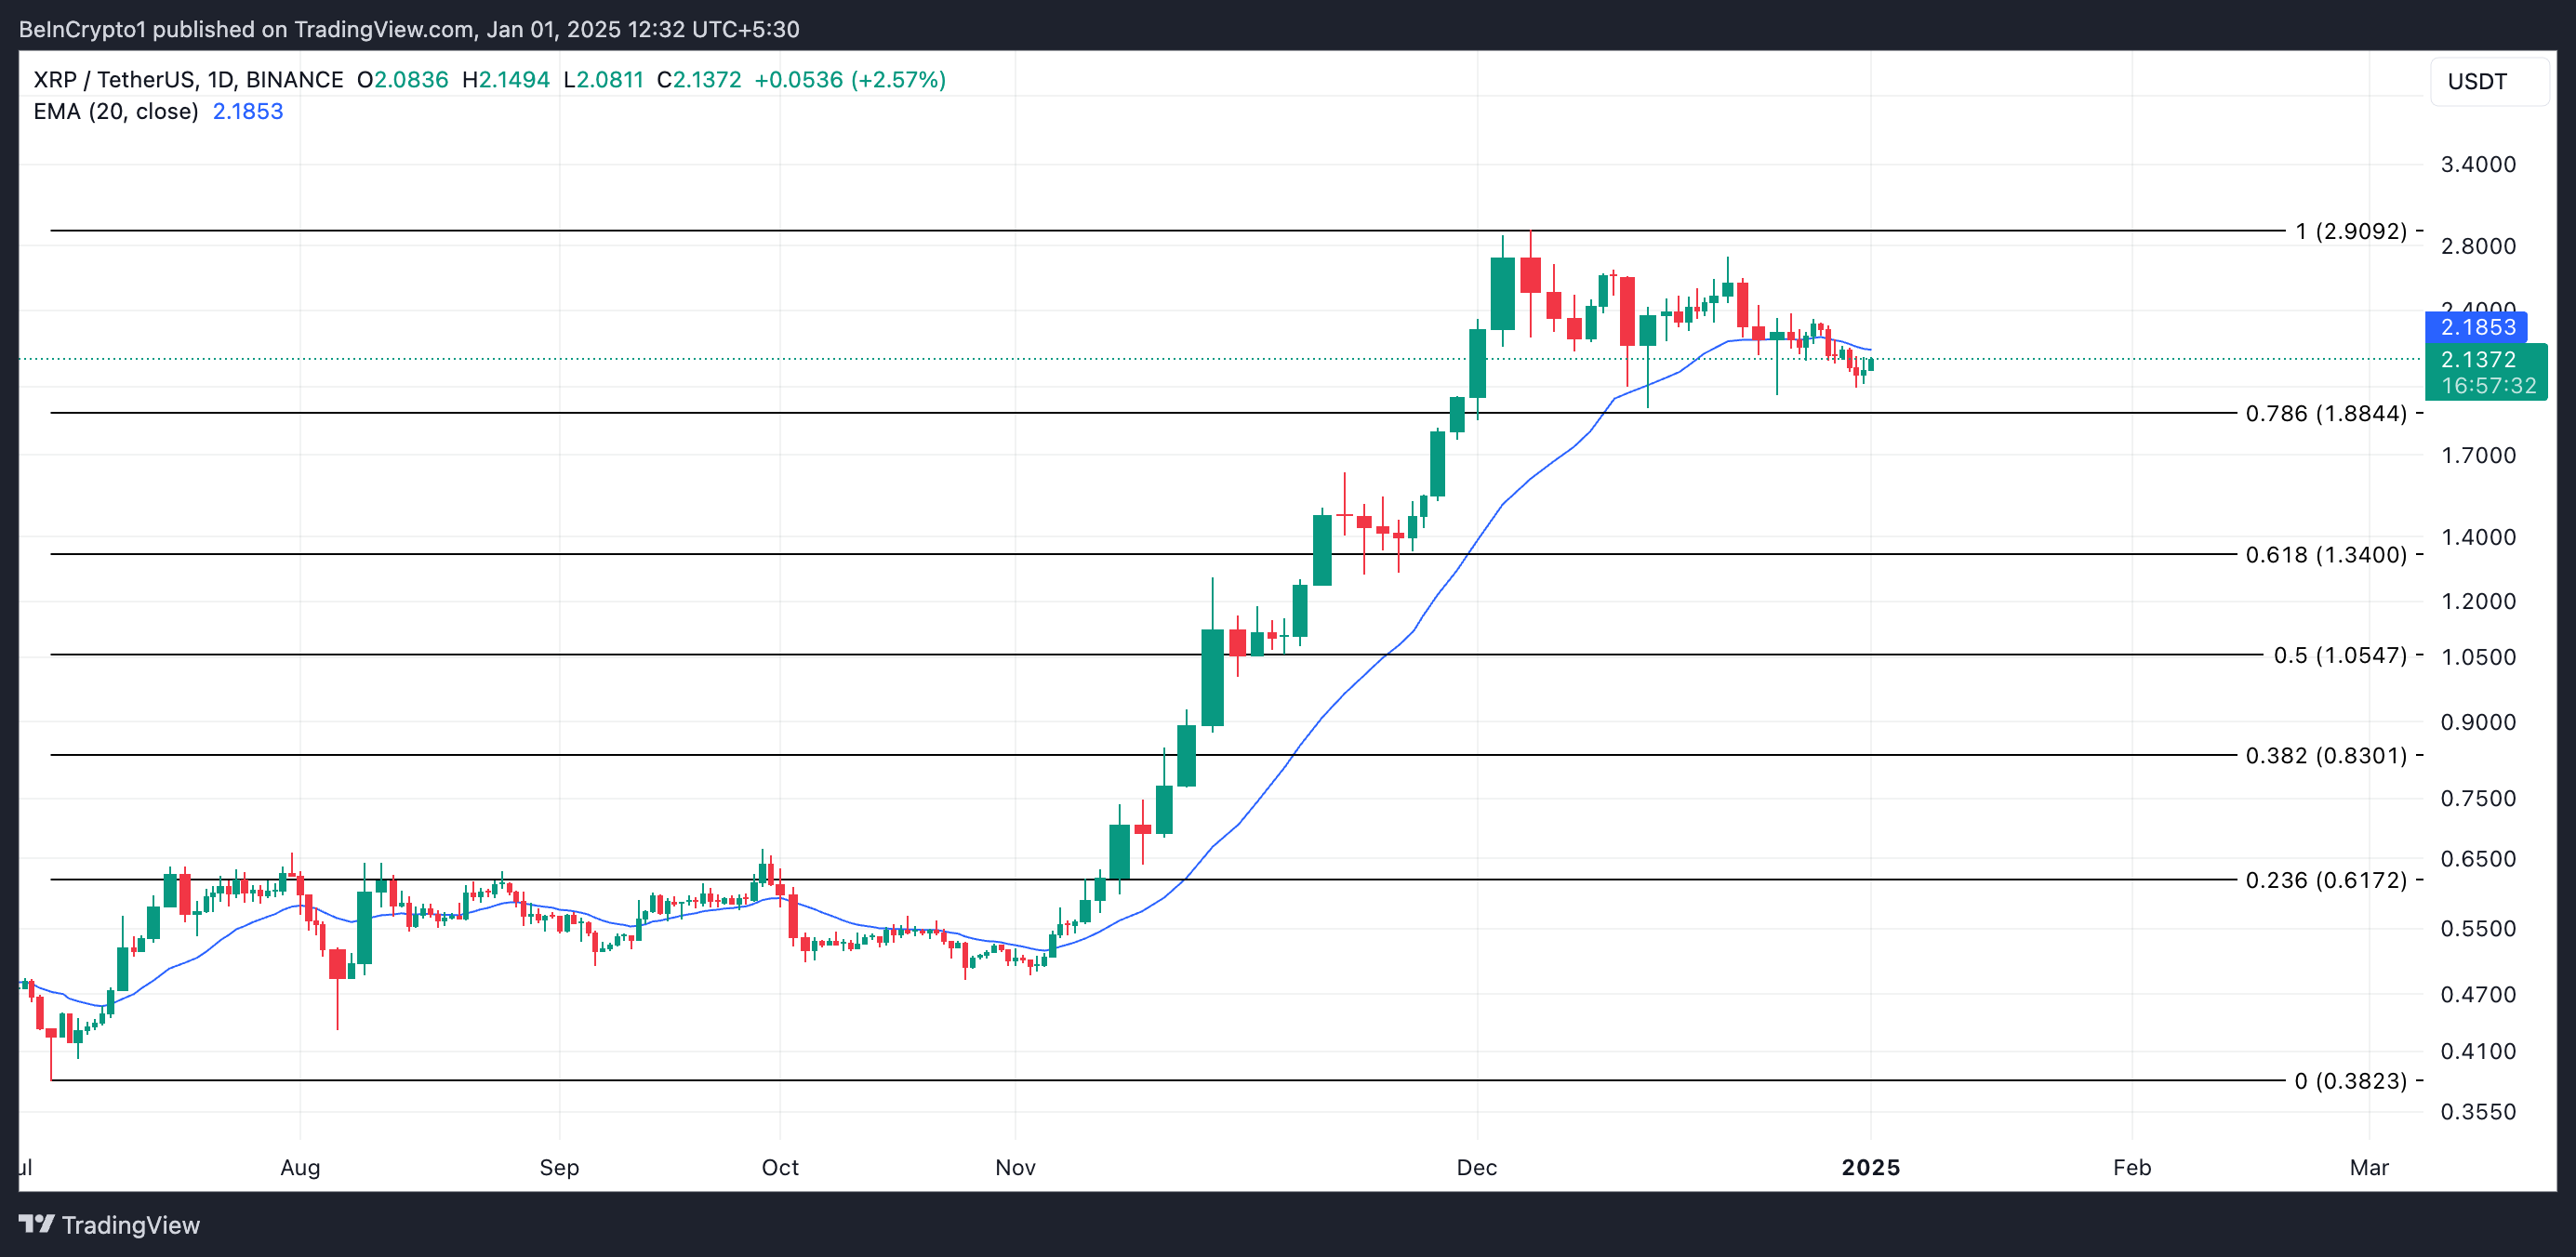
On the daily chart, XRP is currently trading below the 20-day Exponential Moving Average (EMA). This gives more weight to recent prices, better capturing the short-term trend.
When an asset's price falls below this key moving average, it confirms bearish sentiment and indicates a downtrend or an increase in short-term selling pressure.
If the selling pressure intensifies, the XRP token price may dip below the $2 support line provided by the descending triangle's lower trendline. In this case, the token's price could plummet to $1.88. If this level is not maintained, XRP's price could further decline to $1.34.

Conversely, if the sentiment shifts from bearish to bullish, XRP's price will rise above the 20-day EMA. This would provide a dynamic resistance or barrier at $2.18. If this level is successfully breached, the XRP token price could surge to the multi-year high of $2.90.


