

The price of Solana broke through the psychological barrier of $200 during intraday trading on January 2nd. In this extended rally, the Pump.fun platform is moving a significant amount of SOL tokens to Kraken.
Inflows to the exchange generally indicate bearish sentiment due to selling pressure, but the strong bullish momentum in Solana's rally is resisting this general trend.
Solana, Bullish Momentum After Large Deposits
Pump.fun executed two significant deposits to Kraken on January 1st. According to Solscan data, the first transfer was made at 4:37 PM UTC with 22.8 million dollars worth of SOL, and the second deposit was made at 5:45 PM with 32.7 million dollars. Additionally, on-chain data shows that on January 2nd, a Solana-based platform designed for the easy creation and trading of meme coins deposited 63,171 SOL ($13.11 million) to Kraken.
Generally, a sharp increase in inflows of an asset to exchanges is a bearish signal and often a precursor to price declines. However, SOL has shown a surge in demand to absorb this supply influx. As a result, the price has maintained an upward trend since January 1st.
In fact, during the trading session on January 2nd, SOL broke out of the descending parallel channel it had been trading in since November 23rd. This channel is composed of two downward-sloping parallel trendlines that form when an asset's price is in a downtrend.
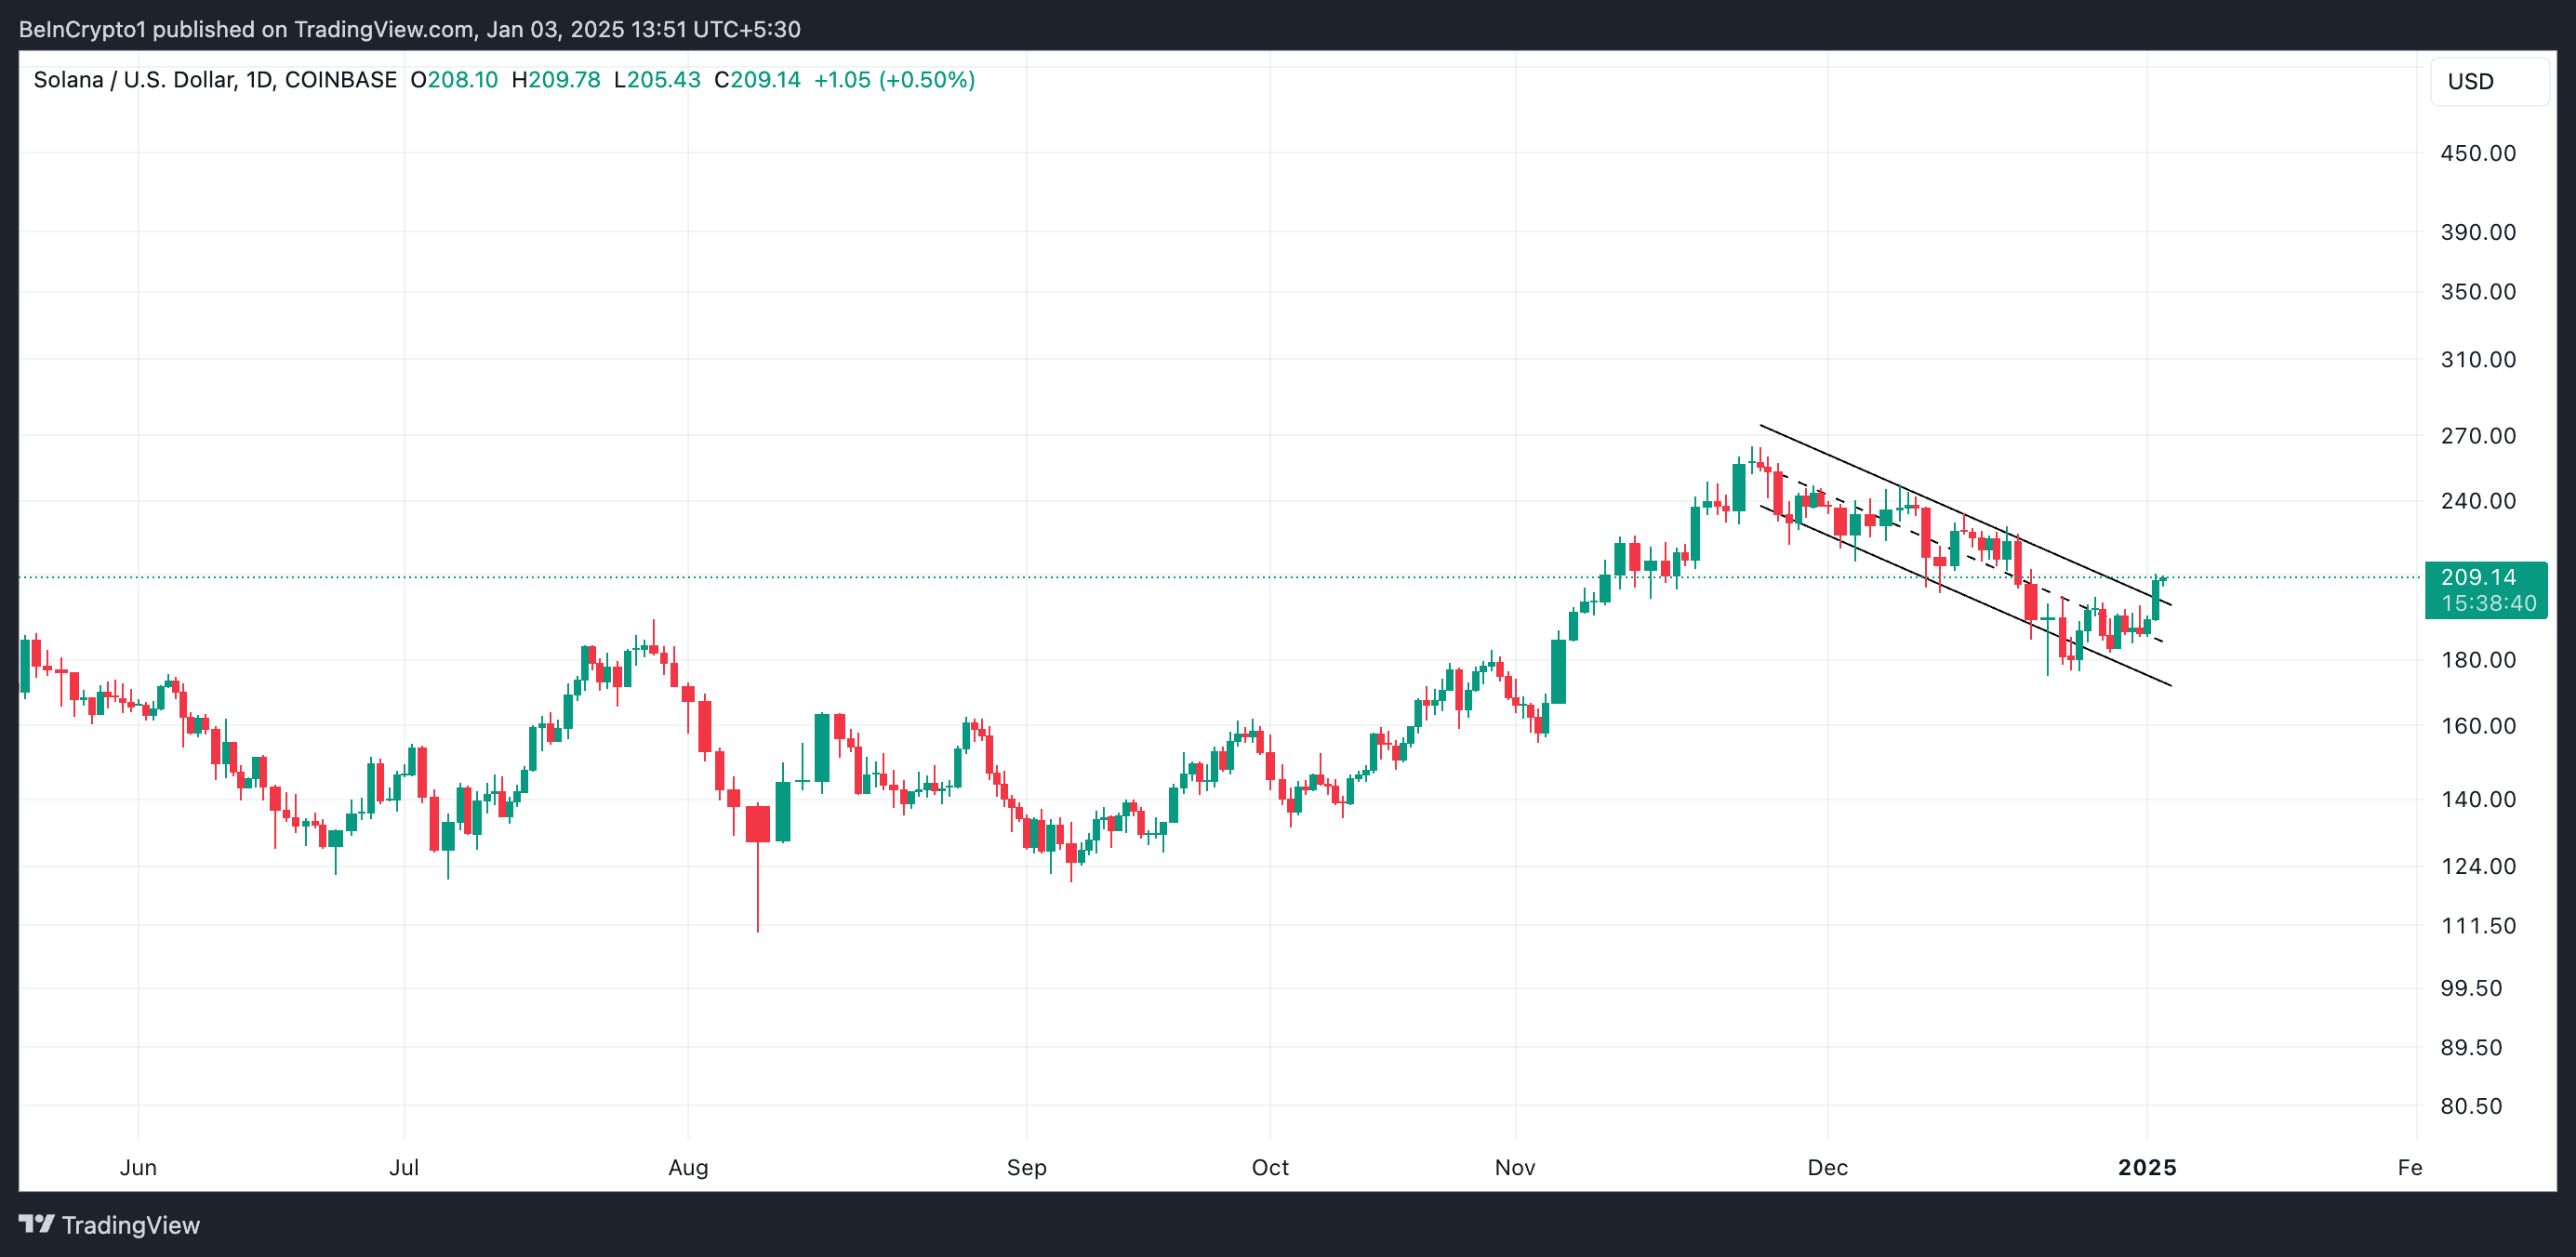
When an asset's price breaks above the upper boundary of the channel, it signals a potential reversal into bullish momentum and suggests the asset may experience an upward price movement.
Furthermore, the price of SOL has also broken above the 20-day Exponential Moving Average (EMA), confirming increased demand for altcoins. The 20-day EMA measures the average price of the asset over the past 20 trading days, placing more weight on recent prices and being more sensitive to recent price movements than a simple moving average.
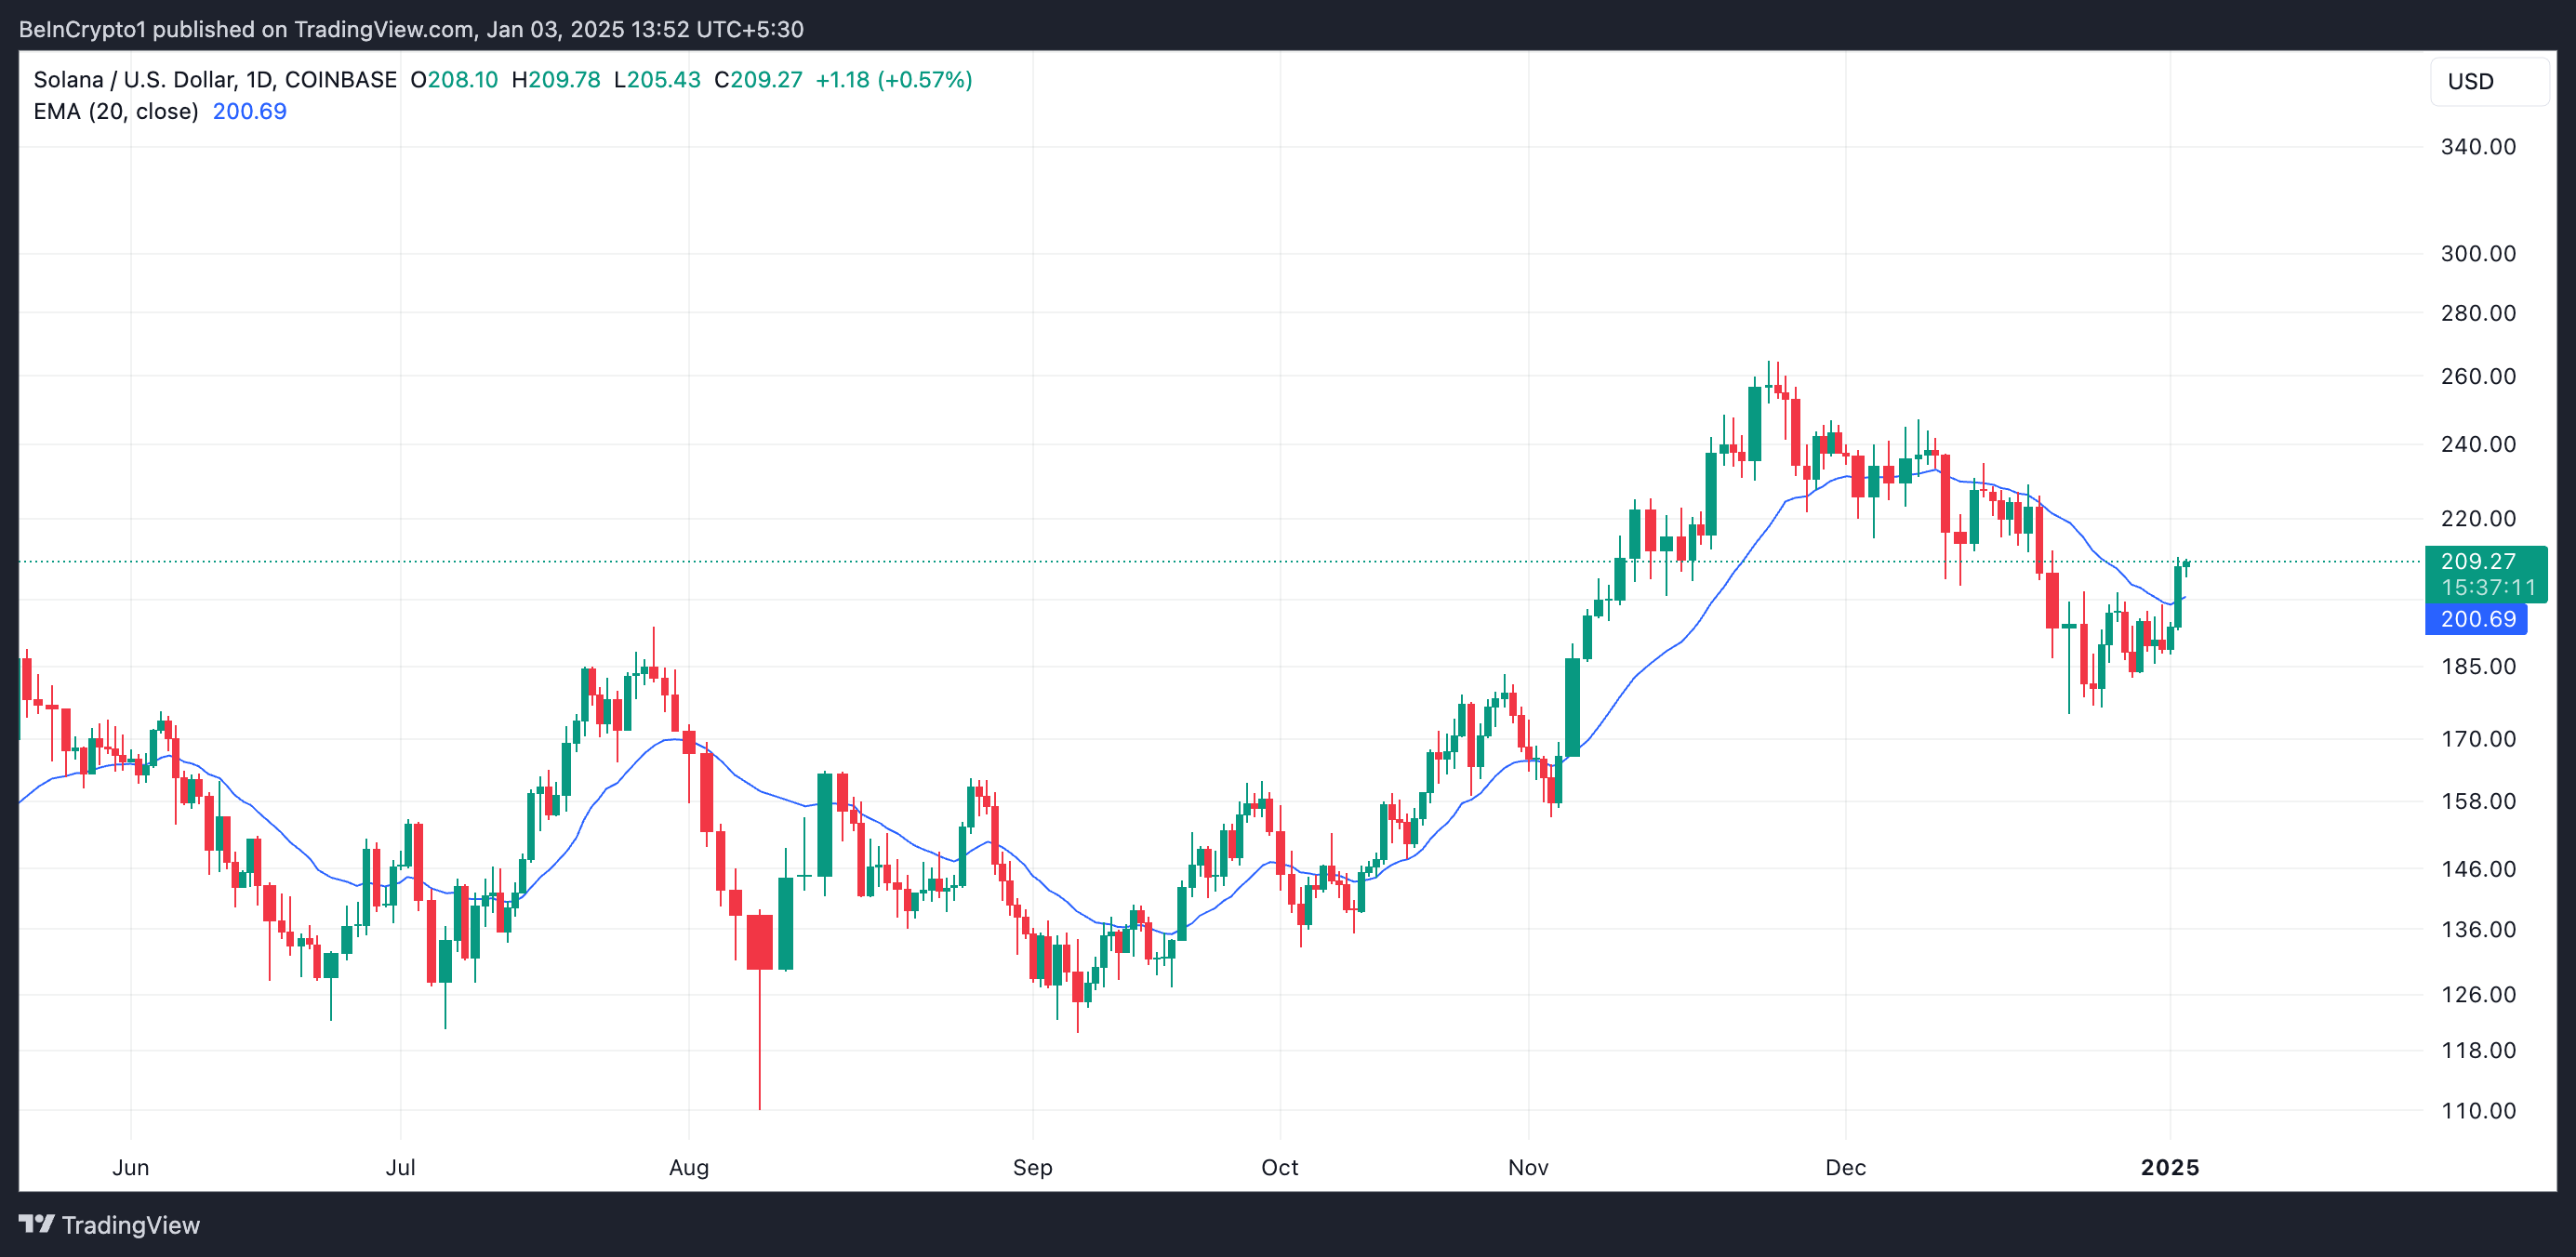
When an asset's price exceeds its 20-day EMA, it indicates a shift to bullish momentum and potential upside, as market sentiment becomes increasingly positive.
SOL Price Prediction: Increased Likelihood of Upside
The reading of the Moving Average Convergence Divergence (MACD) indicator on the daily chart for SOL supports this bullish outlook. At the time of reporting, the coin's MACD line (blue) is above the signal line (orange). This bullish crossover occurred on January 1st, the same day Pump.fun began depositing coins to Kraken.
When an asset's MACD is set up in this manner, it indicates bullish momentum. This means the short-term price movement is stronger than the long-term trend and suggests the asset's price may continue to rise.
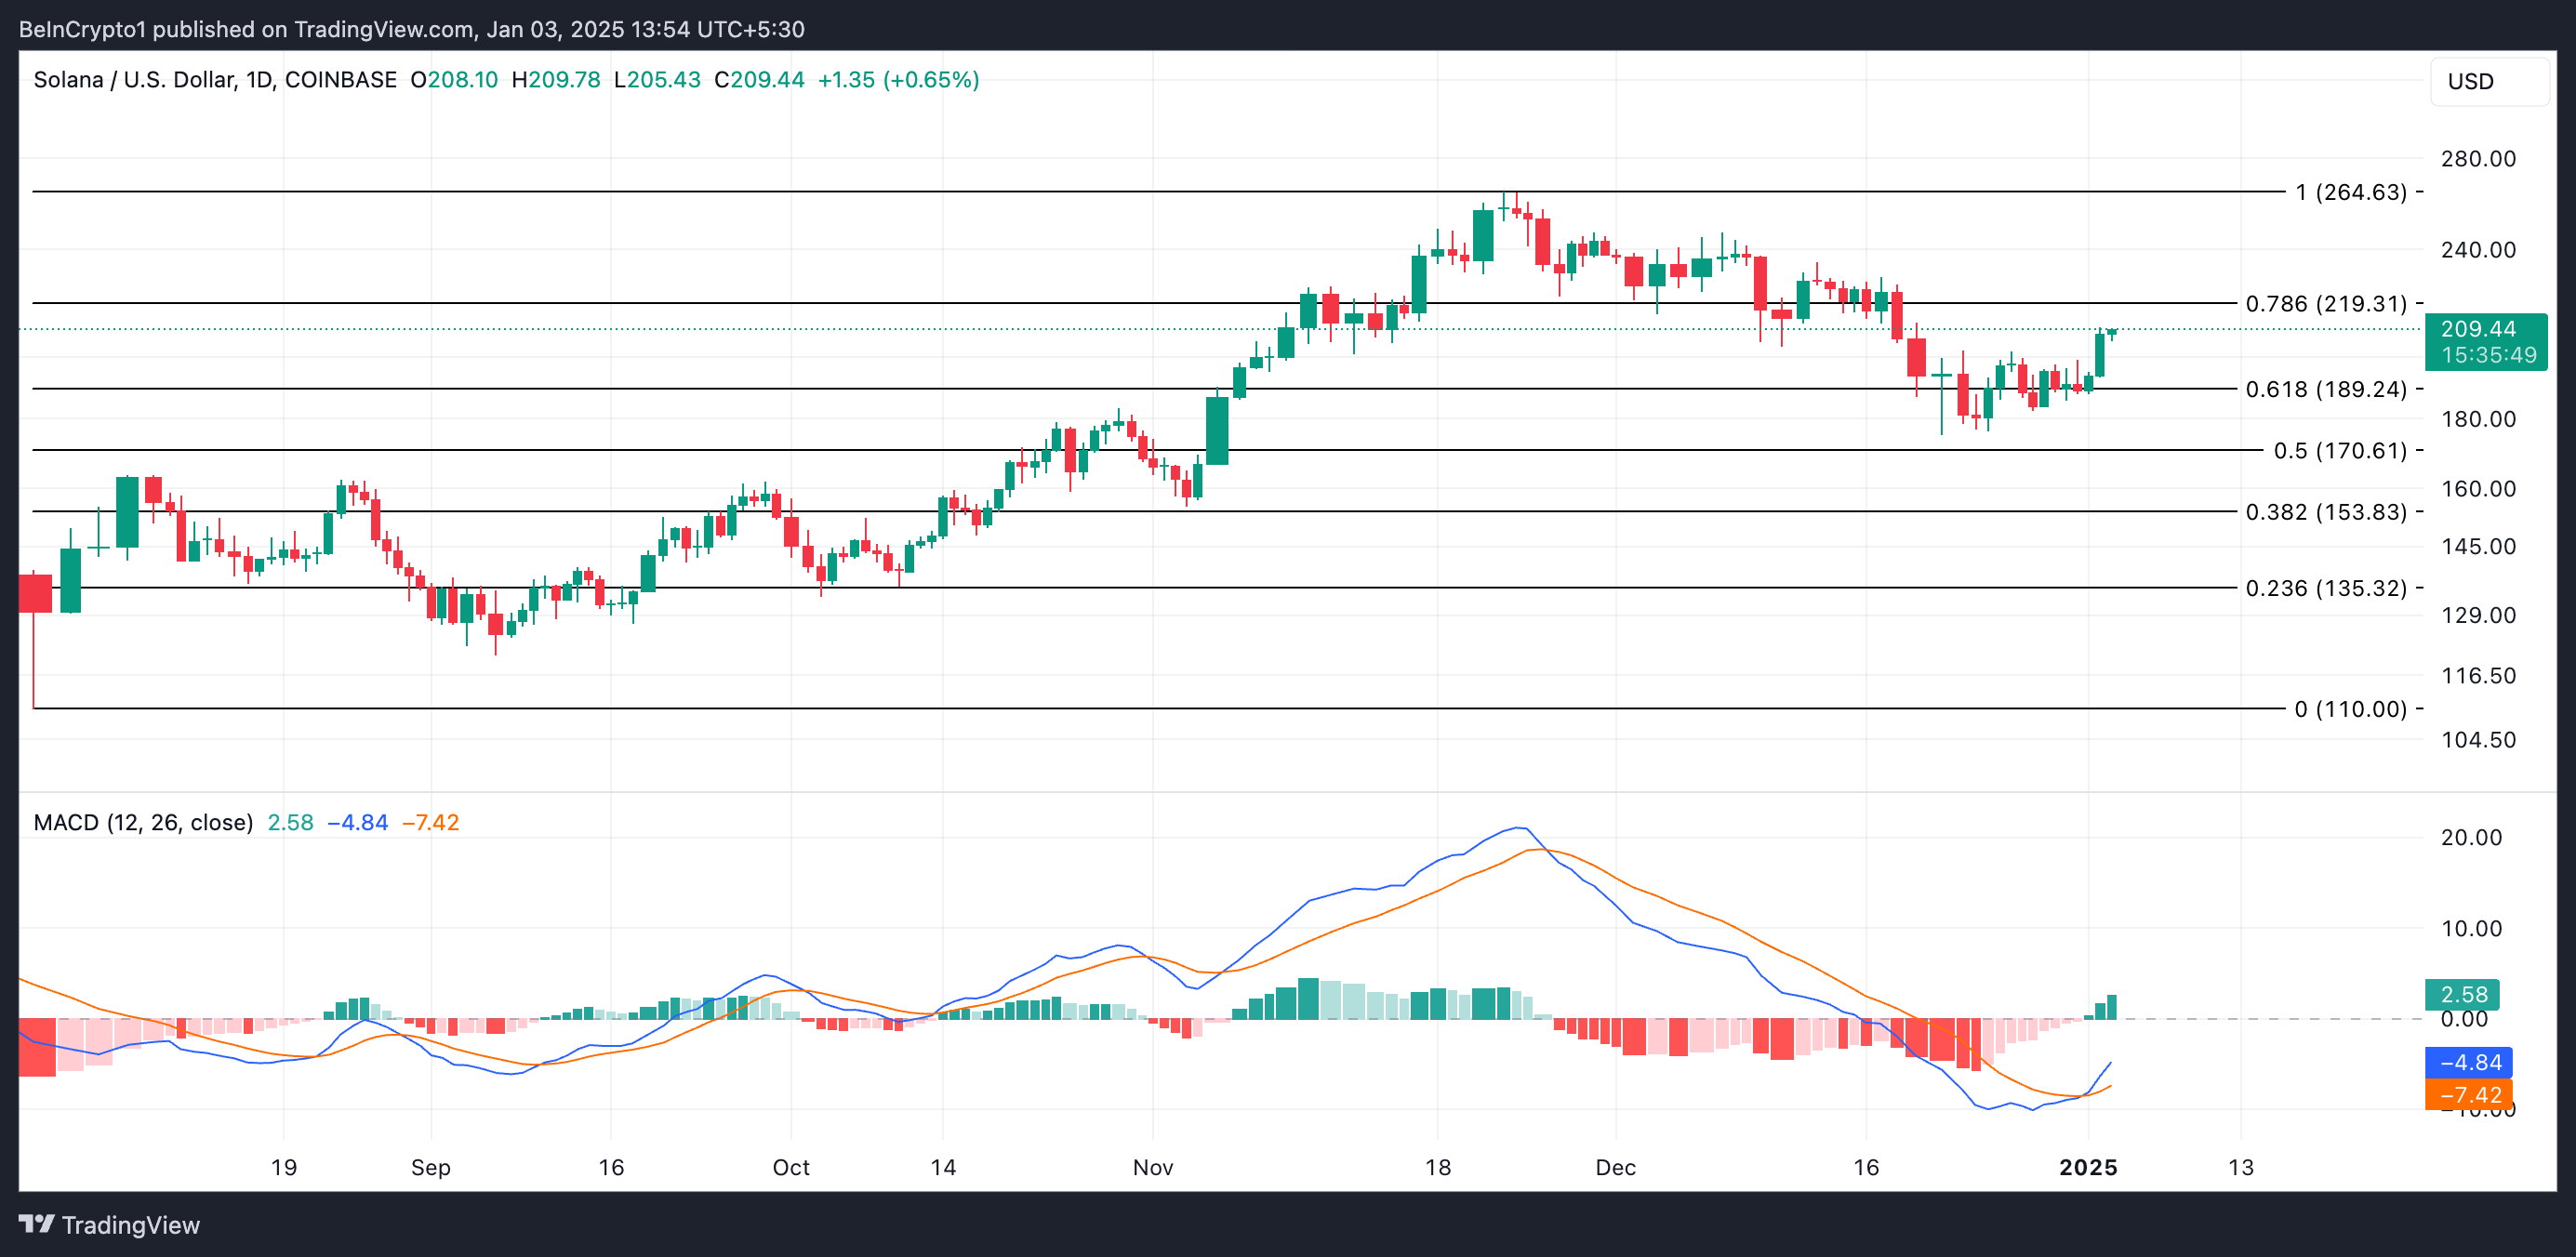
If this condition persists, the price of SOL could break through the $219.31 resistance and recover its all-time high of $264.63. Conversely, a surge in selling pressure could invalidate this bullish outlook and delay the Solana price rally. In that case, the price of SOL could drop to $189.24.


