Bit (BTC) is trying to recover its $2 trillion market value. Upward momentum is building. Recent technical indicators like DMI and RSI suggest that the uptrend is strengthening. However, it emphasizes the need for sustained buying activity.
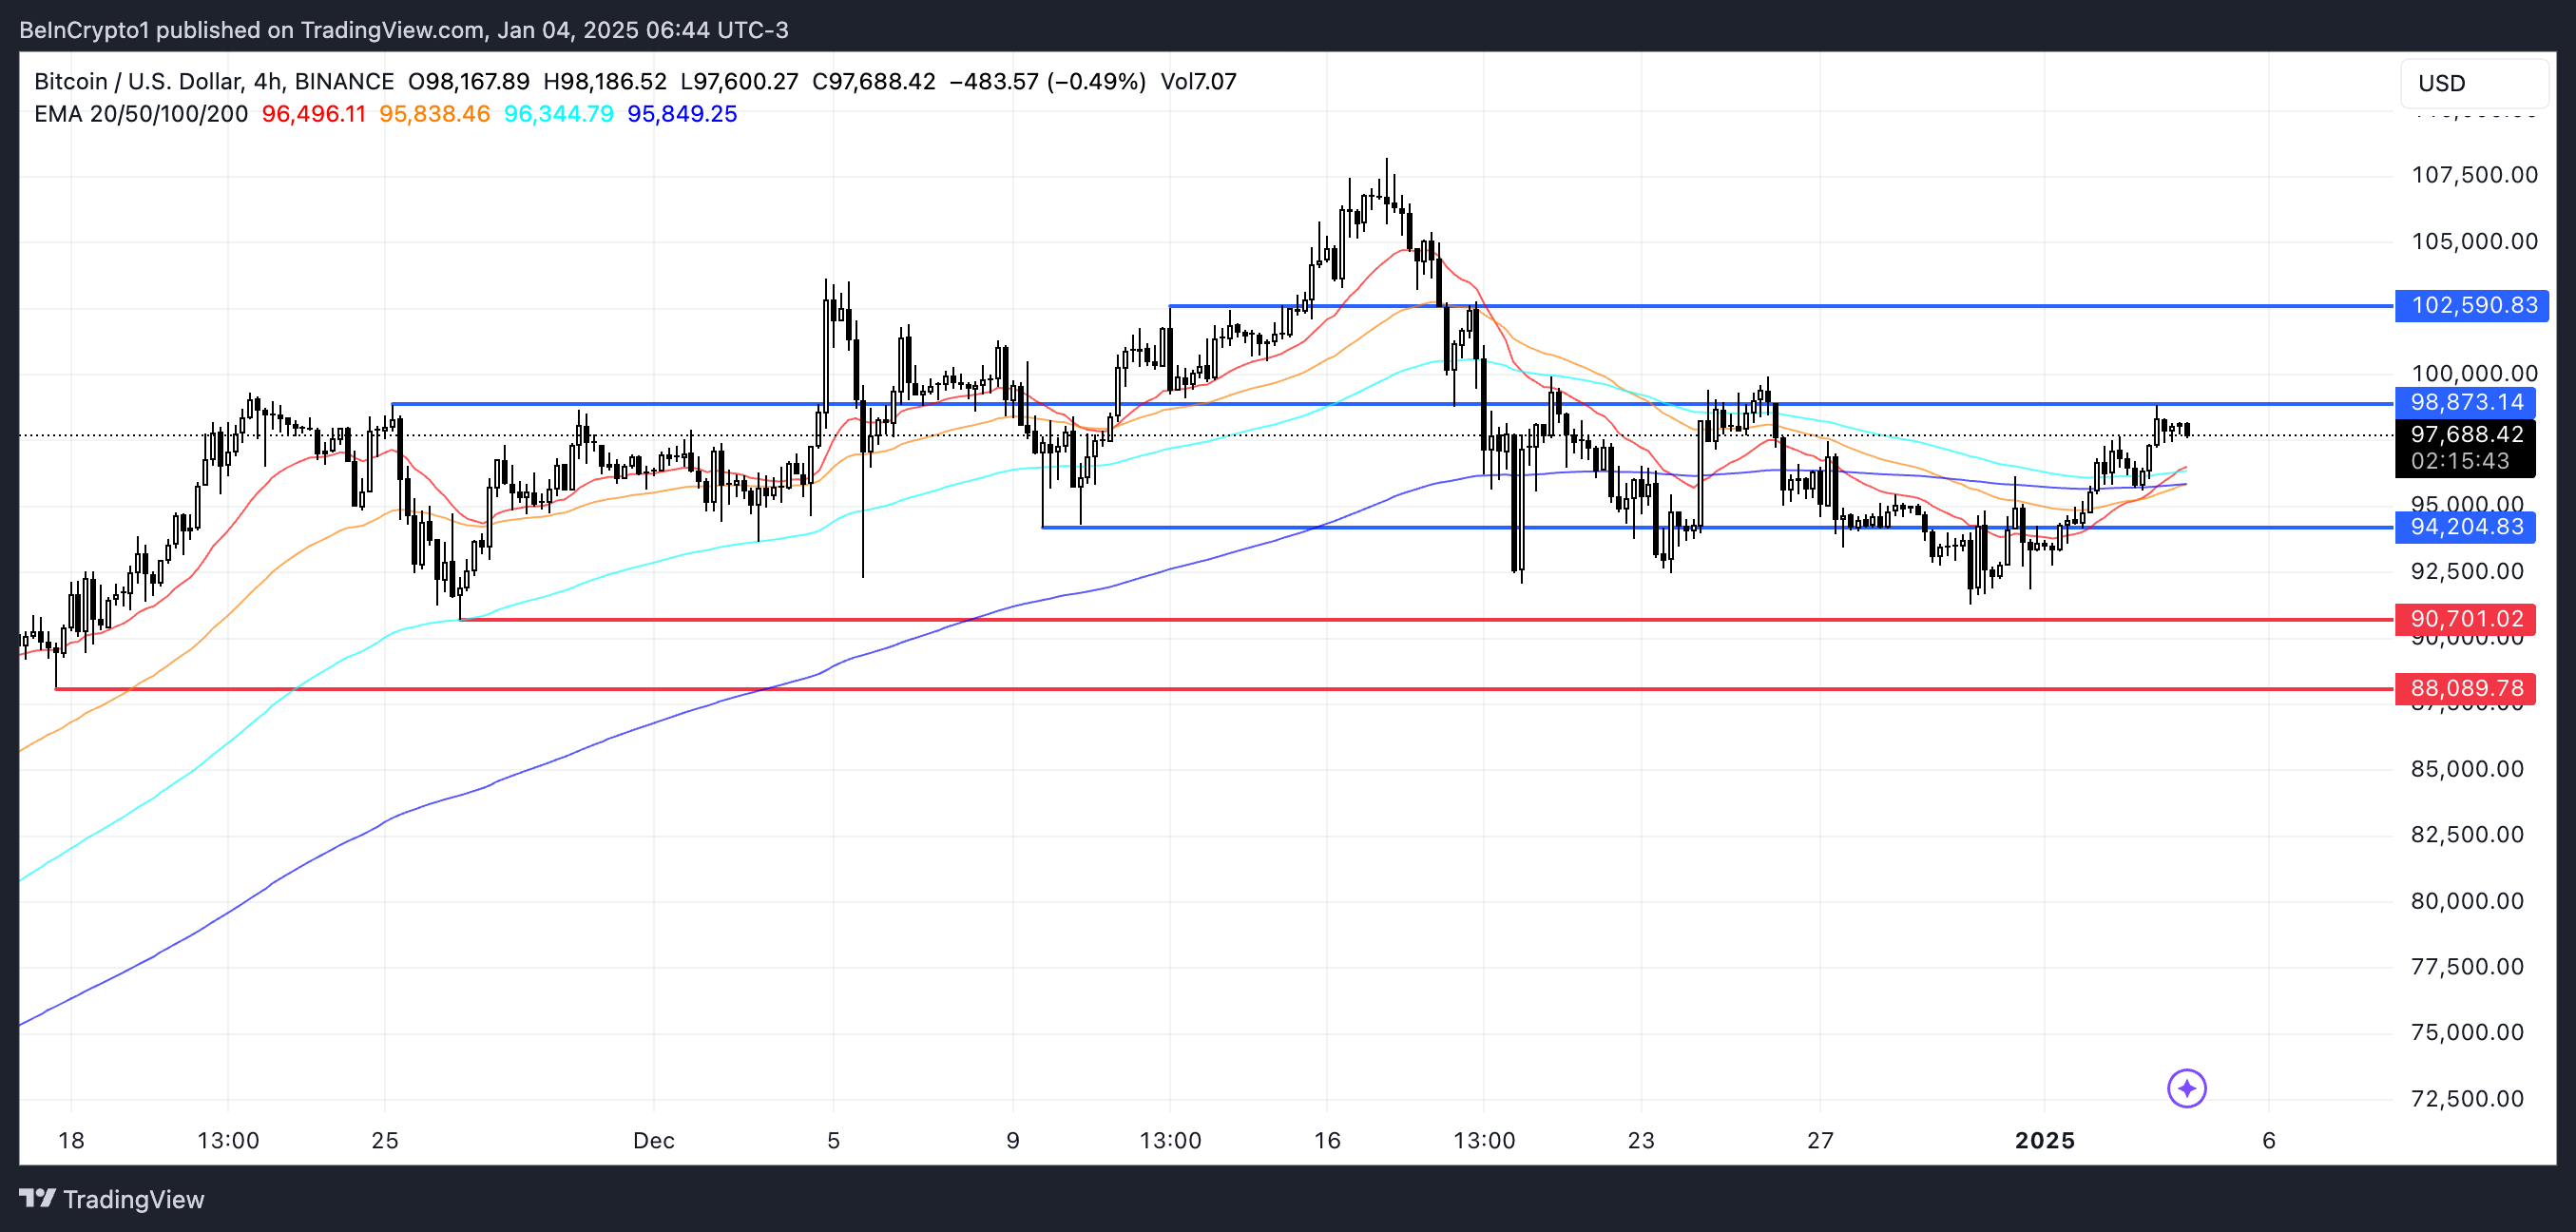
Meanwhile, Bit's (BTC) EMA (moving average) line is hinting at a golden cross. This could allow the price to test the important resistance levels of $98,870 and above. However, if it fails to break through this level, it could fall back to the key support of $90,700 or $88,000.
Bit (BTC) DMI, Uptrend Begins
Bit's (BTC) DMI chart shows that the ADX is currently at 27.3, a significant increase from 13.6 three days ago. The ADX, or Average Directional Index, measures the strength of a trend on a scale of 0 to 100. Readings above 25 indicate a strong trend, while below 20 suggest weak or no momentum.
Bit's (BTC) ADX crossing above 25 suggests the uptrend has gained substantial strength. This reflects increased market confidence in the current price direction.

The directional indicators provide additional context. +DI has slightly decreased to 27.8 from 32.7 yesterday, while -DI has decreased slightly to 11.9 from 13.1. This configuration emphasizes that buying pressure remains stronger than selling pressure. However, the slight decline in +DI suggests the upward momentum has cooled somewhat.
In the short term, Bit's (BTC) price is likely to maintain its uptrend. However, to sustain further gains, new buying activity may be needed to push +DI higher and increase the ADX.
Bit (BTC) RSI Above 50 Since January 1
Bit's (BTC) RSI is currently at 60.47, remaining above the neutral 50 level since January 1. The Relative Strength Index (RSI) measures the speed and magnitude of price movements on a scale of 0 to 100, providing insights into overbought or oversold conditions.
Readings above 70 generally indicate an overbought state, suggesting potential pullbacks. Readings below 30 indicate an oversold state, often signaling a recovery.

Bit's (BTC) RSI has cooled from its recent peak of 66.6 to the current 60.47, reflecting a moderation of buying pressure after a strong momentum.
While the RSI remains firmly above 50, the pullback suggests that Bit (BTC) price may experience some correction or limited upside. New buying activity will need to emerge to push the RSI closer to the overbought territory. The current level provides room for moderate price appreciation while restraining the risk of excessive expansion.
Bit (BTC) Price Forecast: Must Strongly Break $98,870
Bit's (BTC) EMA line is showing signs of a strong uptrend, with the short-term EMA crossing above the long-term EMA. This bullish crossover often signals an increase in momentum. This could allow the Bit (BTC) price to test the $98,870 resistance.
If this level is successfully breached, the path for further gains could open up, potentially reaching $102,590 and even testing $110,000 for the first time, which could happen in the days after Bit (BTC) celebrates its 16th birthday.

However, if Bit (BTC) price fails to break the resistance and the trend reverses, it could face downward pressure. In this case, Bit (BTC) may retest the $90,700 support level, and a break below this could open the door for further decline to $88,000.


