Here is the English translation of the text, with the specified terms retained and not translated:
The year 2024 may be one of the most exciting years in the history of the crypto industry. Crypto activity and usage have reached new historical highs. Blockchain infrastructure has significantly improved, with transaction fees dropping sharply. Stablecoins have found their market fit. The intersection of crypto and AI has become clearer. Bitcoin and Ethereum ETPs (exchange-traded products) have been approved. The legislative and regulatory environment now provides a positive development path for the industry. All of this lays the foundation for another exciting year.
As we think about the future of the crypto industry, here are five key metrics we will be closely monitoring to track the industry's continued progress. (For additional metrics, you can refer to our 2023 Crypto Industry State of the Union, which tracks broader industry innovation and adoption trends.)
1. Monthly Active Mobile Wallet Users
To unlock the next wave of crypto users, we need to move towards user experiences (UX) on par with Web2 applications. Mobile wallets will play a key role here: there are currently hundreds of millions of "passive" crypto holders (those who own crypto but don't transact on-chain regularly) who could potentially be converted to active crypto users. To achieve this, developers need to continue building new consumer applications, and consumers need wallets to participate in them.
Last month, mobile wallet users reached a new all-time high, surpassing 35 million for the first time. This growth has been driven by the expansion of well-known brands like Coinbase Wallet, MetaMask, and Trust Wallet, as well as the emergence of new players like Phantom and World App.
2. Adjusted Stablecoin Transaction Volume
As infrastructure has developed, significantly lowering transaction fees, stablecoin activity has increased in 2024. Notably, stablecoins are used not only for crypto trading, but also for cross-border payments and remittances; purchasing goods and services; and as a store of value, especially in countries with high inflation. Stablecoins have become the cheapest way to send US dollars, and we expect more businesses to start accepting stablecoins as a payment method.
Driven by these factors, the trend of on-chain value settlement growth should continue in 2025. While we can easily measure transaction volume through on-chain data, isolating the true organic stablecoin usage may be challenging. Transactions can be manually initiated by end-users or programmatically by bots, and some on-chain transactions don't resemble traditional settlement patterns.
3. ETP Net Inflows (Bitcoin and Ethereum)
The U.S. Securities and Exchange Commission (SEC) approved Bitcoin and Ethereum exchange-traded products (ETPs) last year; more FAQs on this topic can be found here. This is an important milestone that makes crypto assets more accessible to individual and institutional investors. However, activating distributors - such as Goldman Sachs, JPMorgan, and Merrill Lynch - to bring these products into retail investment portfolios will take time.
One way to measure ETP activity is through "net inflows," which represent the amount of BTC or ETH entering or exiting ETPs. (This excludes existing products like the Grayscale Bitcoin and Ethereum Trust Funds, which will eventually be converted to ETPs.) To date, Bitcoin has seen net inflows of 515,000 BTC (bringing $110 billion in on-chain holdings), and Ethereum has seen net inflows of 611,000 ETH (bringing $13 billion in on-chain holdings).
4. DEX vs. CEX Spot Trading Volume
As more people enter the on-chain space, we expect the usage of decentralized exchanges (DEXs) relative to centralized exchanges (CEXs) for crypto trading to increase. After all, one of the core premises of crypto is decentralized finance (DeFi). As the DeFi ecosystem has evolved, the spot trading share on DEXs has steadily grown, reaching around 11% in recent years. We expect this trend to continue in 2025.
Recently, DEX trading volume has reached new all-time highs - largely driven by a significant increase in trading volume on high-throughput chains like Coinbase's Base and Solana, as well as the influx of new users.
![The crypto industry made significant progress in 2024, laying the foundation for development in 2025. The five key indicators to watch include: growth in mobile wallet users driving improved user experience; stablecoin trading volume reflecting the expansion of real-world applications; net inflows into Bitcoin and Ethereum ETPs indicating institutional investment interest; the comparison of DEX and CEX trading volumes revealing decentralization trends; and total transaction fees measuring the economic value and user participation of the blockchain. These indicators will track the industry's continuous innovation and adoption.</p><p>As we monitor the changing balance between decentralized, crypto-native activities and centralized crypto trading, this will be an important metric.</p><p><a href=]() Track the spot trading volumes of DEX and CEX here.
Track the spot trading volumes of DEX and CEX here.
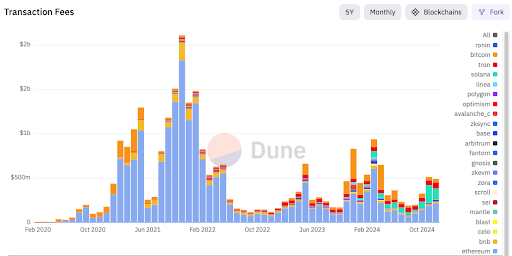
5. Total Transaction Fees (Demand for Block Space)
The total transaction fees in USD show the overall demand for block space on a given chain - i.e., its actual economic value.
However, this metric has many nuances, as most projects explicitly aim to reduce fees for users. Therefore, considering the unit transaction cost is also important - i.e., the cost per unit of blockchain resource. Ideally, the overall demand (total transaction fees) should increase, while gas fees (cost per unit of resource) remain low.
In November 2024, the transaction fees collected by Solana surpassed Ethereum for the first time (see chart below). Notably, this milestone was reached even though Solana's unit transaction cost is significantly lower - the cost to send USDC on Ethereum is around $5, while on Solana it is less than $0.01. This is an important milestone that we will continue to monitor.
Many ecosystems and their related fee markets are maturing, making now a good time to start measuring the economic value facilitated by various blockchains. In the long run, the demand for block space - as measured by the total dollar value of fees paid - may be the most important metric for tracking the progress of the crypto industry. Why? It reflects the degree of user participation in valuable economic activities and their willingness to pay for these activities.
Track the demand for block space and transaction fees here.


