

Author: 1912212.eth, Foresight News
Since the market peaked in 2024, the market has been volatile for months, and many players have suffered heavy losses in the endless downward trend and volatile market. Market noise is also severely divided on the bull and bear markets as well as the long and short positions. The macroeconomic environment is unstable, with Trump wielding the tariff stick, and the Fed's rate cuts still far away, market liquidity is tightening, and the community's pessimistic sentiment is spreading.
So how is the progress of the crypto market? If Bitcoin still has room for further upside, is this the stage bottom area of the market?
I. The Fear and Greed Index has been below 40 since February this year
The CMC Fear and Greed Index is used by CoinMarketCap to measure the overall sentiment of the cryptocurrency market. The index ranges from 0 to 100, with lower values indicating extreme fear in the market and higher values indicating extreme greed. This index can help investors understand the emotional state of the market and plan their buying and selling decisions. In addition, it can also provide a reference for whether the market is undervalued (extreme fear) or overvalued (extreme greed).
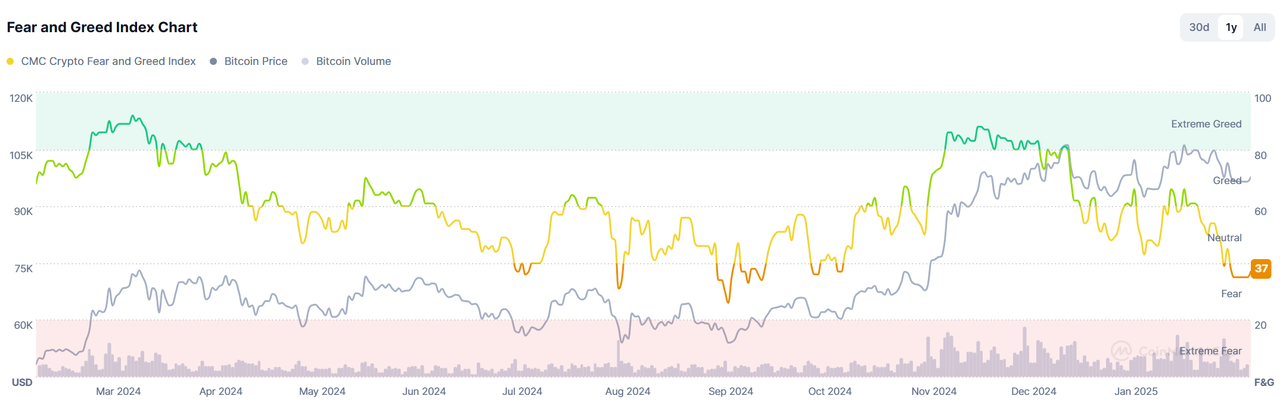
As shown in the figure, the market has seen the Fear and Greed Index fall below 40 (panic) multiple times from July to early October 2024, and then experienced FOMO sentiment in November of that year, with the index temporarily exceeding 80, followed by a market pullback. Currently, the market has again fallen below 40 on the Fear and Greed Index since early February this year.
When the market is in a state of low Fear and Greed Index, it often means that the price of the coin may be in a stage bottom area.
II. The 7-day average funding rate of Bitcoin has dropped 85% compared to December last year
The 7-day average funding rate of perpetual contracts can be used as an important indicator to observe market sentiment. When the market is booming, the funding rate is often high, which is often the top area of the market cycle. Conversely, it is often the bottom area of the market.
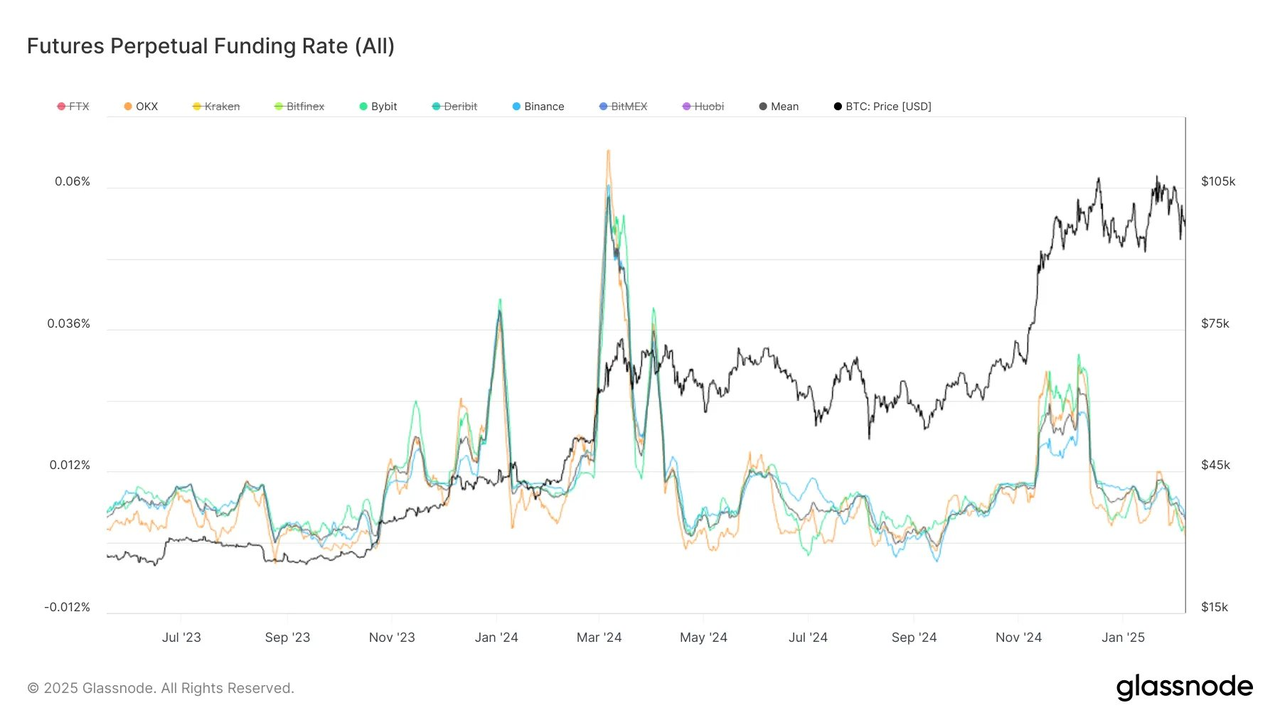
As shown in the figure, the 7-day average funding rate of BTC once exceeded 0.06% in March 2024, indicating that the market's long capital was willing to pay a high cost to the short capital, and the market sentiment was extremely FOMO, which was also the highest point of Q1 that year. From November to December 2024, its funding rate was still above 0.03%, and Bitcoin also broke through the $100,000 mark at that time, but before the market took off, the 7-day average funding rate of Bitcoin had been negative from May to October of that year.
At the time of writing, the funding rate has once reached 0.004%, a 85% drop from the peak in December. The market sentiment is in a pessimistic state.
III. The profitability ratio of ETH has hit a new low in the past 4 months
The market capitalization of Ethereum has fallen 36% from its local high 7 weeks ago, causing the number of profitable ETH to plummet. From the daily closing data, the current profitability ratio of ETH has hit a new low in the past 4 months, and the number of profitable tokens has also dropped to the lowest level in 3 months.
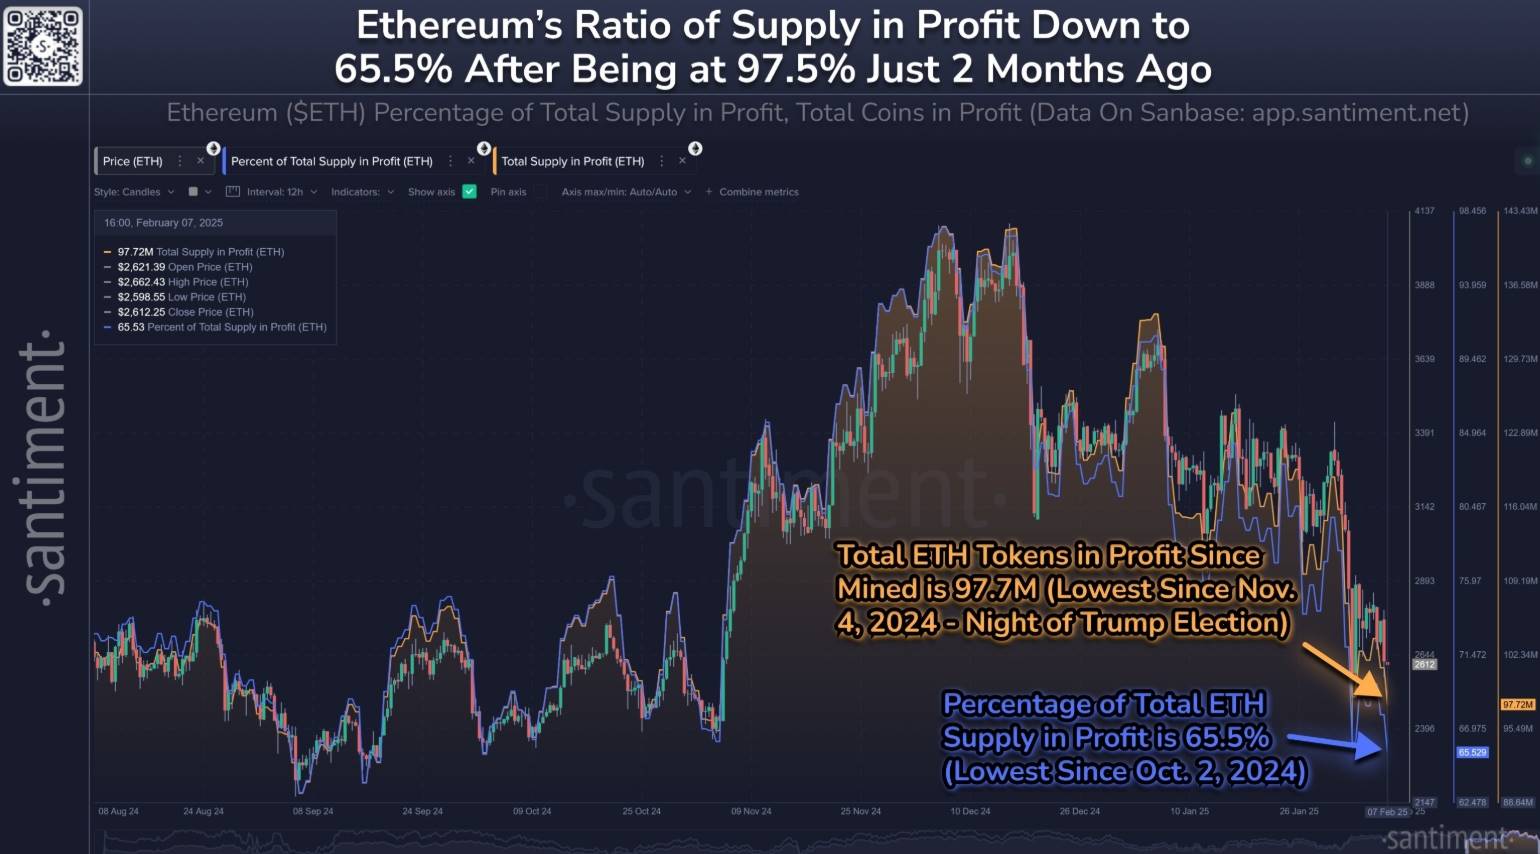
As the second largest cryptocurrency by market capitalization, Ethereum has underperformed other large-cap coins, and the market sentiment has fallen into significant negativity. Although the market is currently full of panic (FUD) and retail investors are continuing to sell, once the crypto market stabilizes, Ethereum may see a rebound.
IV. Bitcoin miners have surrendered again since early February this year, and mining difficulty has risen instead of falling
The surrender of Bitcoin miners is often seen as an important reference indicator for the market bottom. Miner surrender means that the profitability of mining a Bitcoin is lower than the cost, and historical data shows that the surrender of Bitcoin miners is often the bottom area of the market.
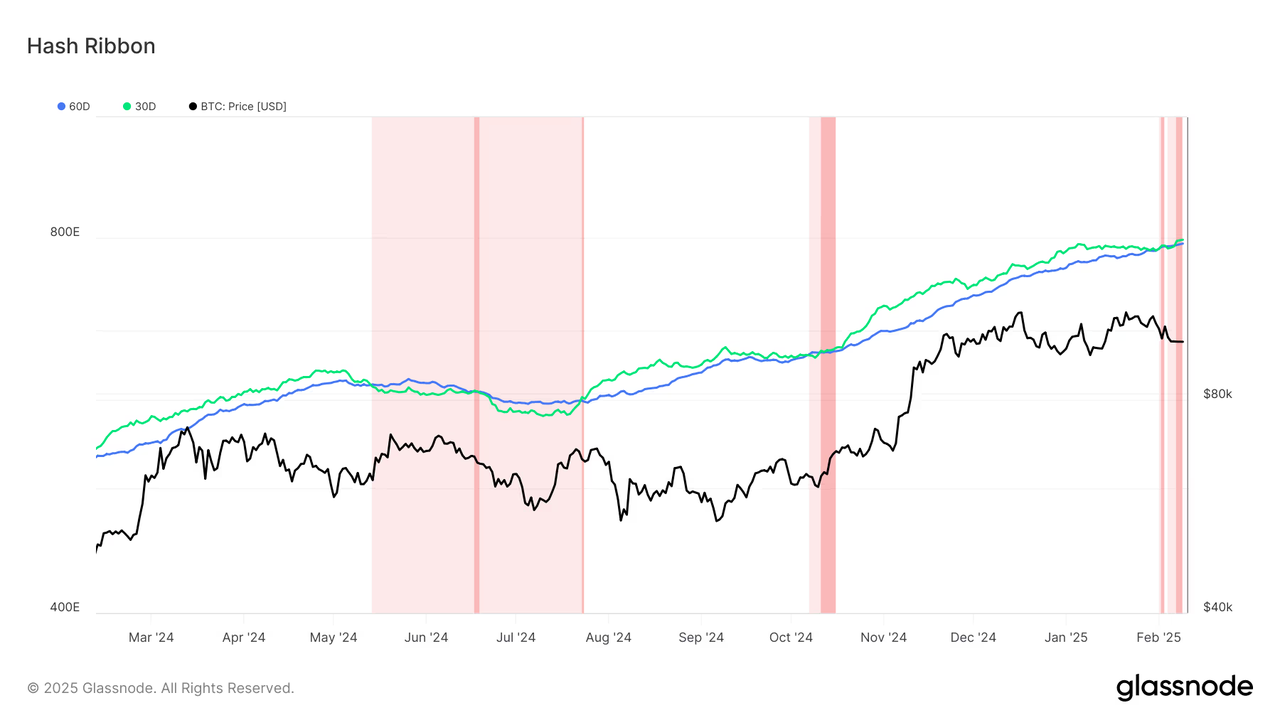
The figure shows that since 2024, Bitcoin miners have surrendered in June and October of that year. Since 2025, Bitcoin miners have surrendered for the first time since February.
At the same time, the mining difficulty of Bitcoin has recently hit a new high of 114.7T. The record high difficulty usually indicates that miners are still optimistic about the long-term value of Bitcoin, otherwise they would not continue to invest computing power. This may have a certain positive impact on market sentiment.
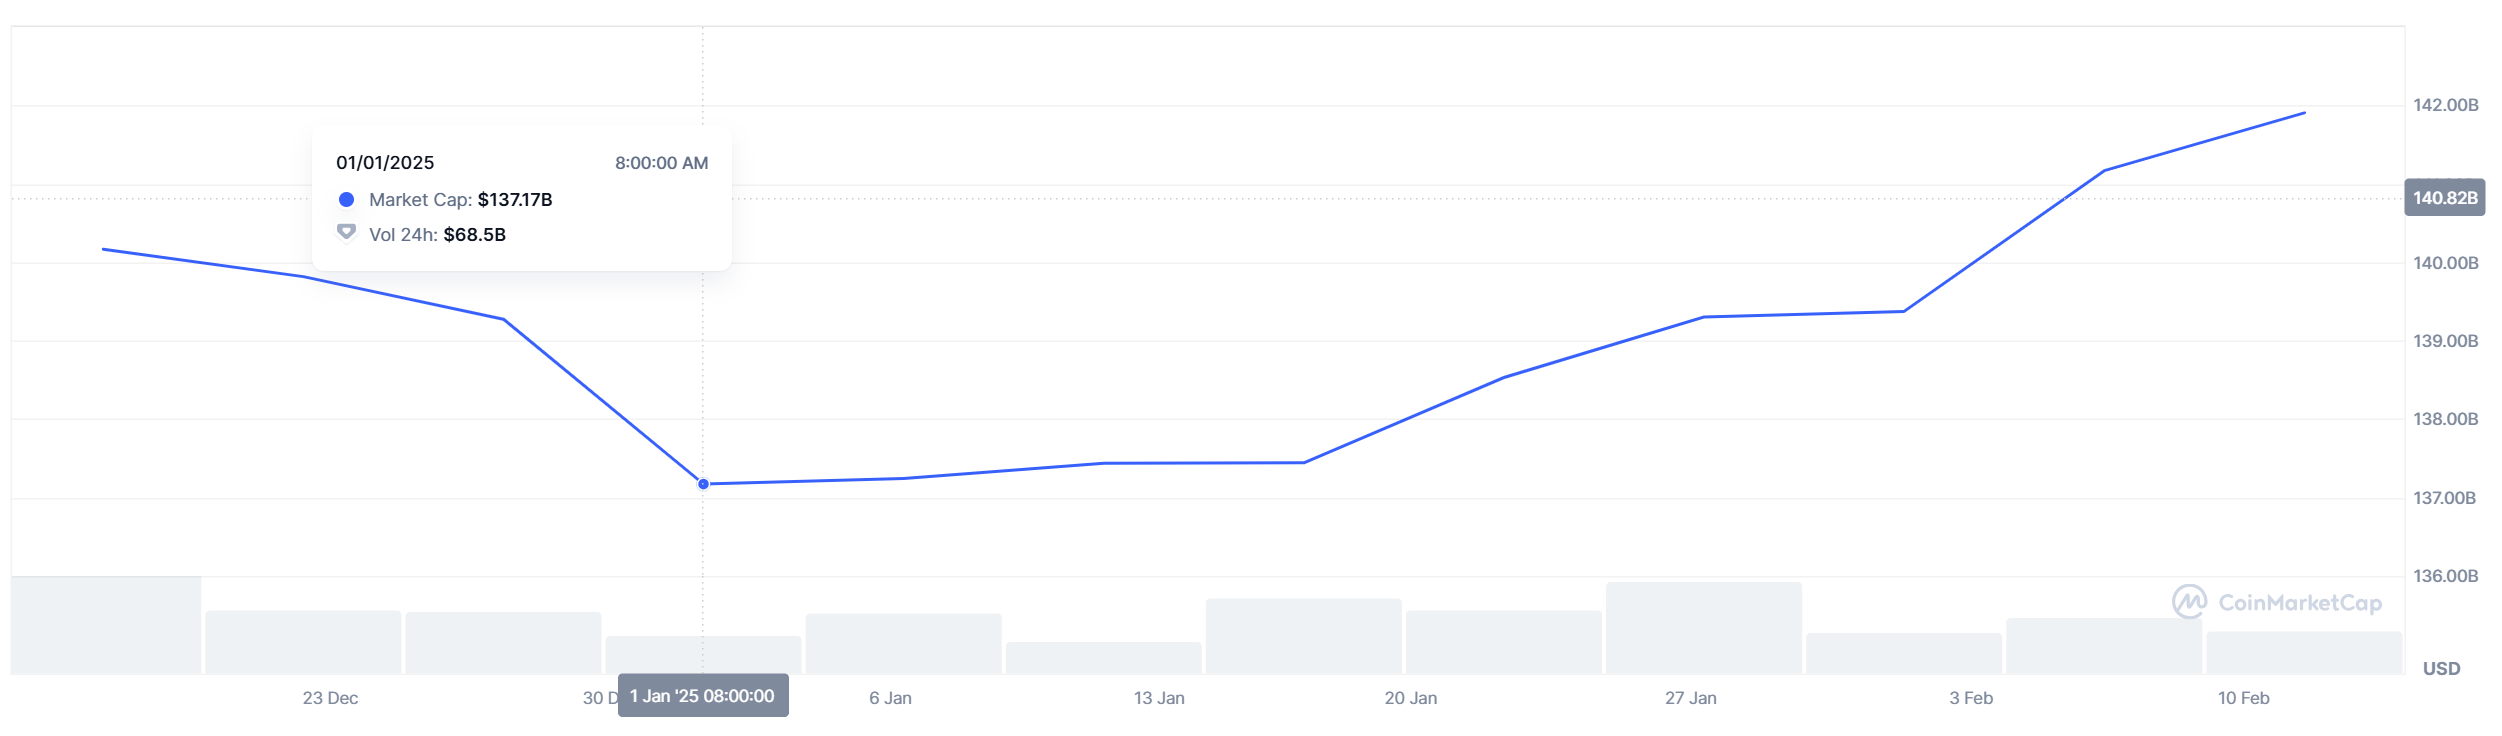
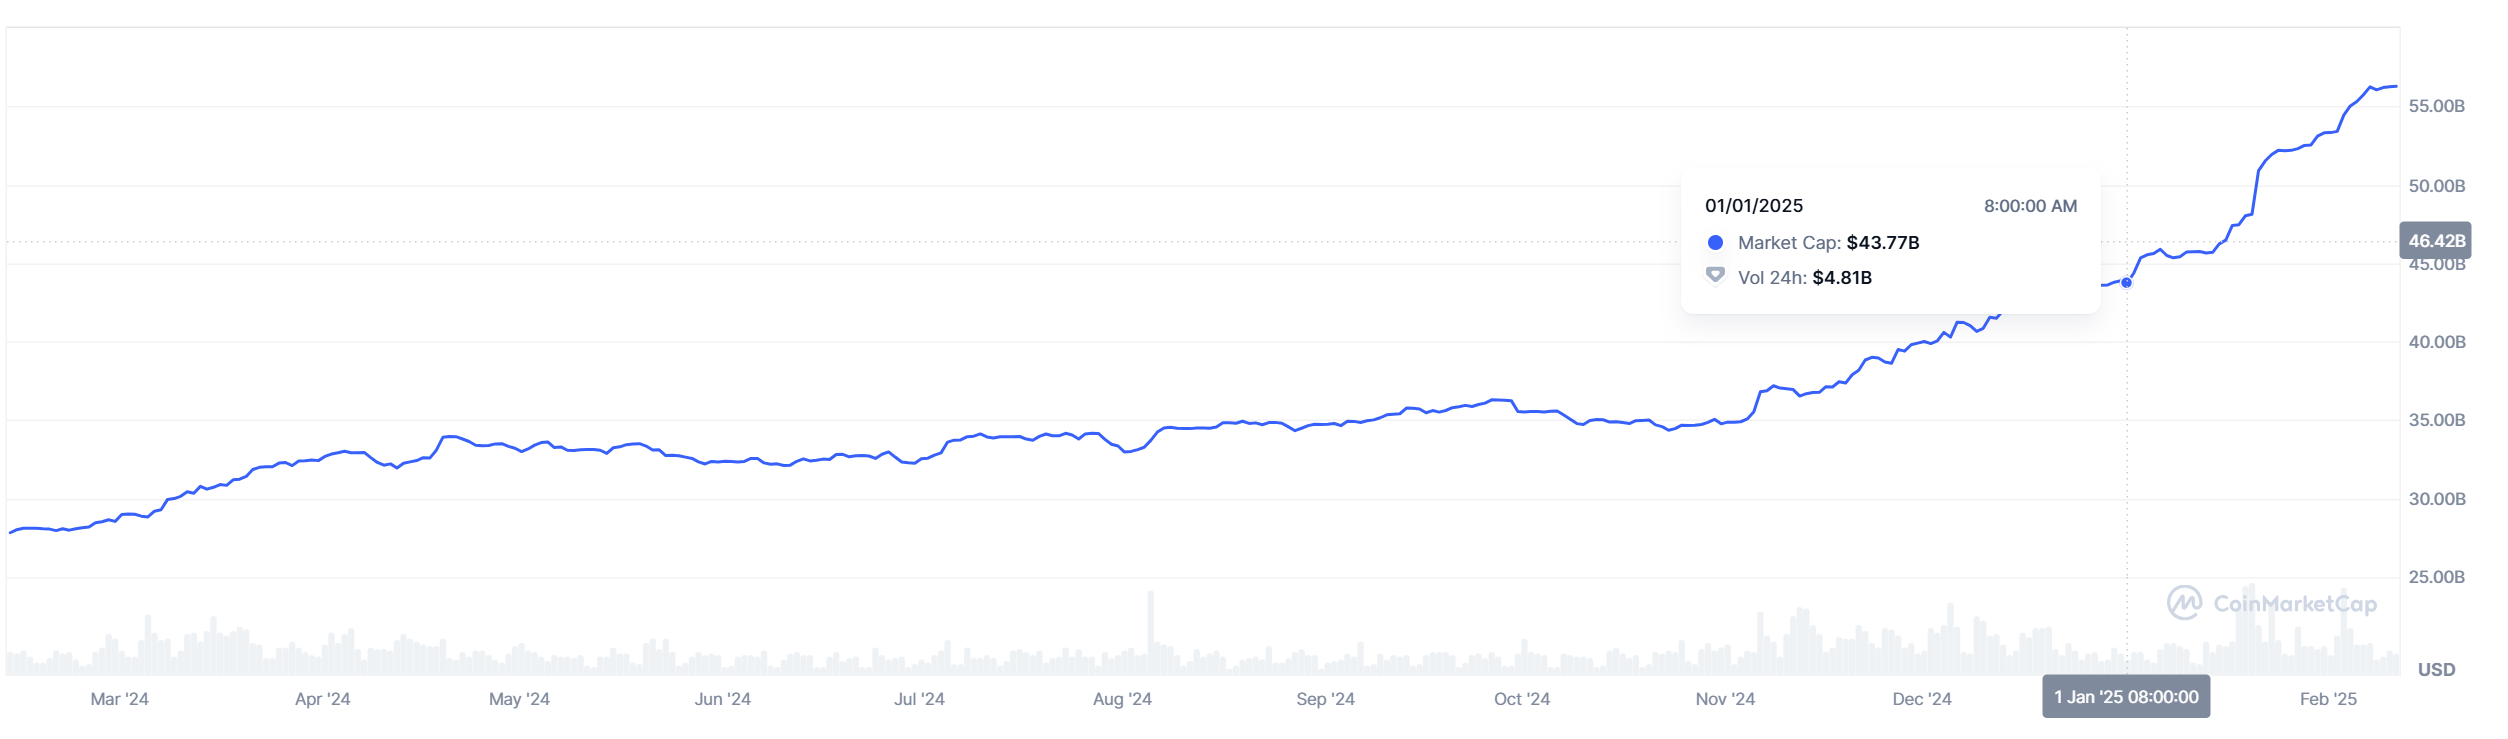
V. The market capitalization of stablecoins has risen instead of falling in the past month
Stablecoin data is an important reference data for observing the inflow of market funds. Over the past month, according to defillama, the market capitalization of USDT has increased by 3.4% (4.76 billion US dollars), and USDC has surged by 22.73% (10.396 billion US dollars).
If calculated from January 1, 2025, the market capitalization of USDT has risen from 137.17 billion US dollars to the current 141.9 billion US dollars, an increase of 4.73 billion US dollars.
The USDC data has increased from 43.77 billion US dollars to the current 56.28 billion US dollars.
Summary
The above 5 data points may indicate that the market may be in a stage bottom area, but it is difficult to predict when the market will break out of the bottom area. Investors should note that even if some tokens are currently in the bottom area, some tokens with no heat, no narrative, no fundamentals, and continuous massive unlocking, are difficult to attract capital attention and may face continued downward pressure.


