

Recently, Bitcoin has been hovering around $100,000, while Altcoins have mostly been cut in half, even dropping 70% or 80% has become the norm. BTCD (Bitcoin dominance) has also quickly risen from the low of 54% in early December 2024 to 61%, using data to prove that, under the fluctuation of Bitcoin prices, the general decline of Altcoins has become an undisputed fact.
So what has happened in the market recently that has put the crypto market in an ice age?
Trump and his family members launching tokens, the release of Deepseek R1, and the US trade war.
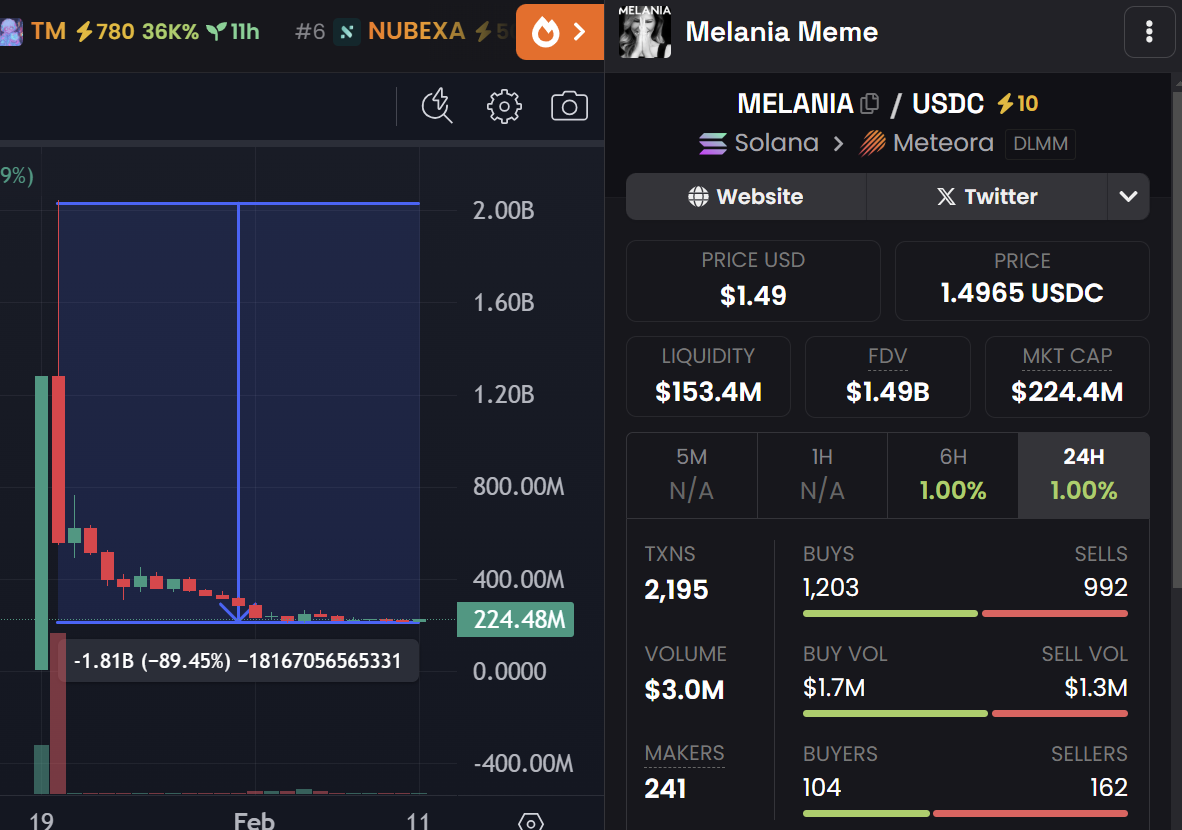
Trump's token launch captured the market's huge attention and was seen as a bullish signal for the market, while his wife Melania's subsequent token launch was seen as a "fundraising" tactic, not only diverting attention and market liquidity, but also undermining the overall industry's confidence.
The release of Deepseek R1 announced to the world that with an investment of only $5.5 million, it can match or even surpass the most advanced LLMs currently on the market, raising doubts about the oversupply of computing power. NVDA's stock price also plummeted 17% on the same day, but the concern about the oversupply of computing power is unnecessary, as more efficient training models mean that more advanced chips and more powerful computing power can be used to build stronger models, which is actually a short-term bearish, long-term bullish scenario. In the Web 3 domain, this scenario has triggered market reflection: if a $5.5 million cost can produce a usable AI product, why do we still need to buy AI Agents with a market cap of hundreds of millions, but with products still in disarray?
On February 1, 2025, Trump signed an executive order imposing 25% and 10% tariffs on imports from Canada, Mexico and China, respectively. Reviewing the 2018-2020 trade war, it had an "short-term volatility, long-term bullish" impact on the cryptocurrency market as a whole, and with the tariffs on Mexico and Canada temporarily suspended for a month. The connection between tariffs and the crypto market is indirect and secondary, as the main tariffs still affect the overall US economy, and the US economy affects the crypto market.
What other changes have occurred in the crypto narrative?
The celebrity token craze led by Trump, the AI Agent bubble burst, the revival of SocialFi, and the resurgence of the BNB Chain ecosystem?
Celebrities usually don't choose to issue tokens due to regulatory and reputational concerns, but even US President Trump has issued tokens, allowing celebrities who want to issue tokens to eliminate various concerns. However, since the fame and influence of subsequent celebrities cannot surpass Trump, this narrative is more like a PVP hype, with extremely short sustainability.
The rise of celebrity tokens, coupled with the release of Deepseek R1, has also diverted attention from the AI Agent track. The overall track market cap has dropped more than 60% from its peak, with leading projects like Virtual and AI16Z falling about 70% from their highs, not to mention new AI projects, most of which have ended up at zero.
Continuing the celebrity token track, in addition to announcing the token launch on their own Twitter, a more likely scenario is that their accounts are hacked and the token contract address is posted (although this could also be a token launch tactic). To verify the authenticity of the token launch, two SocialFi products, Clout and Tribe, appeared in the market at the time, which can be directly connected to Twitter to verify the identity, similar to the previous Friend Tech. The overall market cooling and the project parties having serious front-running issues have been criticized, and SocialFi has only caused a wave in the market for less than a week.
Going back to February, TST is a test token from Binance, which quickly sparked market enthusiasm due to CZ's tweet, with the token market cap instantly rising from less than $10 million to a peak of $500 million, but the token market cap failed to stabilize at the $500 million mark and directly plummeted more than 60% the next day, meaning that the market narrative led by the BNB Chain has come to an end.
Looking at the above recent crypto narratives, one can find a common feature - they are all extremely short-lived, meaning that the market is currently in a zero-sum state, where the surge of one sector means the capital outflow of another sector, and there is no truly sustainable high-quality track investment. Is this a signal that the market has reached its peak? We will use 3 data points to judge the current market stage.
Reference: dexscreener
Top Indicator: Not Yet Reached
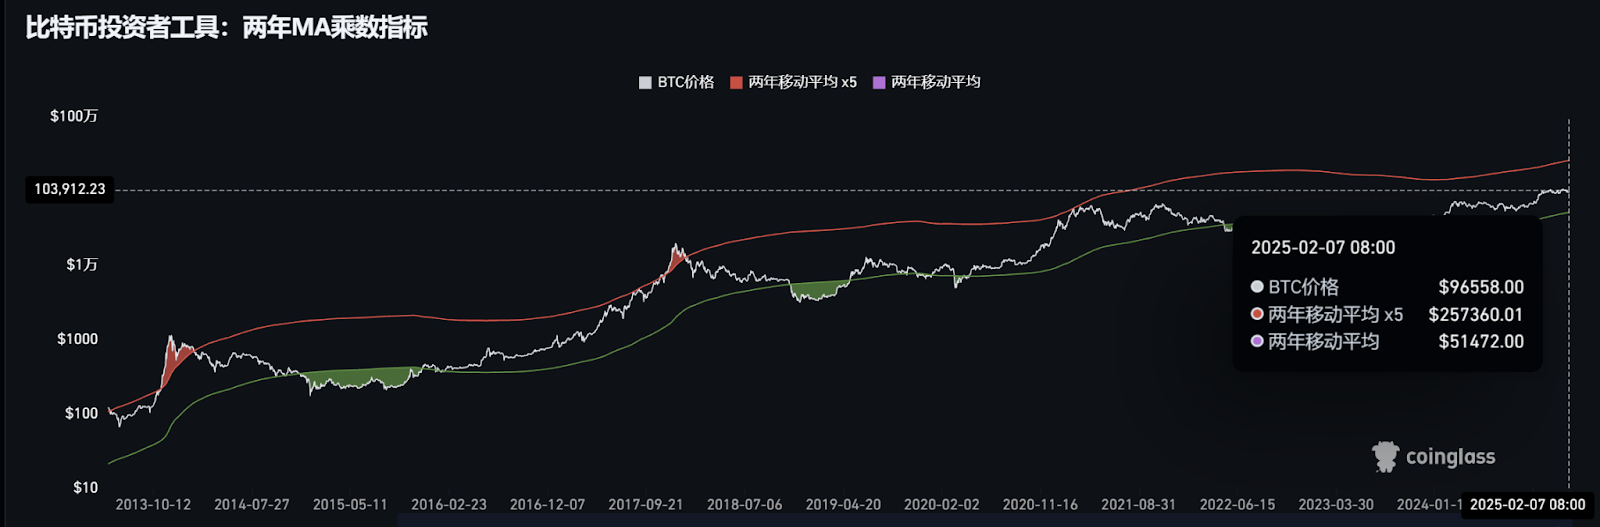
The 2-year MA multiplier indicator is intended to be used as a long-term investment tool, highlighting the periods when buying and selling Bitcoin can generate outsized returns. To this end, it uses a 2-year moving average (equivalent to a 730-day line, green line) and a 5x multiple of that moving average (red line).
Historically: When the price falls below the 2-year moving average (green line), it is a bottom-fishing buy signal, and buying Bitcoin will generate excess returns. When the price exceeds 5x the 2-year moving average (red line), it is a top-selling signal, and selling Bitcoin will generate significant gains.
Currently, the Bitcoin price is still far from the 5x 2-year moving average (257,360), and based on this signal, the overall crypto market has not yet reached its peak.
Reference: dexscreen
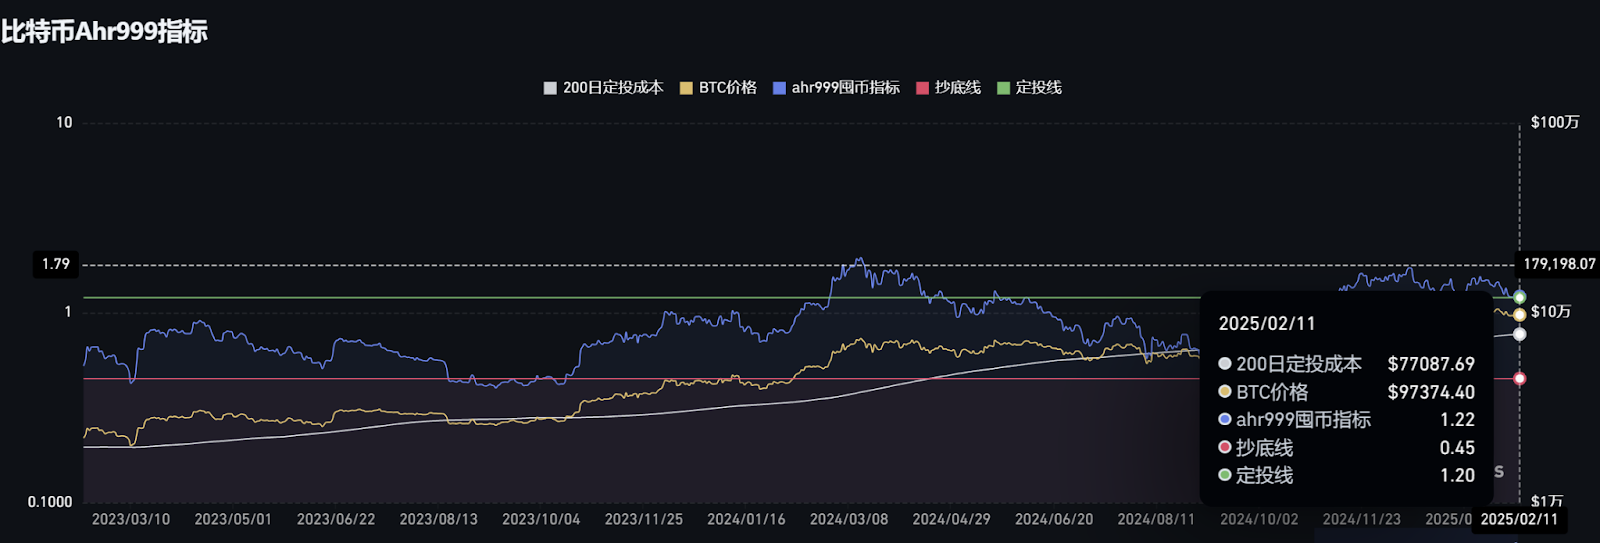
Ahr999 Indicator: Slightly Above the DCA Zone
This indicator implies the short-term DCA (dollar cost averaging) return on Bitcoin and the deviation of Bitcoin price from expected valuation.
When the Ahr999 index is below 0.45, it's time to buy the dips;
When the Ahr999 index is between 0.45 and 1.2, it's suitable for DCA;
When the Ahr999 index is above 1.2, the coin price is relatively high and not suitable for operation.
From a long-term perspective, Bitcoin price and block height have a certain positive correlation. By taking advantage of the DCA approach, users can control the short-term DCA cost and keep it below the Bitcoin price most of the time.
Currently, the Ahr999 indicator is 1.22, barely falling within the DCA zone, and based on this indicator, it can only be said that the current coin price is "not cheap enough", but there is still a huge space away from the top.
Reference: coinglass
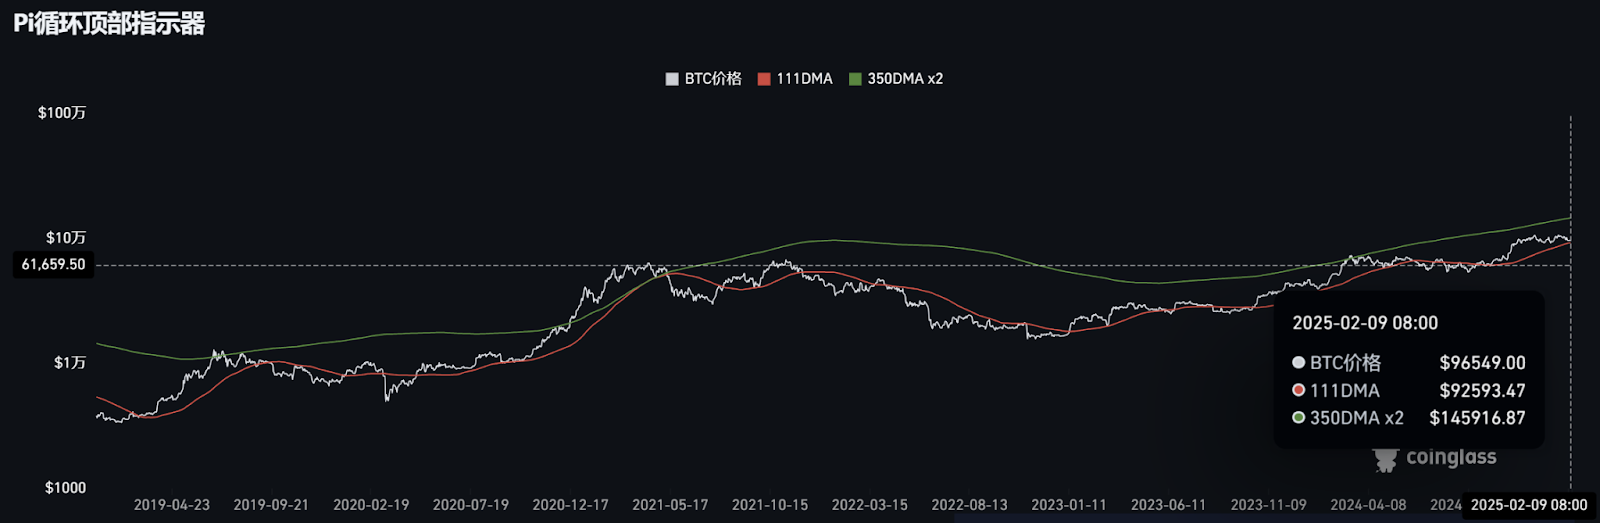
Pi Cycle Top Indicator: Top at Least $145,000
This indicator uses two sets of data to determine if Bitcoin is in an overbought state:
111-day moving average (111DMA, red line)
Twice the 350-day moving average (350DMA x 2, green line)
The usage is as follows:
When the 111-day moving average turns upward and breaks through twice the 350-day moving average, it usually represents that the Bitcoin price has reached the top, which is a sell signal.
How to interpret this indicator?
The implication of the Pi Cycle Top indicator is to observe whether the short-term price has broken through the average price level of long-term holders, and to use this to judge the degree of market overheating. When the 111DMA (red line) breaks through 350DMA x 2 (green line), it usually means that the market is overly optimistic, with FOMO (fear of missing out) sentiment, which is often an overbought signal, suitable for considering selling.
According to the latest chart information, on November 6, 2024, the Bitcoin price was around $96,549, while the 350DMA x 2 level was around $145,916, and it is still far from reaching the top.
Reference: coinglass


