

Author: Bitpush New Mary Liu
The cryptocurrency market opened the week with a significant decline. Over the past 24 hours, Bit declined by 5%, briefly falling below the $91,000 mark, hitting a new monthly low. Other major altcoins also saw widespread declines: Solana (SOL) fell more than 16%, Ethereum and XRP dropped 12%, while BNB saw a relatively "mild" 6% decline. Over 90% of the top 100 tokens by market cap experienced losses.

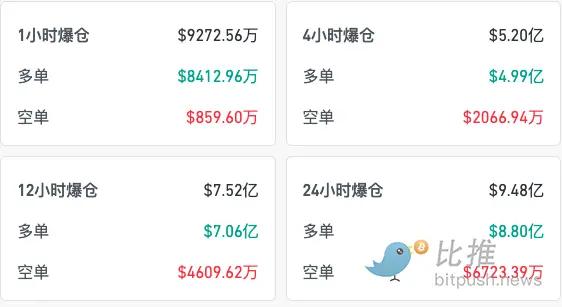
Coinglass data shows that as of the time of writing, the 24-hour crypto-wide liquidation amount reached a staggering $950 million, with long positions being the majority. A total of 314,902 traders were liquidated globally.
Bit: The 200-day moving average will determine the future direction

TradingView chart analyst Tomarket states that the Bit (BTC/USD) daily chart shows the price is currently in a consolidation phase, with the fluctuation range confined within a clear range (the blue rectangular area in the chart above). This pattern indicates that the market is in a stalemate between bulls and bears, with neither side having a clear advantage.
From a technical perspective, the key resistance level is in the $100,000 to $103,787 range. Breaking above this level could trigger a new round of uptrend, with targets at $108,734 to $110,266. On the other hand, the short-term support level is in the $96,484 to $97,065 range, and a break below this could lead to more selling pressure. In the long run, the $89,533 to $84,773 area (the 200-day moving average) is an important support level, which has historically been a strong demand zone in trending markets.
The 200-day moving average ($84,773) is a critical long-term support level, and if the price pulls back to this area, it may attract buying interest.
In terms of potential market direction, if the price breaks below $96,000, it may indicate increased selling pressure, leading to further downside to the $89,533 to $85,000 area, or even a breach of the 200-day moving average, triggering a deeper correction. If the price breaks above $103,787, it could trigger the continuation of the uptrend, with targets at $108,734 and $110,266, or even a new all-time high above $120,000.
In summary, Bit is currently in a consolidation phase, and the 200-day moving average is a key long-term support level. Traders should closely monitor the price performance in these critical areas to gauge the market's next move.
Ethereum faces a significant decline, and market sentiment is becoming more cautious
One possible reason for Ethereum's poor performance is that some traders had previously expected Bybit to make large purchases of ETH in the open market to offset its losses, but this assumption proved to be unfounded, leading traders to have to close their positions.
Data shows that on February 24, Ethereum's open interest contracts decreased from 8.82 million ETH to 8.52 million ETH, indicating that traders are closing their leveraged positions. Well-known cryptocurrency analyst Crypto Rover warned on Twitter that if Ethereum (ETH) continues to decline significantly, it may raise concerns about the sustainability of the altcoin season.
On-chain data shows that over the past 24 hours, the number of active Ethereum addresses has decreased by 7% to 450,000, suggesting that network activity may be declining. From a technical analysis perspective, the ETH price has broken below the 50-day moving average, indicating bearish momentum. @Manofbitcoin on X platform analysis indicates that the ETH support level is between $2,512 and $2,305. Only a sustained break above $2,919 would confirm an uptrend.

In summary, Ethereum is currently facing significant downward pressure, and market sentiment is becoming more cautious. The impact of deleveraging and the Bybit event has exacerbated price volatility. The potential decline in ETH price may have a cascading effect on the altcoin market, and investors need to closely monitor key support levels and changes in market sentiment.


