

Introduction
The cryptocurrency market is in turmoil. Yesterday, March 9th, Bitcoin - the bellwether of the crypto world - plummeted 7%, with the price retreating from its highs, triggering widespread panic in the market. According to The Block data, the spot trading volume on centralized exchanges (CEX) reached $1.77 trillion in February, which, although a new low for the year, was down 23.7% from $2.32 trillion in January, indicating a significant contraction in market activity. At the same time, crypto analyst Miles Deutscher pointed out on social media that only 12 out of the top 100 cryptocurrencies by market cap have seen positive returns in the past 90 days. For example, BERA surged 579.63%, TRUMP rose 85.61%, while Bitcoin fell 13.47% and LINK plummeted 40%. This dramatic divergence and the decline in trading volume together paint a picture of extreme panic in the market. Does this mean that the bear market has quietly arrived?
Market Sentiment and Fear Index
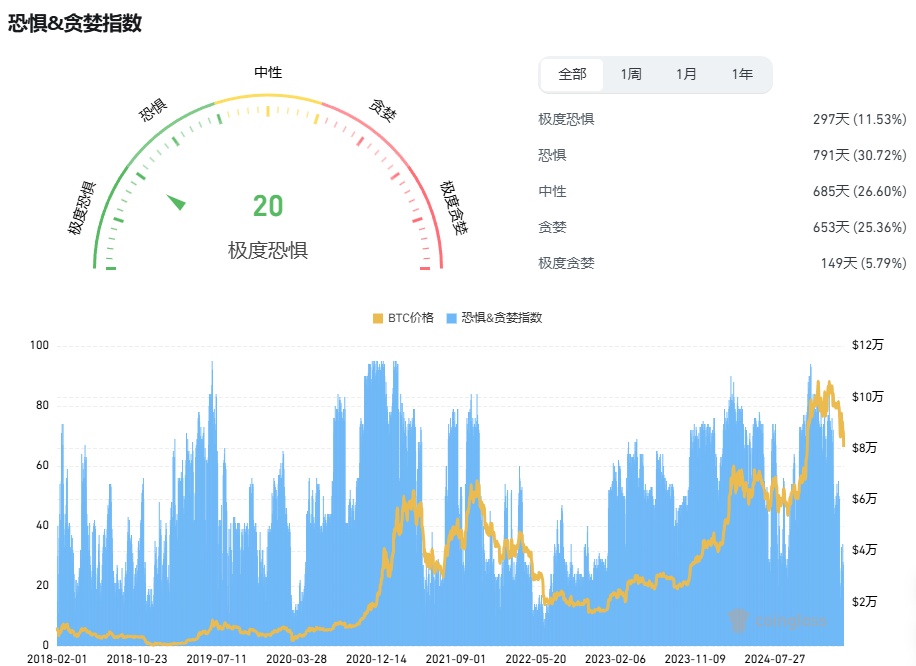
Market sentiment is one of the important indicators for judging trends, and liquidation data, as a direct reflection of market sentiment, provides a key supplement to this analysis. Currently, the Cryptocurrency Fear & Greed Index has fallen to 35, in the "Fear" zone, a significant drop from 70 ("Extreme Greed") a month ago. This index comprehensively reflects factors such as volatility (25%), market trading volume (25%), social media sentiment (15%), survey questionnaires (15%), Bitcoin dominance (10%), and trends (10%), clearly reflecting the rapid deterioration of investor confidence.
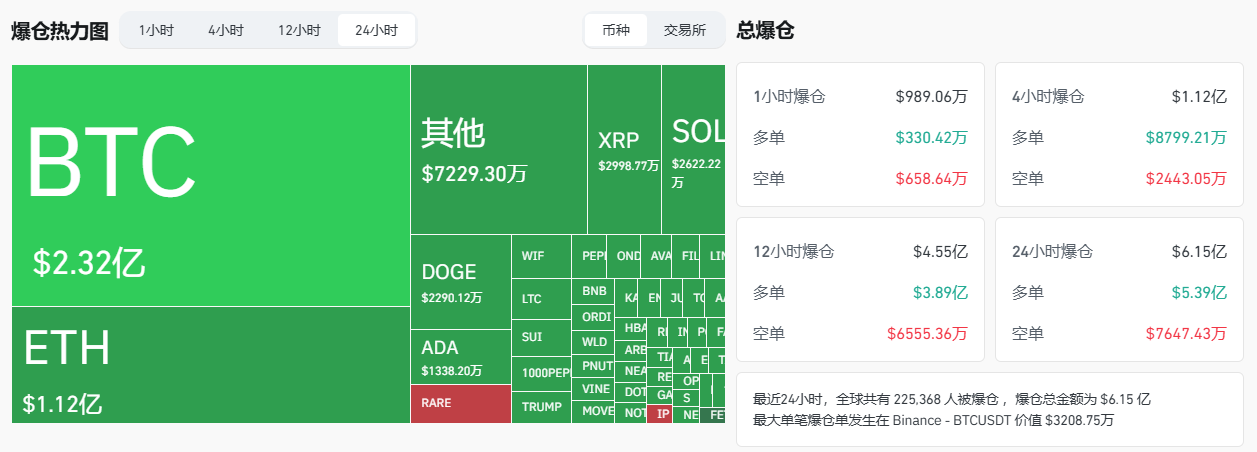
CryptoQuant data shows that the demand growth in the Bitcoin spot market is slowing, and the proportion of short positions in the futures market's open interest has risen significantly. As of March 9th, short positions on CME Bitcoin futures accounted for 45% of total open interest, up 15 percentage points from 30% in early February. This trend of short dominance has exacerbated market panic, with investors' expectations of price declines strengthening, and some even discussing the possibility of Bitcoin falling below the $60,000 psychological barrier. Liquidation data further reveals the market dynamics, with $4.71 million in BTC liquidations and $1.31 million in ETH liquidations in the past hour, totaling $11.55 million, of which $8.29 million were long liquidations and $24.33 million were short liquidations. The predominance of short liquidations may trigger a "short squeeze" leading to a short-term rebound, but the $616 million in total liquidations over the past 24 hours, with $540 million in long liquidations and $76.31 million in short liquidations, reflects the continued pressure of the bear market, consistent with the deterioration of NUPL and the rise in short positions. Short-term volatility and long-term risks coexist, and investors need to be vigilant about the complexity, focusing on the opportunity of short squeezes while guarding against the downside risks of the bear market.
Technical Analysis: Key Support and Resistance
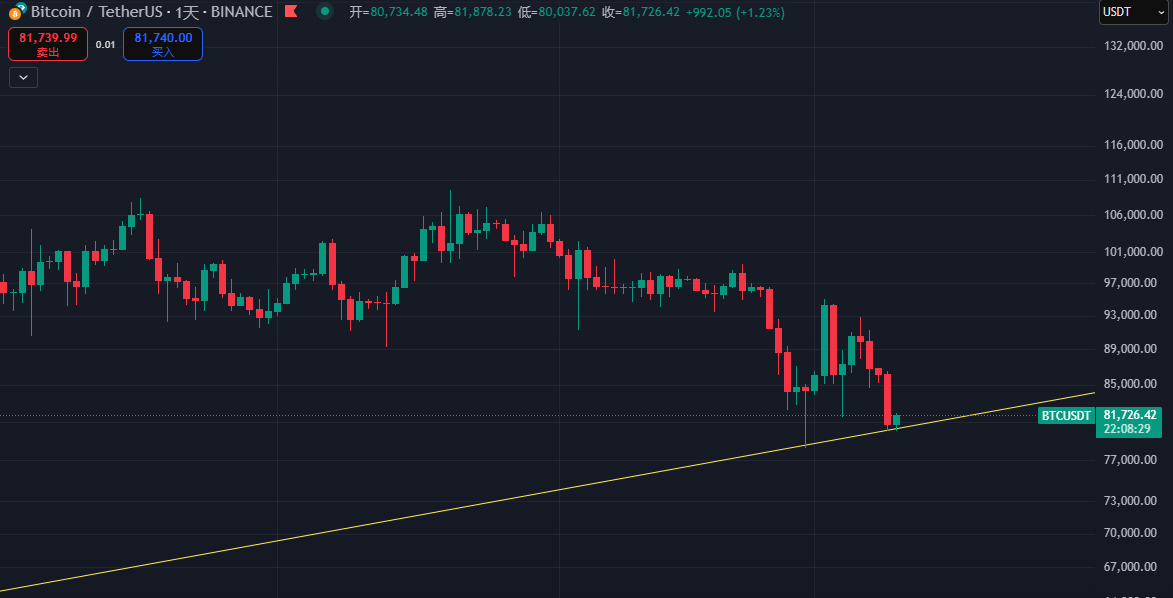
From a technical perspective, Bitcoin's price is at a critical juncture. After the high-volatility range from November 20, 2024 to February 24, 2025, the price has formed a potential Double Top pattern - a typical bearish signal. After the neckline of the Double Top was breached, the price retreated from the high of $82,000 to around $76,000, with the amplitude already close to the expected target (about 10%), but the time dimension has not yet been fully digested.
Analysts generally believe that the market may face two paths:
- Path One: Time for Space
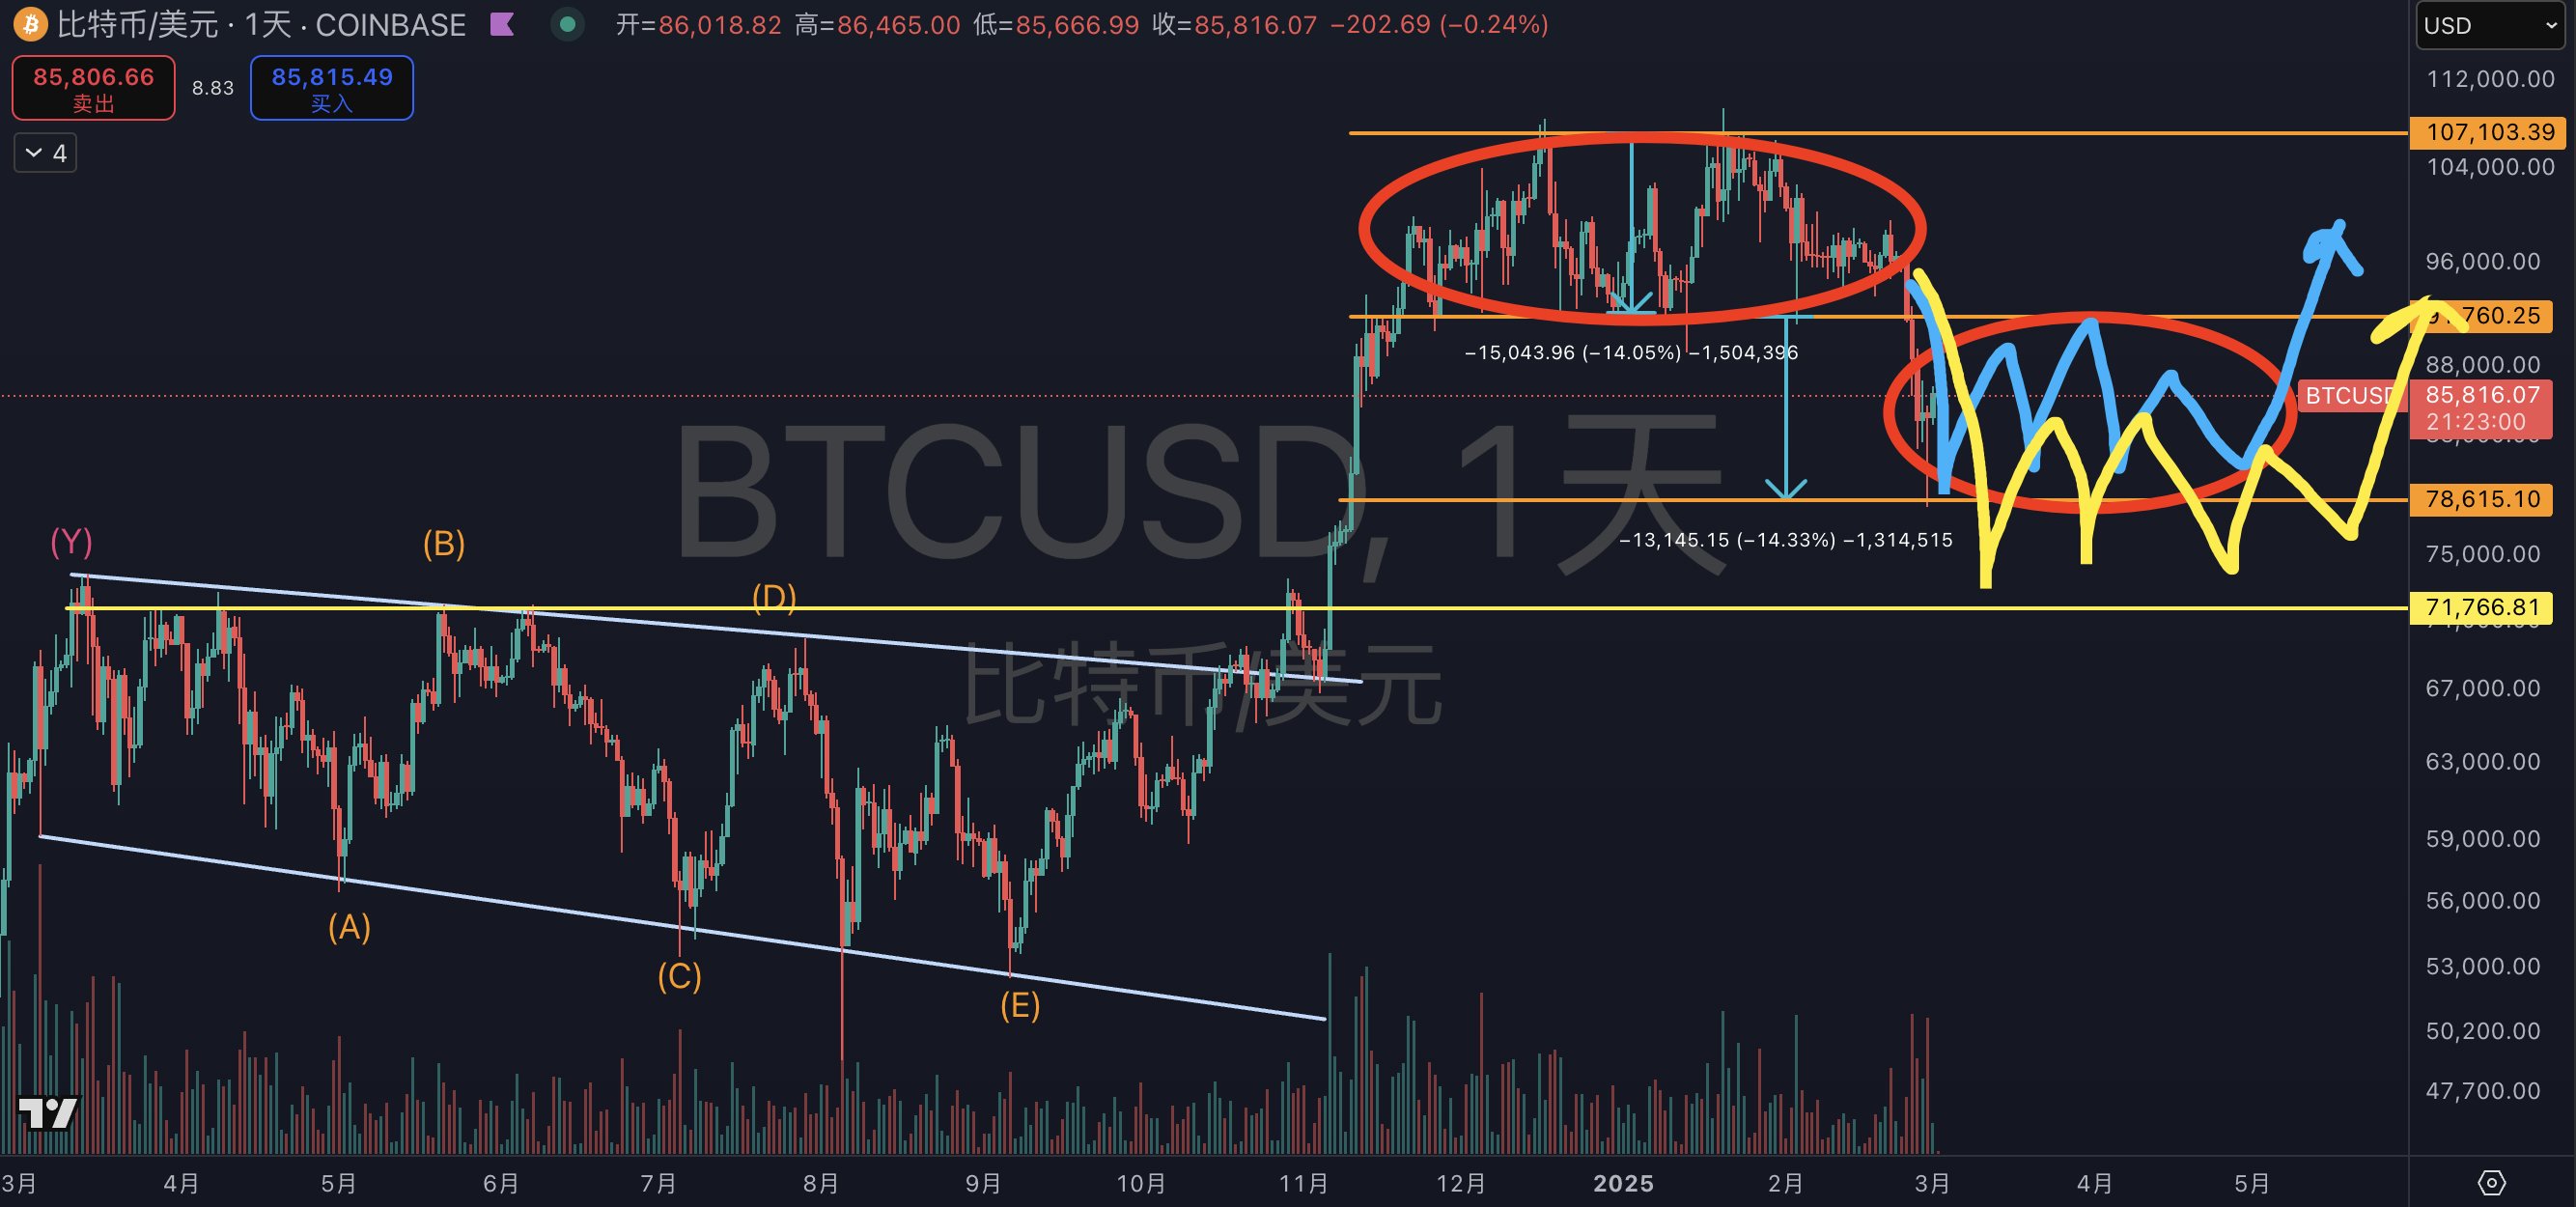
- If $78,000 becomes the bottom, bulls and bears need to wait patiently for two to three months to confirm the trend. Currently, the range between the 50-day moving average (around $77,500) and the 200-day moving average (around $72,000) has become the focus of short-term tug-of-war. If the price can hold above $78,000, it may form a W-bottom pattern, laying the foundation for a subsequent rebound.
- Path Two: Further Downside
- If the bears gain the upper hand, the price may fall to the $70,000-$72,000 left-side trading dense area. This area not only provides support at the 200-day moving average, but also represents an important retracement level after the rebound from the August 2024 lows. Trader Eugene Ng Ah Sio stated in a Telegram group: "I'm not in a hurry to participate in the current price, $75,000 is the only level I'm interested in." This cautious attitude reflects the uncertainty in the market.
In addition, the Relative Strength Index (RSI) is currently at 42, having fallen from the overbought zone (above 70) to a neutral-to-low level, suggesting that the selling pressure has eased somewhat, but has not yet entered the oversold zone (below 30). Technical analysis suggests that investors should remain cautious, avoid blind chasing or buy the dips, and wait for the trend to become clearer.
Macroeconomic Background: Exhaustion of Positive News and Uncertainty
Macroeconomic factors cannot be ignored in their impact on the cryptocurrency market. First, changes in the global interest rate environment are putting pressure on high-risk assets. The yield on the 10-year US Treasury bond has recently risen to 4.2%, up 40 basis points from the beginning of the year, attracting capital to flow back from the crypto market to traditional safe-haven assets. At the same time, inflation expectations remain high, and the Federal Reserve may delay rate cuts, further diminishing Bitcoin's appeal as "digital gold".
At the legislative level, the weakening of positive news has also exacerbated market pressure. For example, the Bitcoin bill in Utah, which was passed by the state Senate on March 7th with 19 votes in favor and 7 against, and is about to be signed into law by the governor. However, its core provision - allowing Utah to hold Bitcoin as a reserve asset - was deleted in the final review. The original provision would have authorized the state treasurer to invest in Bitcoin, with a cap of 5% of its market value (about $25 billion), which could have made Utah the first US state to hold Bitcoin reserves. Now, the bill only retains basic rights such as custody protection and Bitcoin mining/node operation, significantly diminishing its impact.
The exhaustion of macroeconomic positives has undermined market confidence, and external uncertainties (such as potential changes in crypto policy under a Trump administration) are also adding variables to the market. Bloomberg analysts predict that if Trump is re-elected, his tax-cutting and deregulation policies may provide a short-term boost to the crypto market, but the long-term effects remain to be observed.
ETF Outflows: Waning Institutional Enthusiasm
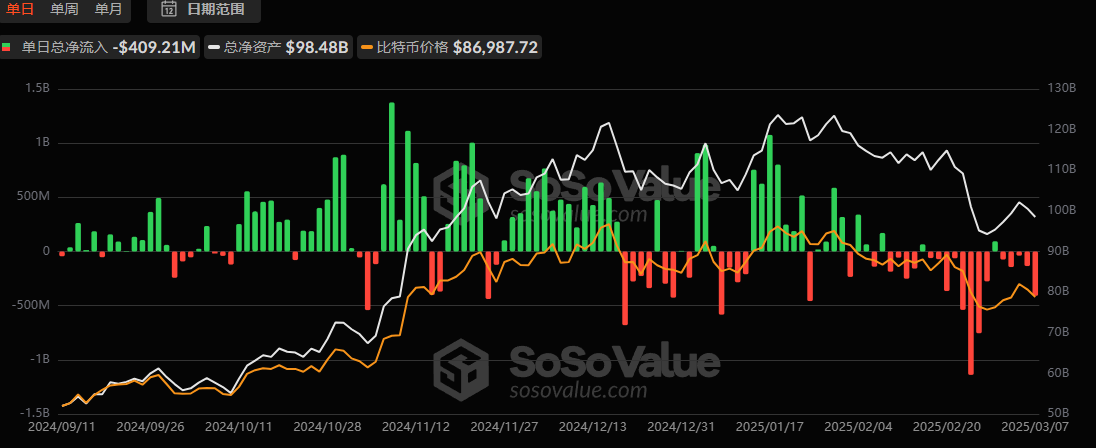
Institutional demand was an important driver of Bitcoin's price rise in 2024, but the recent outflows from physical Bitcoin ETFs are worrying. According to sosovalue data, Bitcoin spot ETFs in the US have seen net outflows of over $500 million since March, with outflows from Grayscale's GBTC being particularly significant. CryptoQuant research head Julio Moreno pointed out: "The growth in Bitcoin spot demand is contracting, while short positions in the futures market are dominating, directly leading to the price decline."
WhaleWire founder Jacob King was even more direct: "The Bitcoin bear market is here. Record ETF outflows, the institutional demand narrative has collapsed, and Bitcoin is headed towards multi-year lows." Although this view is rather extreme, the ETF outflows do reflect a waning of institutional enthusiasm. At the beginning of 2024, ETF net inflows averaged $200 million per day, but have now turned to net outflows, indicating that institutional investors are reassessing the risk-return ratio of crypto assets. This change further undermines market confidence.
On-chain data: Hope and uncertainty coexist
On-chain data provides a glimmer of hope for the market. According to Glassnode's analysis, the behavior of long-term holders (investors holding positions for more than a year) is undergoing a transformation, shifting from the distribution phase to the accumulation phase. As of March 9, the net position change of long-term holders has turned positive, with an average daily inflow of around 5,000 bitcoins. Historically, this shift in trend has often been a reliable signal of the market transitioning from the top to the bottom, such as the bottom formation periods in early 2019 and March 2020.
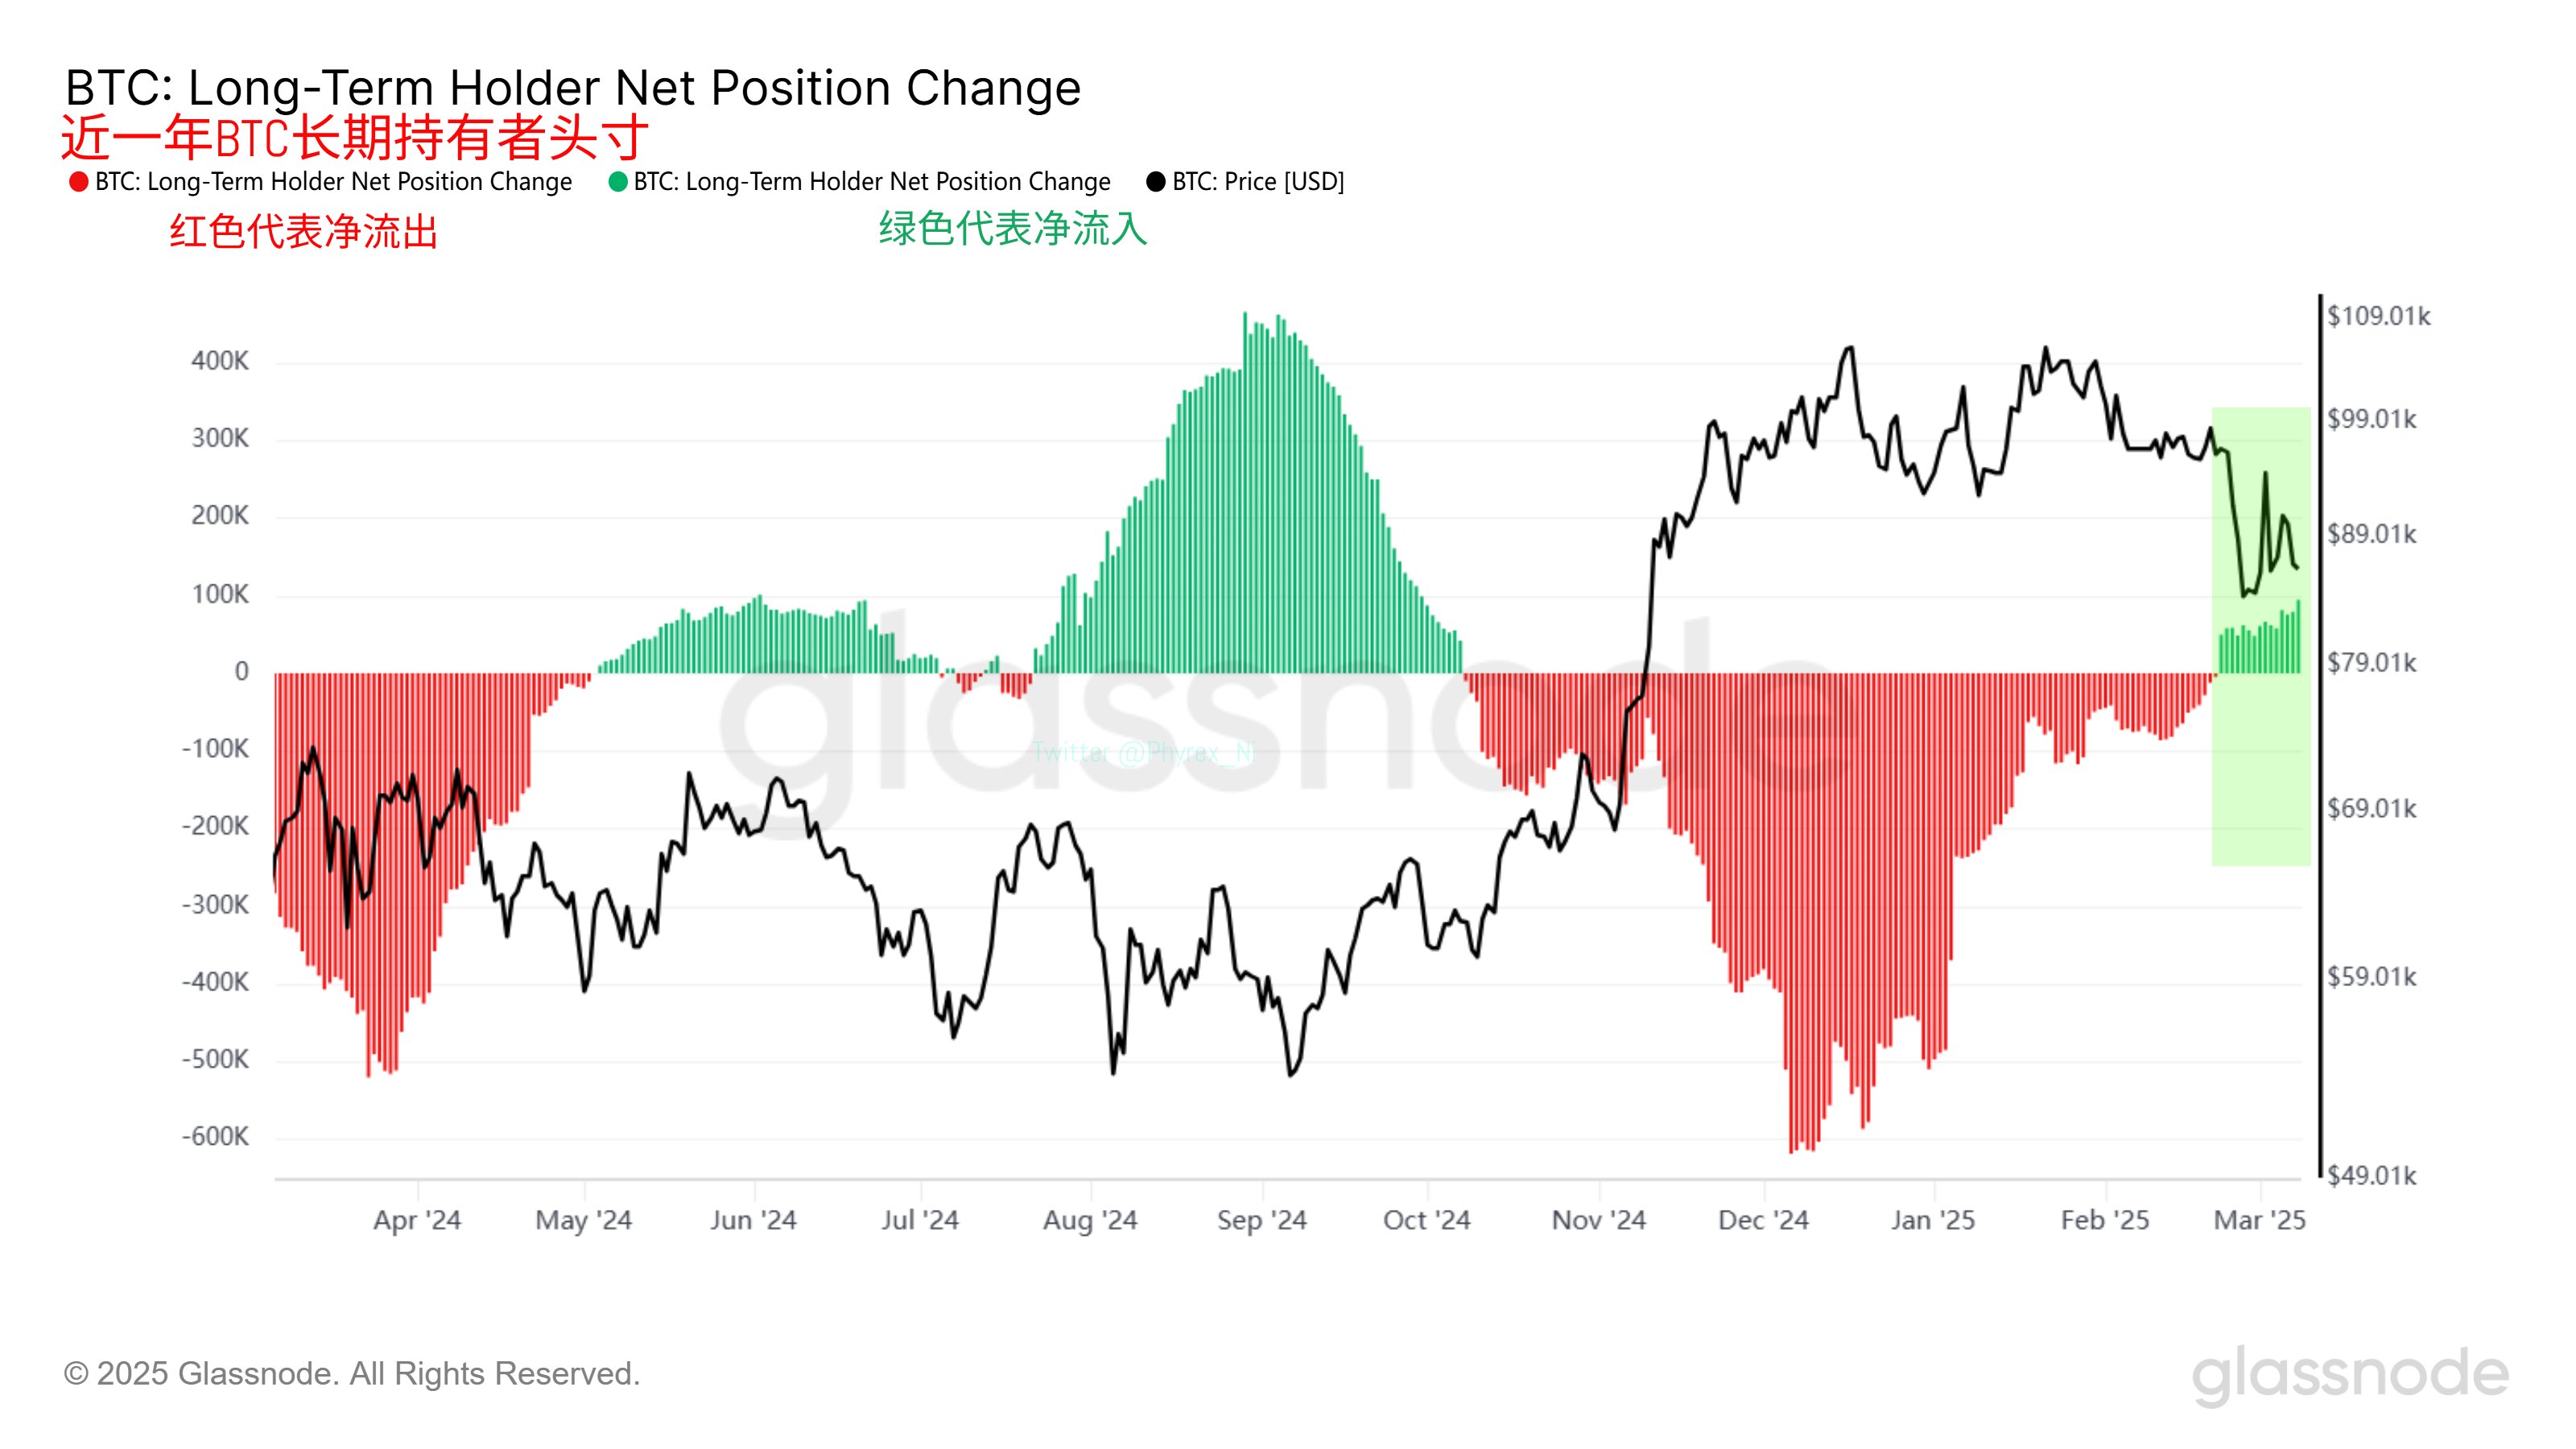
However, the current situation differs from previous cycles. First, the price decline may be gradual and prolonged, and a relative bottom may only be reached when long-term holders' holdings reach a new high (e.g., exceeding 700,000 bitcoins). Second, the rise of spot ETFs has changed the structure of holders. Arkham Intelligence data shows that ETF holders currently control about 4% of the circulating bitcoin supply (around 840,000 bitcoins), while the proportion of traditional on-chain long-term holders has declined from 65% in 2023 to 60%. This may weaken the predictive power of traditional on-chain indicators.
Although the shift of long-term holders to a buying mode is encouraging, the current phase is still in the early stages of inflows, and the possibility of a reversal has not been ruled out. Predictions of the market bottom still need to be verified by additional external signals.
Historical comparison: Similarities and differences in bear markets
Looking back at history, the current market has similarities with the bear markets of 2018 and 2022, but also significant differences. In 2018, Bitcoin plummeted from $20,000 to $3,200, a decline of over 80%, accompanied by the bursting of the ICO bubble and a contraction in trading volume. In 2022, it fell from $69,000 to $16,000, a decline of about 76%, influenced by the FTX collapse and interest rate hikes. Currently, Bitcoin has declined about 7%-13% from its peak of $82,000, far from the historical bear market levels.
The similarities lie in the decline in trading volume and market segmentation. For example, in 2018, CEX trading volume declined 70% from its peak, while currently, it has only declined 23.7%. The differences are in the increased institutional participation and the emergence of ETFs, which have provided new buffer mechanisms for the market. Therefore, the current panic may be an adjustment period rather than a full-blown bear market, but if ETF outflows continue to escalate, the historical tragedy may repeat itself.
Whether the market has entered a bear market remains inconclusive. The technical analysis shows that the risk of a correction still exists, with key support levels at $78,000 and $75,000 being tested. At the macroeconomic level, positive news is limited, ETF outflows are intensifying, and the institutional narrative is weakening. While on-chain data suggests a recovery in the confidence of long-term holders, the bottom is not yet clear. The current panic may be a harbinger of a deeper adjustment, or it could be the darkness before the dawn.
For investors, caution is paramount. As Miles Deutscher said, "This is a rotating market, and holders are being punished." Rather than chasing short-term volatility, it is better to focus on the intersection of technical support, macroeconomic dynamics, and on-chain signals. Drawing on the wisdom of Warren Buffett - "Be fearful when others are greedy, and greedy when others are fearful" - in the turbulent waves of the crypto market, risk management and a long-term perspective are the keys to survival.


