

The market, project, cryptocurrency and other information, opinions and judgments mentioned in this report are for reference only and do not constitute any investment advice.
Written by 0xWeilan
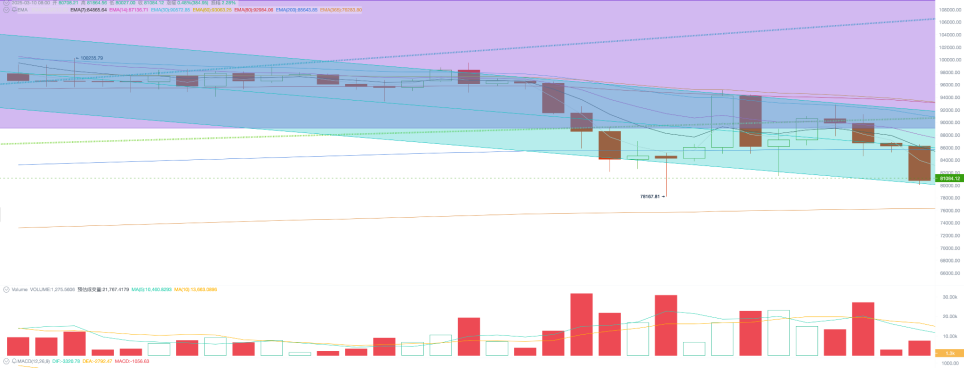
This week, BTC opened at $94,265.47 and closed at $80,699.17, a weekly plunge of 14.39% with a volatility of 15.29%. Trading volume decreased slightly from the previous week but remained at a high level. The BTC price broke below the "Trump bottom" (the $89,000-$110,000 range) and retreated significantly from the "Trump trade" rally.
Over the past two weeks, BTC has been experiencing a torment of fire and ice.
On the one hand, with the back-and-forth and chaos of Trump's tariff policy, the US stock market has started to trade in an "economic recession" and has given back most of the gains since the "Trump trade", leading to the largest outflow of BTC Spot ETF since its inception.
On the other hand, Trump signed the "BTC Strategic Reserve Executive Order" and hosted the first White House Cryptocurrency Summit, conveying many positive information on cryptocurrency regulation and use cases, and Texas also passed a state-level BTC reserve bill, so it can be said that the use cases and policy environment for cryptocurrencies, including BTC, in the US are improving.
However, investor sentiment has dominated the short-term price trend. Accompanied by the US stock market "unwinding the Trump trade", BTC also plunged 14.39% this week, the second largest weekly decline of the period, although it did not fall below the lowest point on February 28, it has already broken through the "Trump bottom" and the 200-day bull-bear dividing line. The Fear & Greed index has fallen back to the "extreme fear" level of 20 points.
With the release of the non-farm payroll data on Friday and the "dovish" remarks by the Fed chairman, the US stock market has temporarily stabilized, but the medium-term outlook is still not optimistic, depending on the trend of Trump's tariff policy and US economic data. BTC's performance will continue to be subject to the US stock market trend and does not have the conditions to break out an independent market.
Macroeconomic and Economic Data
On Friday, the US job market showed further signs of slowing down. The February non-farm payrolls increased by 151,000, slightly lower than market expectations, and the unemployment rate unexpectedly rose from the previous 4% to 4.1%, a new high since November last year.
Subsequently, Fed Chairman Powell stated that although facing uncertainties, the current US economic situation is still good, the job market is in a healthy balance, and the Fed should remain cautious and patient at this stage without the need to urgently adjust the policy interest rate, as the cost of maintaining caution is "very, very low". The uncertainty caused by changes in Trump's policies remains high. The Fed is evaluating the impact of changes in trade policy, which have exacerbated economic uncertainty.
This statement continues the Fed's consistent stance and contains no new information. But it may be due to responding to the US stock market decline and market fears of a recession, it subsequently released a "dovish" statement.
Powell said that if the economy continues to remain strong and inflation does not further decline to the 2% target, the Fed may maintain the current benchmark interest rate. However, if the job market unexpectedly weakens or inflation declines significantly in the future, the Fed will consider resuming rate cuts.
Based on the weakening economic data and the US stock market adjustment, the CME Fed Watch shows that traders' latest bets on the Fed cutting rates this year have reached 3 times, about 75 basis points.
As a result, the US dollar index fell 3.52% for the week, closing at 103.882. The Nasdaq rebounded on Friday, closing above the annual line after breaking through it. The S&P 500 closed above the 200-day line after breaking through it. The 2-year US Treasury yield rose slightly, and the 10-year US Treasury yield rose above 1.89%.
The non-farm payroll data on Friday has slightly improved the traders' previously significantly reduced expectations. But concerns about a US recession or stagflation have not been eliminated, at most a correction to the previous significant downward pricing. Whether the rebound in US stocks and BTC can be sustained needs further observation, and more economic data is needed to determine if a bottom reversal can be achieved.
A psychological support for the long positions is that the "Trump trade" rally in the US stock market has been fully unwound. The three major indices have returned to the levels before Trump's victory on November 5.
Technical Analysis
Compared to the US stock market, BTC has maintained relatively strong performance, with the current price still about 15% higher than the November 5 high.
Technically, BTC's performance is still not optimistic. It has fallen out of the "Trump bottom" and is trading below the first uptrend line (the deep green dotted line in the chart). Moreover, since the historical high on January 21, BTC has formed a descending channel (the green box in the chart), which has repeatedly suppressed BTC's rebounds.
On Sunday evening, the bears attacked the market again, and BTC fell sharply below the 200-day moving average. This adjustment intensity and weak performance are similar to the market performance in July-September 2024. The market is currently in an extremely oversold state, but it may require more external conditions and time to break out of the downtrend.
Selling Pressure and Selling
After the panic selling following the breakdown last week, the selling pressure has decreased significantly this week. The long and short positions have sold a total of 147,351 BTC, returning to the previous normal level. However, the exchange balance increased by more than 5,000 BTC, indicating that although the selling pressure has decreased, the buying power is still insufficient.
According to on-chain data, the overall market unrealized profit rate is 198%, the long position is 347%, and the short position is in a 6% unrealized loss. The short positions are still under pressure. In a bull market, when the short positions are in an unrealized loss, it is often a good opportunity to enter the market in the medium term.
Stablecoins and BTC Spot ETF
Compared to the net outflow of $4.081 billion from the dual-channel last week, this week the high-pressure situation has eased to some extent, with a net inflow of $1.295 billion, of which $2.107 billion flowed into stablecoins and $719 million flowed out of BTC Spot ETF. The outflow from the BTC Spot ETF channel is the source of the selling pressure that has led to the market decline.
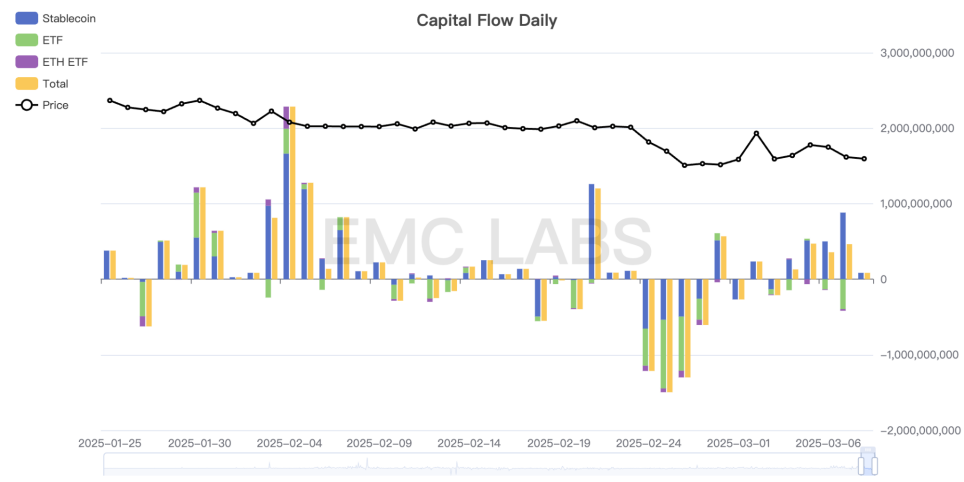
Crypto Market Capital Inflow and Outflow Statistics (eMerge Engine)
In February, 11 US BTC Spot ETFs experienced the largest outflow since their approval, totaling $2.3 billion. After entering March, the outflow is still continuing but the scale has decreased. The outflow group includes retail and institutional selling, as well as the unwinding of CME contract arbitrage traders. In terms of the transmission path, for BTC prices to stabilize, the US stock market needs to stabilize, and ETF holders need to shift from net outflow to net inflow.
Cycle Indicators
According to the eMerge engine, the EMC BTC Cycle Metrics indicator is 0.375, indicating that the market is in an upward consolidation phase.

EMC Labs (Emergence Lab) was founded in April 2023 by crypto asset investors and data scientists. It focuses on blockchain industry research and Crypto secondary market investment, with industry foresight, insights and data mining as its core competencies, committed to participating in the thriving blockchain industry through research and investment, and promoting blockchain and crypto assets to bring well-being to humanity.
For more information, please visit: https://www.emc.fund


