Author: TechFlow
Welcome to another day of the dips.
Today, the crypto market is shrouded in gloom, with the price of Bitcoin (BTC) coming under pressure again, briefly falling below $84,000, with a daily drop of nearly 3 percentage points.
Amid the turmoil of internal and external troubles, negative news keeps coming: practitioners are leaving their jobs, project parties and market makers are embroiled in scandals, KOLs are publicly fighting over unfair profit distribution, and market trust is on the verge of collapse.
The chill is starting to reach every retail investor again.
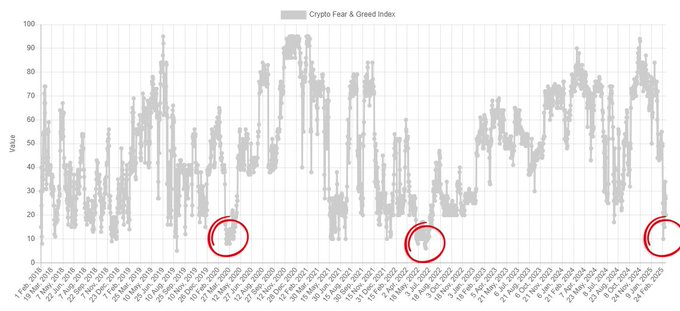
Data shows that the current level of market fear is on par with the COVID-19 crash in 2020 and the market bottom in 2022, with the Fear & Greed Index at 20, indicating extreme fear;
However, the US's recent announcement of establishing a Bitcoin reserve has ignited hope for some investors.
As a barometer of the crypto market, looking at the BTC price, it seems to have risen a lot compared to a few years ago, relatively more like a Bull market; but if you look at the fluctuations in the recent period, it feels like a Bear market.
Now, is it the prelude to a Bear market or the golden pit of a Bull market?
Faced with violent price fluctuations and uncertainty, what should we do? Let's listen to the multi-faceted views of domestic and foreign traders, KOLs, and industry KOLs, analyze the market trends, and see what they have to say.
Wait-and-See Camp
"What are you doing?"
"I'm waiting for Godot."
"When will he come? I don't know. He told me he'd come, and I'm waiting here for him."---"Waiting for Godot"

Samuel Beckett's classic play "Waiting for Godot" tells the story of Vladimir and Estragon endlessly waiting for "Godot" - an uncertain, never-appearing entity.
For retail investors, this Godot is called BTC.
In the face of BTC's violent price fluctuations and the shroud of fear, some have chosen to wait and see.
For example, @Phyrex_Ni believes that everyone should be patient and wait for market signals to arrive, avoiding blind action.
In his latest analysis, he clearly pointed out that for ordinary investors who are not good at short-term trading, waiting and observing may be the safest choice. He believes that BTC is currently in a "garbage time" phase, similar to the doldrums from $73,000 to $50,000 in 2024, with extremely low market sentiment and a lack of clear positive drivers in the short term.
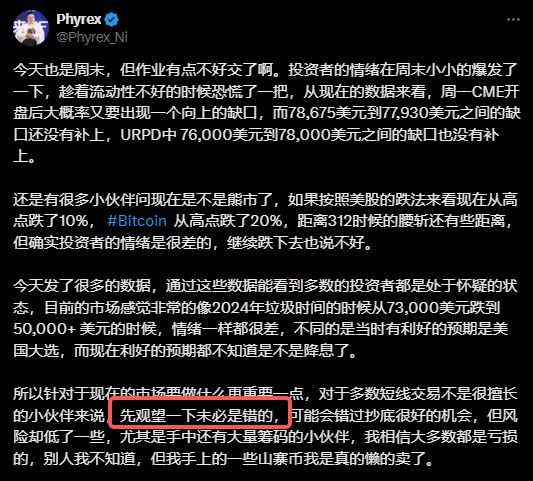
As for why to wait, the reason is the extreme uncertainty in the market.
Phyrex pointed out that with BTC's price breaking below $84,000, investor sentiment has been repeatedly hit, the positive effects of the strategic reserve implementation have faded, the expectations of the US election have turned into negative factors, and macroeconomic data (such as CPI, PPI, and the Fed's dot plot) are still the dominant narrative. Combined with the recent stock market decline and trade war (tariff) pressure, the crypto market may face further volatility, and recklessly buying the dips or increasing positions carries high risks.
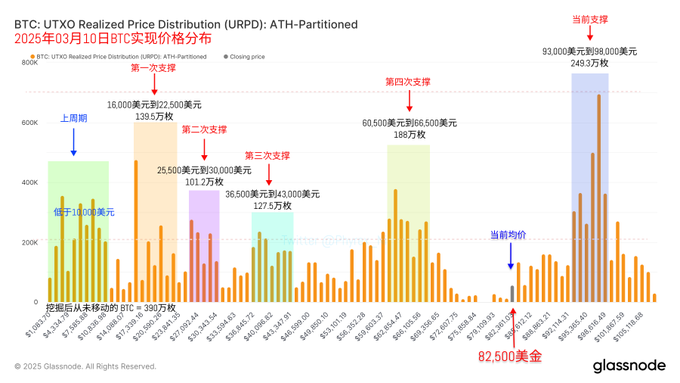
The data also supports this view.
The unrealized profit distribution data shows that there is an unfilled price gap between $76,000 and $78,000, which may be a short-term support area; the dense chip area between $93,000 and $98,000 has lost its support.
Another key data insight is that the BTC turnover rate in the last 24 hours has been relatively low, so the price drop is not due to large-scale user liquidation.
Considering more factors, although buying the dips is attractive, the risks and returns need to be carefully weighed.
Bullish on the Golden Pit
In the midst of the dips, there are always bloodied chips, and the optimistic ones also believe that the current BTC is in a stage-wise low, worth adding positions or even buying the dips.
@neso: The current price level is a golden pit
The well-known KOL @neso clearly pointed out in his analysis that the current BTC price is in a "golden pit", which is an excellent opportunity for long-term investors.
"The US stock market and the crypto market are both experiencing a withdrawal of hot money, which may have come for the Trump administration's policies and flowed into hot assets like Nvidia and BTC. After Trump took office, the uncertainty of policies caused the hot money to withdraw, resulting in the current nearly 30% correction. But for crypto, it is actually in the best policy environment since its inception, and the current correction is obviously collateral damage, which is a golden pit from a long-term perspective."

This view is not without merit.
The US's recent announcement of establishing a Bitcoin reserve, the White House crypto summit, and the SEC's withdrawal of SAB 121 accounting rules mark the best policy environment in the history of the crypto industry.
Although in the short term, the market feels that the stimulus of these policies is not strong enough, but if you think back to the crypto industry's previous difficult days, it has really improved a lot.
More policies may provide a solid foundation for the long-term rise of BTC.
In addition, BTC's 30% correction is described as "collateral damage", mainly due to the drag of the US stock market and macroeconomic factors (such as the trade war and monetary policy tightening), rather than fundamental problems in the crypto industry itself. Historical data (such as the Bear market bottom in 2022 and the rebound after the COVID-19 crash in 2020) shows that similar corrections are often long-term buying opportunities.
@Trader_S18: Long at $81,000
Trader @Trader_S18 took more direct action, posting on X that based on the recent market trend:
"I went long at $81,200 this morning based on the judgment that the price will fluctuate between $80,000-$100,000 recently."
He believes that BTC's recent price has formed a wide range of oscillation between $80,000-$100,000, and the current price pullback to $81,200 is close to the lower limit, with a relatively high risk-reward ratio, suitable for going long.
According to the 4-hour candlestick chart and trading volume data, there may be support around $81,000, providing technical basis for the long position.
Of course, the long strategy of the trader master may be more suitable for experienced short-term traders, and the entry point of $81,200 is indeed close to technical support, but the risks are also obvious: if the market continues to explore the $76,000-$78,000 area, it may trigger the stop loss.

For ordinary players who are buying the dips at the current price level, let's hope this is not a wait to be "slaughtered" long.
$75,000 Entry Camp
In addition, there is another view that around $75,000 will be a key price area for BTC that needs close attention.
Arthur Hayes: Violent changes in the market may occur around $70,000-$75,000
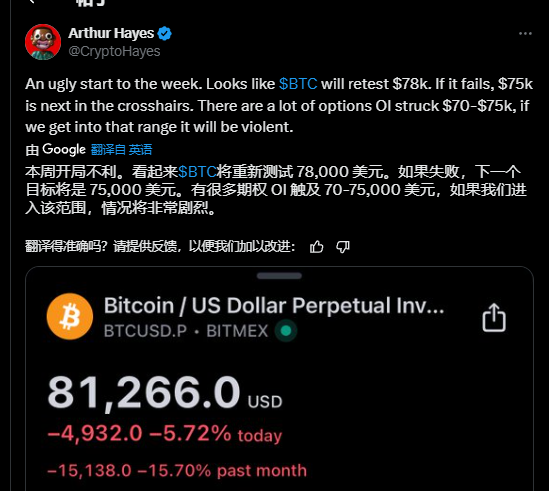
According to his post and related trend data, Bitcoin's price has retreated from its high and broken below $81,000, and may further test $78,000 or even $75,000.
Hayes' analysis shows that if Bitcoin's price falls to the $70,000-$75,000 range, due to the large number of open interest (OI) options contracts concentrated in this range, the market may experience violent price fluctuations.
Here, Hayes is referring to the fact that in the Bitcoin options market, there is a large amount of open interest (OI) with strike prices concentrated in the $70,000 to $75,000 range. This means that many traders or investors have purchased Bitcoin call options or put options, with the strike prices set in this price range.
When Bitcoin's price approaches or enters the $70,000-$75,000 range, these outstanding option contracts may trigger large-scale trading activity. If the options are close to expiration and Bitcoin's price is close to these strike prices, the holders may choose to exercise the options (buy or sell Bitcoin), or market participants may hedge their positions by closing out their positions.
This could lead to significant volatility (sharp rise or fall) in Bitcoin's price.
A large concentration of OI in a certain price range suggests that the market may face liquidity pressure. If many traders simultaneously try to buy or sell Bitcoin to hedge or close options, it could lead to rapid price fluctuations, and even a "squeeze" phenomenon.
Therefore, Hayes' warning indicates that investors may need to be prepared for severe price volatility and consider whether to "buy the dips" or wait for a more stable price range.
Eugene Ng Ah Sio: Wait until 75,000 to talk about it
Trader Eugene Ng Ah Sio stated in the TG group that he is not in a hurry to participate in trading at the current price level. Eugene reiterated that, as mentioned earlier, the $75,000 price level is the only level he is currently interested in.
Some Bullish Indicators
If you simply need some psychological comfort or encouragement, you can take a look at these Bullish indicators.
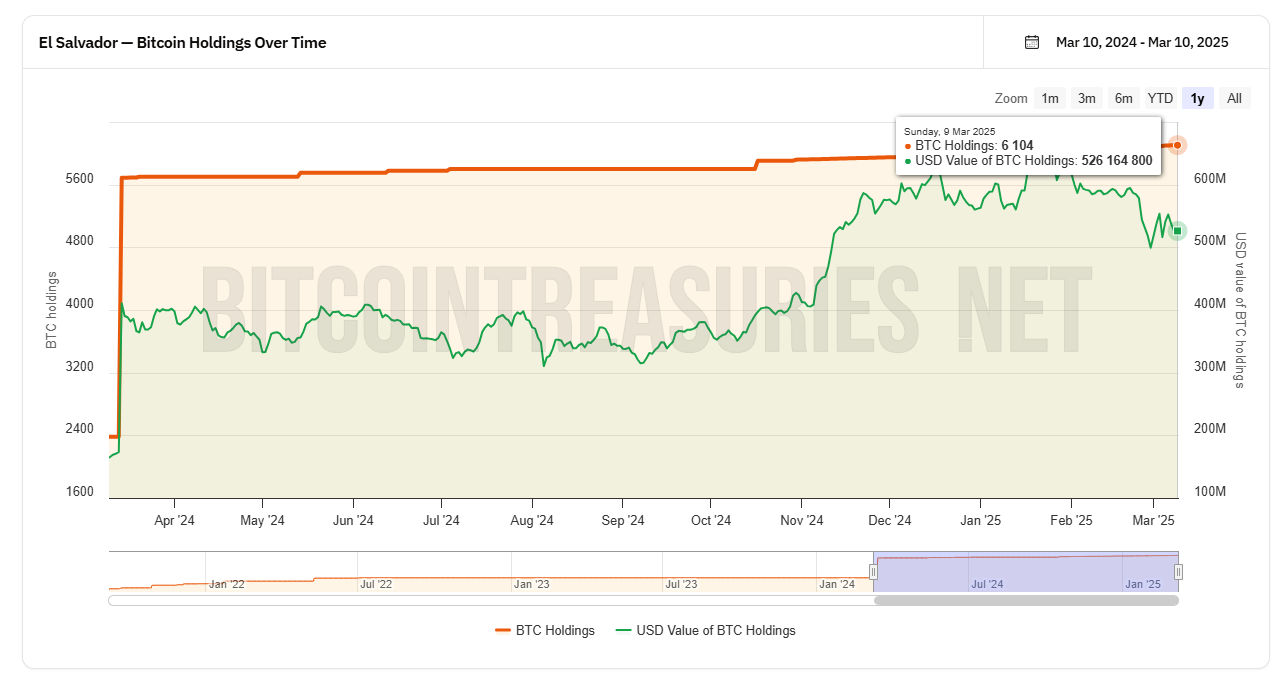
Firstly, the country of El Salvador has added another 5 #BTC to its holdings today, bringing its total holdings to 6,111 BTC; the chart shows that El Salvador is clearly a committed DCA (dollar-cost averaging) player, buying small amounts but consistently.
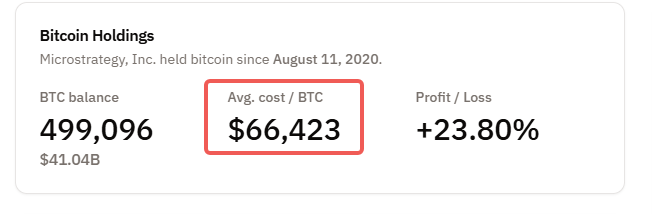
Another perma-bull micro-strategy does not need much explanation, as they have made several large-scale additions to their BTC holdings from the end of last year to the beginning of this year.
Their CEO, Michael Saylor, was recently photographed looking dejected while participating in a related meeting with former President Trump, perhaps he is the one who hopes BTC will continue to rise.
But don't worry, the data shows that the micro-strategy's average holding cost is around $66,000, so they haven't lost money yet.
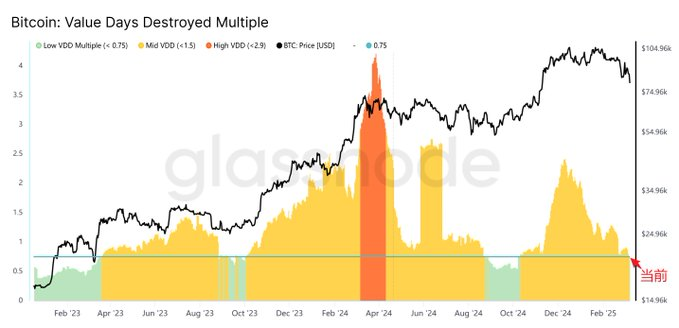
Additionally, according to on-chain data analysis, the current BTC VDD Multiple has entered the bottom range, approaching historical lows (such as below -2.9). This is similar to the market bottom in the 2022 bear market and the post-COVID crash in 2020, indicating that the market is in a state of extreme fear and low liquidity.
Combining the recent BTC price drop of about 20% from $90,000 to below $84,000, and the trading volume on exchanges not seeing a significant increase, the VDD indicator shows that investors are reluctant to sell, and the coins are concentrated, which may trigger a rebound in the short term.
The VDD Multiple is the ratio of the 30-day average VDD to the 365-day average VDD. This ratio reflects the comparison between the recent spending rate and the annual average spending rate, used to identify the cyclical highs and lows of the Bitcoin market.
Finally, in the volatile market conditions, the views of the above parties can only be used as a reference. The editor still believes that caution is the best policy, and it is better to miss out than to lose the principal.
The price may still be there, but the position must not be lost.