Author: Bing Ventures Source: medium Translation: Shan Ouba, Jinse Finance
Disruption of the value discovery cycle . Traditionally, value discovery for newly listed tokens on centralized exchanges (CEX) takes weeks. However, next-generation platforms are compressing this cycle to the extreme.
Platform life cycle reconstruction . The "flash-lock-evolve" model is replacing the traditional "boom-stagnation-decline" model. Data shows that successful projects no longer pursue continuous high growth, but achieve rapid value acquisition and lock-in, and quickly accumulate value before transitioning to the product evolution stage.
Innovation in valuation logic . Traditional valuation methods based on transaction volume and fee income are outdated. Analysis shows that the correlation between project value and user interaction depth (R²=0.87) is higher than traditional indicators such as transaction volume (R²=0.58).
Transformation of ecosystem construction . Traditional CEX adopts a centralized and hierarchical model. In contrast, the ecosystem under the new paradigm is "lightning expansion". Data from Hyperliquid shows that the launch cycle of its ecosystem projects has been shortened to one-fifth of the traditional model, and the value acquisition efficiency has increased threefold.
Recently, a new generation of decentralized derivatives trading platforms such as Hyperliquid and Vertex Protocol have emerged and become strong competitors in the market. In particular, Hyperliquid has achieved explosive growth in TVL from US$50 million to US$300 million in less than four months, with an average monthly protocol revenue of US$43.89 million. This phenomenon has triggered a deep reflection on the development model of derivatives platforms: Why can Hyperliquid achieve rapid growth in the current market environment, while early leaders such as GMX and dYdX are gradually losing momentum, even though they both use the order book mechanism and build application chains?
Through an in-depth analysis of three generations of mainstream derivatives platforms (dYdX, GMX, Hyperliquid), we found a significant trend: derivatives platforms are undergoing a paradigm shift from "technology-driven" to "community sovereignty". This shift is not only reflected in the token distribution model, but also deeply reflects the evolution of the crypto market's understanding of decentralization. After the collapse of FTX, the need for true decentralization and community governance is more urgent than ever.
This study aims to reveal the following through a multi-dimensional analysis of operational data, user behavior, and market performance over the past three years:
Is moving towards community sovereignty an inevitable trend for derivatives platforms?
How does this shift affect the platform valuation logic?
By comparing data from different periods, we found that there is a significant correlation between the degree of community sovereignty and platform valuation. This correlation is not only reflected in token prices and TVL, but also has a profound impact on user retention and ecosystem expansion capabilities. This study will systematically explore the underlying logic behind this phenomenon from both quantitative and qualitative perspectives.
Deconstructing the “superfluidity phenomenon”
Hyperliquid is a high-performance Layer 1 blockchain whose core application is an on-chain order book perpetual exchange. Its goal is to build a fully on-chain open financial system.
Key Features:
Layer1 public chain
As a decentralized financial system, Hyperliquid Layer 1's key features include fully on-chain margin storage and matching engine status, no reliance on off-chain order books, consistent transaction ordering and low-latency operations (median latency 0.2 seconds, 99% latency 0.9 seconds) through the HyperBFT consensus algorithm, and support for up to 100,000 orders per second.
Super EVM
HyperEVM supports general EVM functions, allowing ERC20 tokens to correspond directly to native spot assets. Users can trade through native spot order books and seamlessly use the same assets in EVM-based applications. Currently, HyperEVM is in the testnet stage and has not yet been launched.
On-chain order book perpetual exchange
Hyperliquid currently supports trading of more than 100 assets, and new asset listings are determined by community proposals. Token listings are conducted through Dutch auctions, with bidding for listing rights every 31 hours. The maximum leverage provided varies by asset, ranging from 3x to 50x.
HIP-1
HIP-1 is Hyperliquid's native token standard, which is intended to be used as the gas fee standard for public chains in the future. The token is still in the testing phase, during which USDC is used as the gas fee.
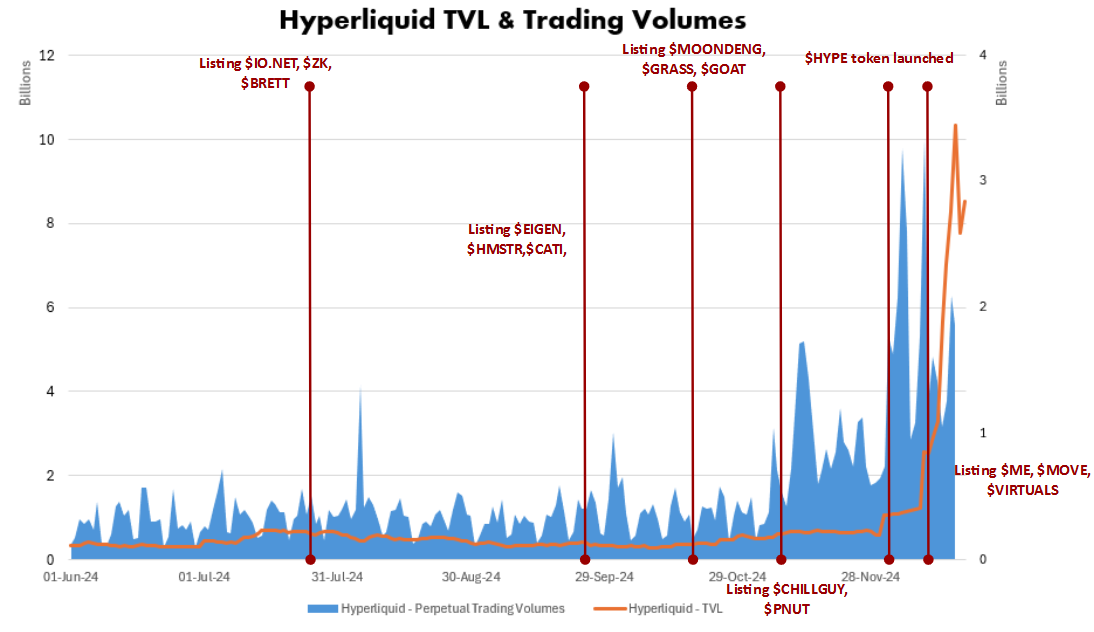
The Hyperliquid team has demonstrated keen market insight by consistently offering perpetual trading for popular tokens. However, this has not been the primary driver of Hyperliquid’s TVL and trading volume growth. For example, during the launch of $EIGEN and $IO.NET, TVL did not experience significant growth. The only notable growth occurred when the ecosystem token $HYPE was listed for spot trading. It tripled from $190.96 million on November 29 in just three days. Trading volume peaked at nearly $10 billion on December 5. In a bullish environment, Hyperliquid listed tokens for Magic Eden, Movement, and Virtual Protocols, driving TVL to an all-time high of $3.4 billion, highlighting its huge potential for ecosystem expansion.
Although listing popular tokens is not the main driver of trading volume and TVL growth, other competitors such as GMX and Jupiter do not generally provide trading opportunities for popular tokens. This distinction makes Hyperliquid a potential leader in the field, recognized as the on-chain platform with the most similar user experience to centralized exchanges, laying a key foundation for future growth.
Protocol income sources
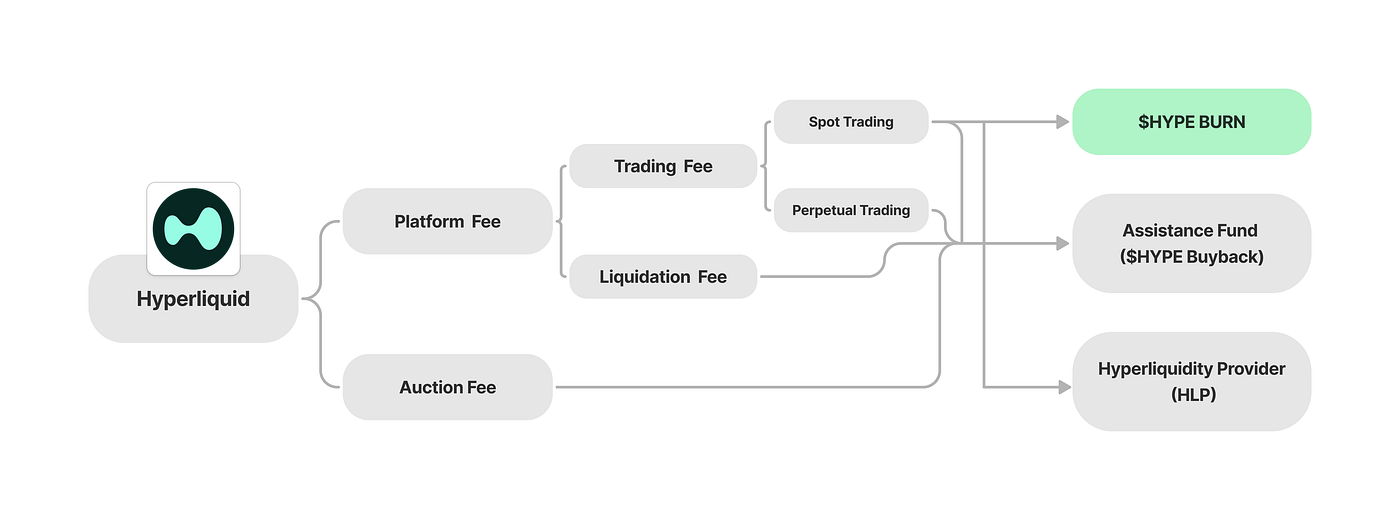
The project’s main revenue sources include platform fees and token listing auction fees.
For the listing auction, projects aiming to list their tokens on Hyperliquid must participate in a Dutch auction, with the proceeds from the auction credited directly to Hyperliquid’s revenue.
The platform's revenue comes from transaction fees for spot and perpetual trading, as well as liquidation fees during settlement.
For HIP-1 standard tokens that are not denominated in USDC in spot trading, since there is no specific mechanism to direct these funds to HLP, the proceeds will be considered token destruction.
All other fees paid by the project team will go directly to HLP, creating profits for liquidity providers and vaults that employ various trading strategies.
In addition, part of the profits are allocated to the aid fund for the repurchase of $HYPE tokens, reducing the circulating supply and enhancing value stability and ecological growth potential.
Listing Auction Fees
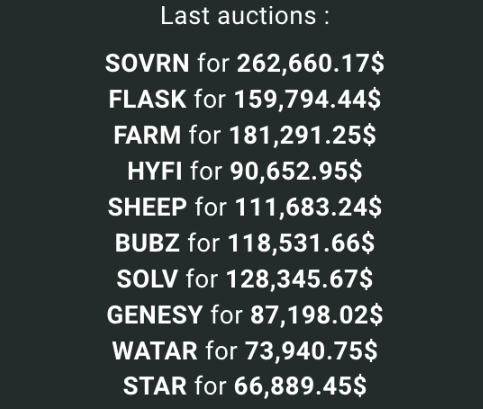
The maximum listing auction fee can reach $262,000 , which reflects the important value of Dutch auctions in the token listing process. The main advantages of this model include:
Transparency and fairness : All participants have equal bidding opportunities, effectively preventing price manipulation and ensuring a fair auction process.
Decentralization : Auctions are executed through smart contracts on the blockchain to reduce reliance on intermediaries and enable trustless decentralized transactions.
Anti-fraud : The auction process prevents sellers from submitting false bids, thereby improving the credibility of the auction.
Transaction Fees
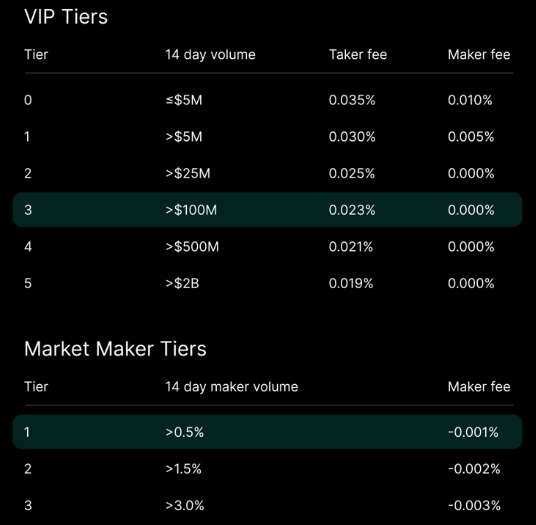
Spot and perpetual contracts use the same tiered transaction fee structure, ensuring that users experience consistent fees across different transaction types. This simplifies the fee system and improves user experience.
Liquidation Fees
When a trader's account balance falls below the maintenance margin, the system will liquidate all or part of the position through a market order.
If the funds after forced liquidation meet the maintenance margin, the remaining amount will be returned to the trader.
If the account balance drops below 2/3 of the maintenance margin and the market order cannot be liquidated, a stop loss liquidation will be triggered and the position will be transferred to the liquidator vault.
Liquidation fees increase platform revenue, while profits generated by liquidation backlogs flow into HLP, providing returns to the community.
Token Burning
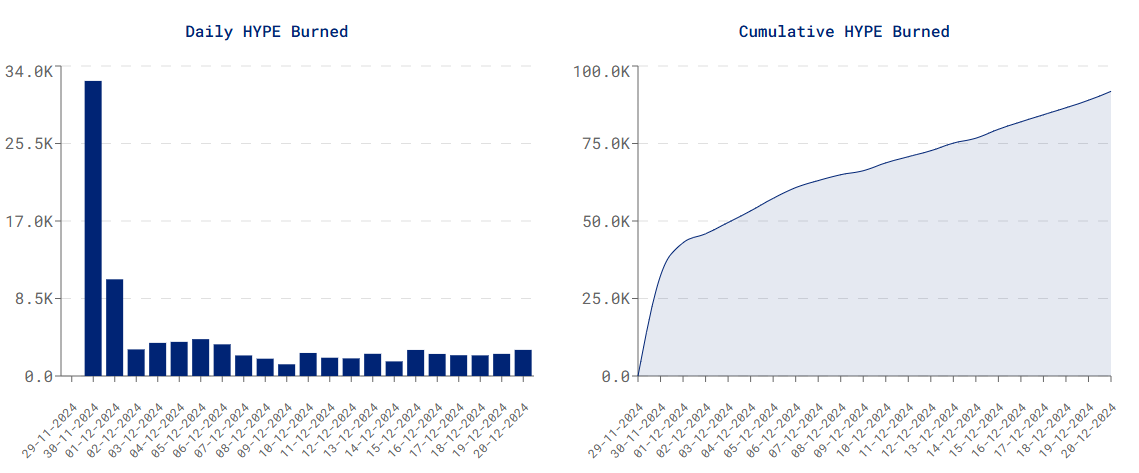
On the day of $HYPE listing, 34K $HYPE tokens were destroyed, reflecting strong market demand.
Over 90K $HYPE have been destroyed, representing 0.03% of the circulating supply.
Although the current destruction rate is not high, this mechanism will play a vital role in controlling the token supply in the future.
As demand for HIP-1 standard tokens continues to grow, the burn rate is expected to increase, creating a positive feedback loop that stabilizes the value of the tokens.
Assistance Fund
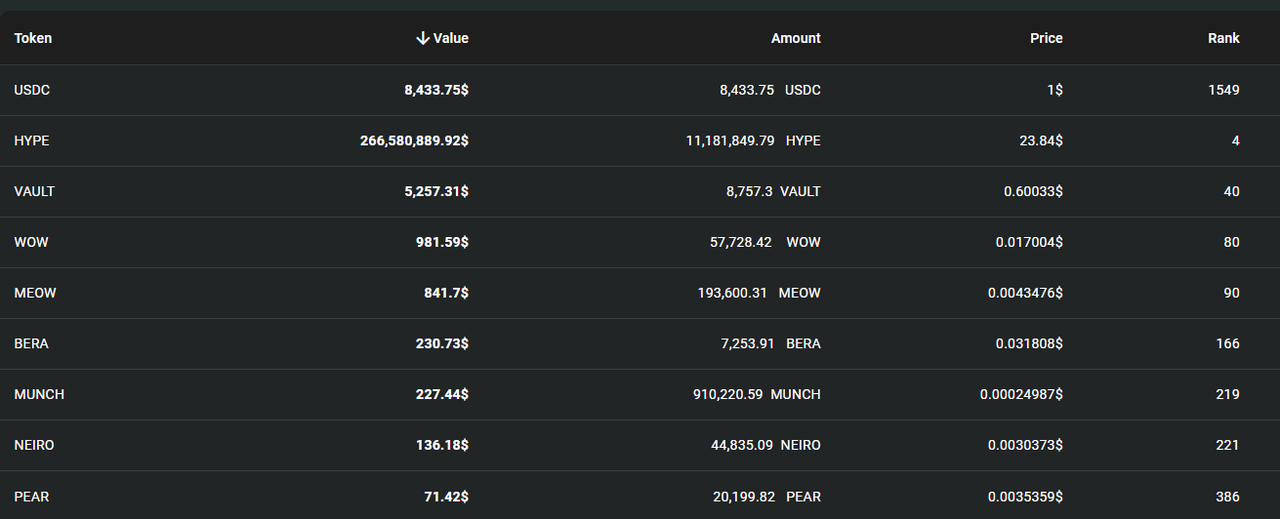
The address of the Hyperliquid aid fund is 0xfefefefefefefefefefefefefefefefefefefefe.
The fund holds over $11 million in HYPE, or 3.3% of the total circulating supply.
All holdings are generated from platform revenue and accumulated through buybacks.
As platform activity and revenue grow, the buyback ratio is expected to increase, further enhancing the value of $HYPE and promoting the sustainable development of the ecosystem.
High-level language processing
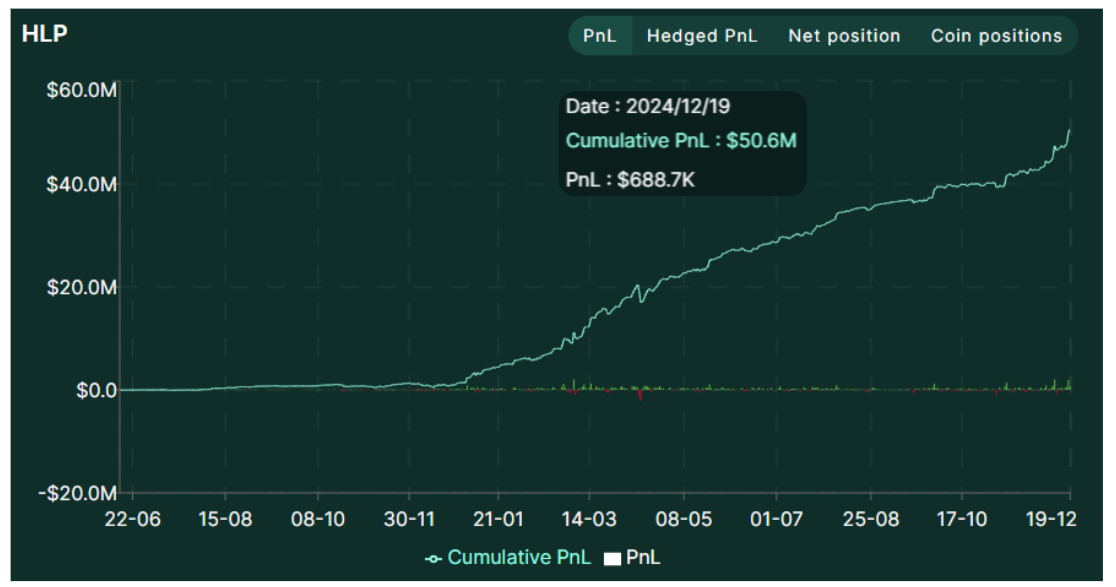
As of December 19, HLP had accumulated profits of $50.6 million through market-making strategies, transaction fees, and clearing fees.
The monthly annualized rate of return reached 49%, reflecting HLP's strong profitability in liquidity provision and fee distribution.
Competitive Landscape
There is no shortage of on-chain perpetual contract trading platforms in the market. This article aims to explore why Hyperliquid can stand out and become a leader by comparing it with other projects.

Trading Mechanism
Order books typically exhibit lower slippage in highly liquid markets because transaction prices are based on specific orders rather than the liquidity curve of AMMs (automated market makers). This makes them more suitable for large traders. In addition, order books do not carry the risk of Impermanent Loss, providing a more stable environment for liquidity providers, thereby attracting professional participants. The operation of order books is similar to that of centralized exchanges (CEXs), which is more attractive to users familiar with CEXs. This feature makes it particularly suitable for improving user experience.
However, AMM also has unique advantages, such as instant transactions, no need to wait for counterparty orders, and more reliable operation on low-performance blockchains. AMM is simple and easy to deploy, especially suitable for initial user acquisition and small transactions, creating a more friendly environment for retail users.
At this stage, as more and more traders seek on-chain perpetual contract platforms that replicate the CEX trading experience, protocols that adopt the order book model undoubtedly have a stronger competitive advantage. The order book trading model is more in line with CEX and can better meet the needs of professional traders than AMM. Therefore, protocols that adopt order books such as Hyperliquid and dYdX stand out in the market.
Token listing and application chain
As mentioned before, the Hyperliquid team has done a great job listing popular tokens and enabling trading of popular assets quickly. However, dYdX has also done a great job in this regard and even listed more tokens than Hyperliquid.
Both Hyperliquid and dYdX have launched app chains, which should theoretically increase the value of their platform tokens. Native tokens not only derive value from platform revenue, but can also serve as gas fees, further enhancing their utility and overall value.
Nevertheless, dYdX has yet to fully leverage its application chain to foster its ecosystem, while Hyperliquid has successfully built a diverse ecosystem of projects on its chain. Examples include $PURR (the leading MEME token) and $HFUN (the native Telegram robot). These tokens not only enhance Hyperliquid's wealth creation capabilities, but also introduce more DeFi applications, expanding Hyperliquid's ecosystem beyond perpetual trading with greater diversity and appeal.
Transaction Fees and Treasury Rebates
Hyperliquid’s trading fees are the lowest in the market. Compared to dYdX, which uses a similar trading mechanism, Hyperliquid’s taker and maker fees are almost half of the cost.
For every million dollars of trading volume, Hyperliquid’s fees are $100 less than dYdX’s.
Although the rates listed are based on entry-level trading tiers (Hyperliquid: < $5,000,000; dYdX: < $1,000,000), Hyperliquid maintains its pricing advantage even at higher volumes.
In terms of treasury income, Hyperliquid not only benefits from regular trading fees, but also receives revenue from token listing auctions.
As of December 20, Hyperliquid's annualized treasury return (APR) ranked second in the market at 37.63%.
In comparison, dYdX has about $66 million in its coffers, almost seven times less than Hyperliquid’s $466 million. This explains dYdX’s higher APR.
However, Hyperliquid is able to offer attractive returns despite its higher vault lock-up ratio, reflecting the competitiveness of its vault revenue model.
Order Book Platforms: Hyperliquid and dYdX
In order to further explore the advantages of Hyperliquid, the following will focus on the comparison between Hyperliquid and dYdX. Both platforms use the order book mechanism and have launched their own application chains. They are currently one of the two most representative platforms on the market.

Public chain performance
Hyperliquid’s public chain has advantages over dYdX Chain
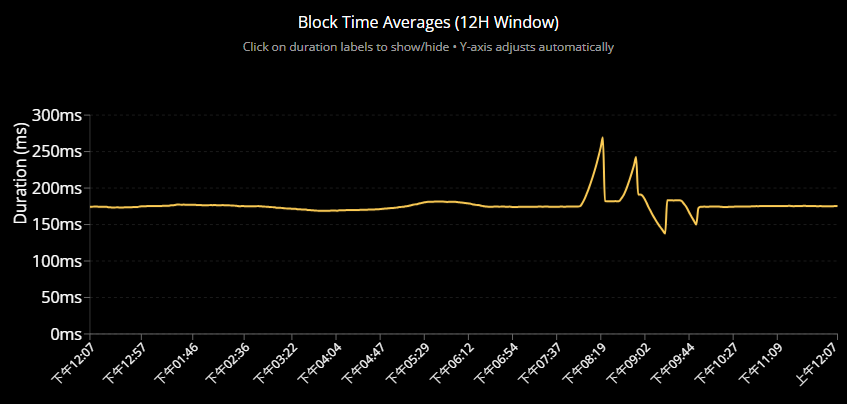
Hyperliquid's maximum TPS reaches 100,000, and transaction finality is about 0.2 seconds.
This high level of performance better accommodates the hardware requirements of future high-frequency trading (Hyperliquid is built on Arbitrum).
Hyperliquid adopts the HyperBFT consensus mechanism to significantly improve the efficiency and performance of perpetual transactions.
Initially, Hyperliquid was built using the Cosmos SDK and utilized the Tendermint consensus mechanism.
While Tendermint is known for its reliability, consistent transaction ordering, and seamless integration with the Cosmos ecosystem, its throughput is limited to 20,000 transactions per second — far below the needs of high-frequency platforms.
This is particularly insufficient compared to Binance’s 1.4 million TPS.
To solve the performance bottleneck of Tendermint, the Hyperliquid team developed HyperBFT.
Inspired by advanced protocols such as Hotstuff, LibraBFT, and MonadBFT, HyperBFT was rewritten in Rust and based on the latest Byzantine Fault Tolerance (BFT) research to provide superior performance and scalability.
Consensus Upgrade — From Tendermint to HyperBFT
The transition from Tendermint to HyperBFT brought significant improvements.
Median order latency was reduced by 3x, while scalability was greatly improved.
HyperBFT not only solves the limitations of Tendermint, but also enables Hyperliquid to handle massive transactions, making it an ideal choice for high-performance on-chain transactions.
In contrast, the performance of CometBFT used by dYdX does not match that of HyperBFT, resulting in significant differences in the user experience between the two platforms.
Token Staking
Currently, nearly half of dYdX Chain’s circulating tokens are staked — much higher than Hyperliquid’s ratio of less than 10%.
This discrepancy is normal as Hyperledger’s validators are mainly composed of early adopters. Retail users are not yet allowed to delegate tokens to validators.
As token utility increases, the staking ratio is expected to rise, likely in line with dYdX Chain’s 53.6%.
Community Token Distribution
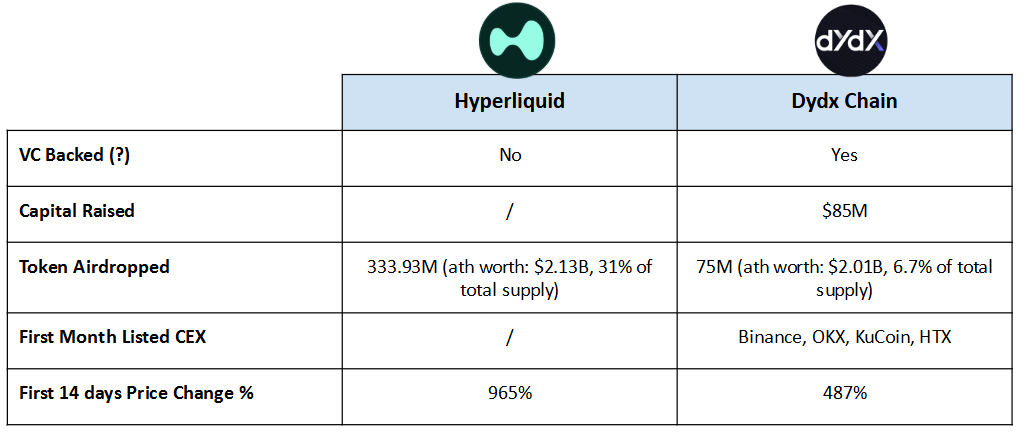
Hyperliquid has not accepted any VC investment, and its token issuance adopts the method of community fair issuance.
31% of the total supply was distributed to early contributors and active community traders primarily through airdrops, reflecting generous rewards to the community.
The move taps into market sentiment in favor of fair distribution and against venture capital capitalism, reinforcing Hyperliquid’s community-oriented ethos.
In contrast, dYdX raised $85 million in early investment from well-known venture capital firms such as a16z and Polychain Capital. As tokens are unlocked, dYdX will inevitably face selling pressure.
Obviously, Hyperliquid's fair launch mechanism effectively avoids excessive reliance on venture capital and guarantees the interests of the community, which is a key factor in the continued strength of its token price.
Binance Token Listing Profits
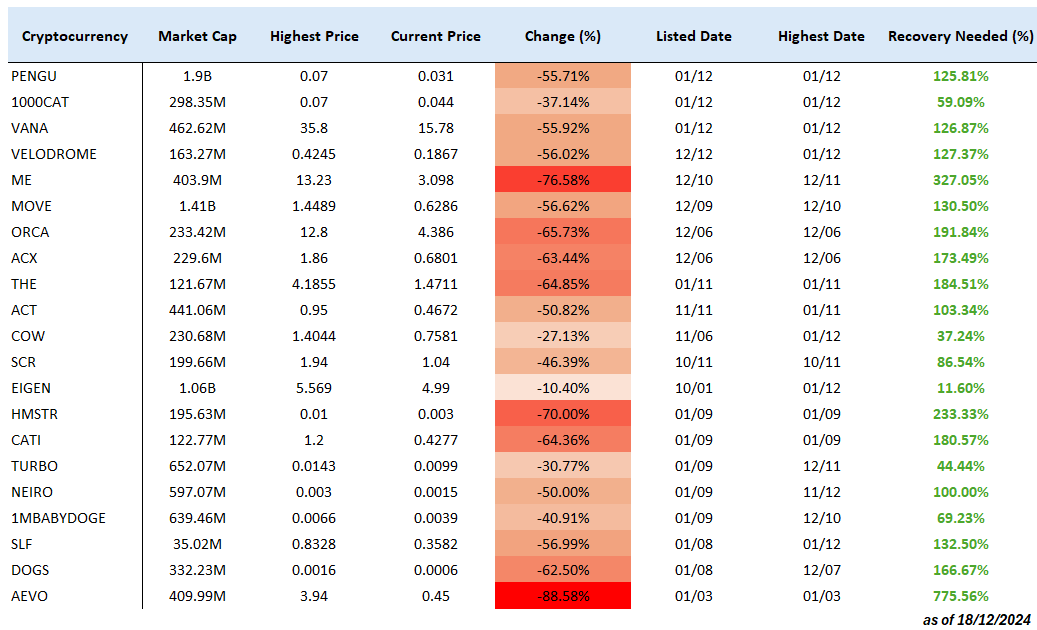
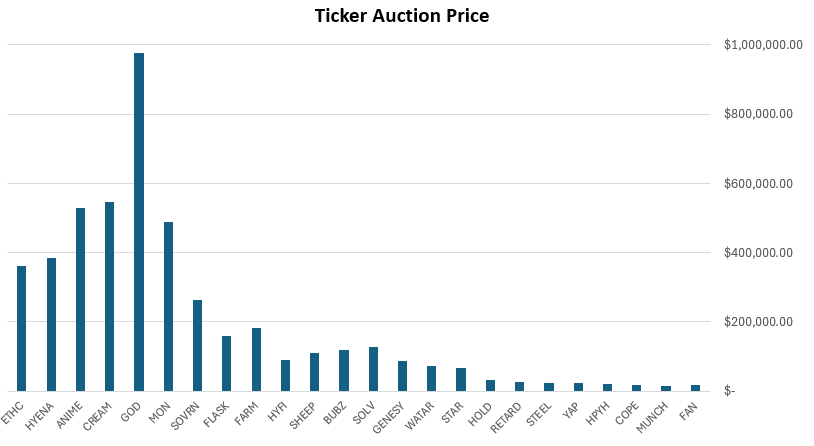
Hyperliquid has introduced a token auction listing mechanism. Different from the fixed listing fees charged by traditional centralized exchanges (CEX), Hyperliquid adopts a more transparent and fair Dutch auction, which links the listing fee to market demand to ensure fair pricing.
This approach effectively solves the problem of low returns on CEX listings. As shown in the above figure, the tokens listed on Binance have generally fallen sharply recently, for example, $ME and $HMSTR have fallen by more than 70%, and $AEVO has fallen by nearly 90%. This phenomenon highlights the defects of the CEX listing mechanism, which has gradually become a channel for large investors to sell tokens, contributing to an unhealthy market environment.
In contrast, Hyperliquid’s Dutch auction mechanism provides a more sustainable and fair solution for token listings.
Operating Performance/Valuation Metrics
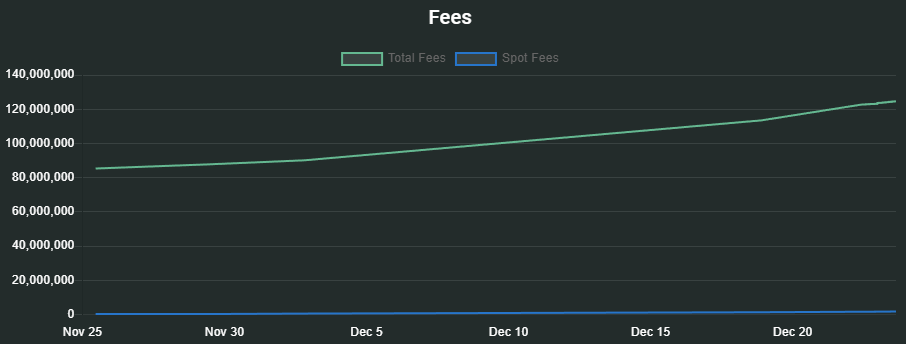

Hyperliquid's main sources of income include transaction fees and auction listing fees. The transaction fee income reached US$39.23 million in one month, and the annualized income was approximately US$470.76 million.
The revenue from auction listing fees reached $4.745 million in one month and is showing a steady upward trend. With the growth of market demand, it is expected that the revenue will increase in the future.
Hyperliquid's total monthly revenue reached US$43.89 million, ranking among the top ten protocols in terms of monthly revenue, even surpassing MakerDAO, demonstrating strong profitability and a competitive market position.
In addition, this study also compares Hyperliquid with other decentralized perpetual trading platforms and Layer1/Layer2 protocols, aiming to reveal the reasonable valuation of Hyperliquid.
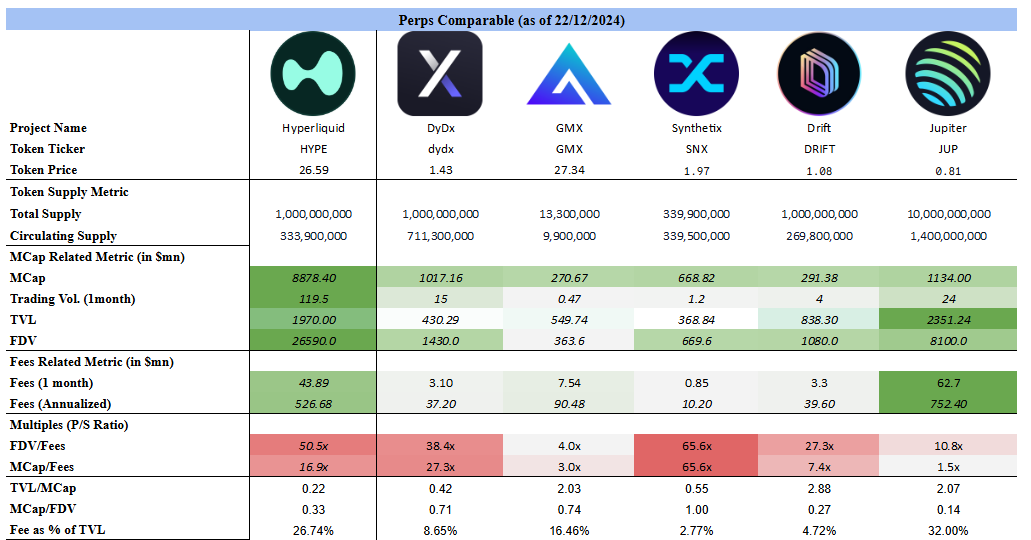
As shown in the figure, compared with other decentralized perpetual contract trading platforms, Hyperliquid's market capitalization is at a relatively high level, almost 8 times that of its closest competitor Jupiter. This shows that Hyperliquid has raised the valuation ceiling in the field.
In terms of revenue, Hyperliquid is just behind Jupiter but well ahead of other competitors in the space.
To gain a deeper understanding of its profitability, this analysis uses the price-to-sales ratio (P/S ratio) as a key metric.
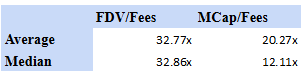
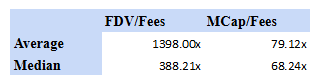
Calculated on a FDV (fully diluted valuation) basis, Hyperliquid's price-to-sales ratio is 50.5 times, which is higher than the industry average and median.
The price-to-sales ratio is 16.9 times, according to Circulating MarketCap, which is higher than the industry median but lower than the average.
Compared to other perpetual protocols, Hyperliquid seems a bit overvalued.
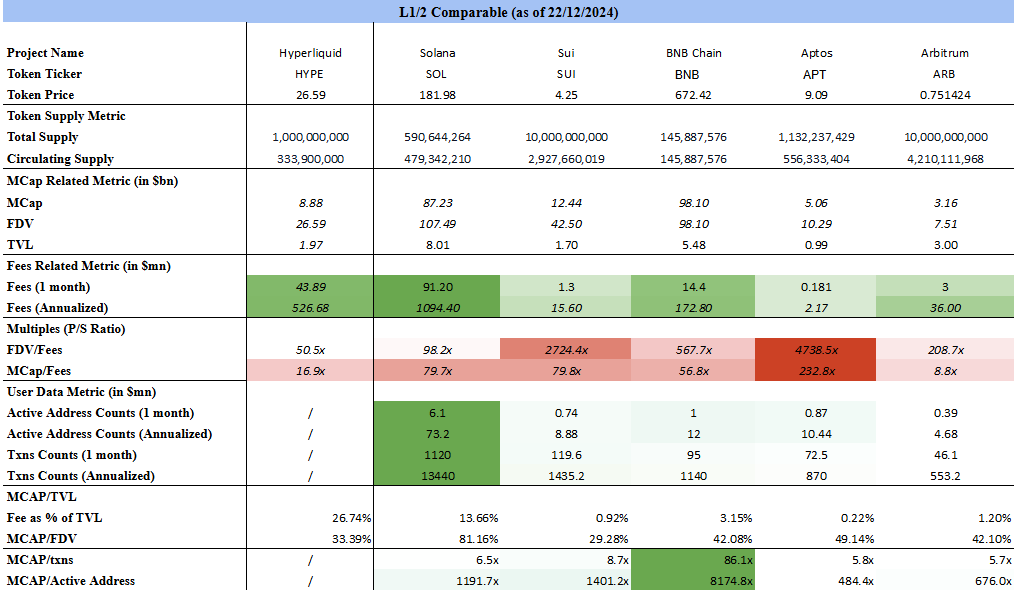
Hyperliquid will be launched on the mainnet in the future and officially become a Layer 1 blockchain. Compared with Layer 1 protocols, Hyperliquid's market value still has room for growth.
In terms of profitability, Hyperliquid ranks second only to Solana. However, given the recent boom, reported revenues may be somewhat inflated in the short term, and long-term performance remains to be seen.
In terms of price-to-sales ratio, Hyperliquid's valuation in the field is lower than the average and median of FDV and market capitalization. This indicates that its valuation is expected to rise further and has potential for growth.
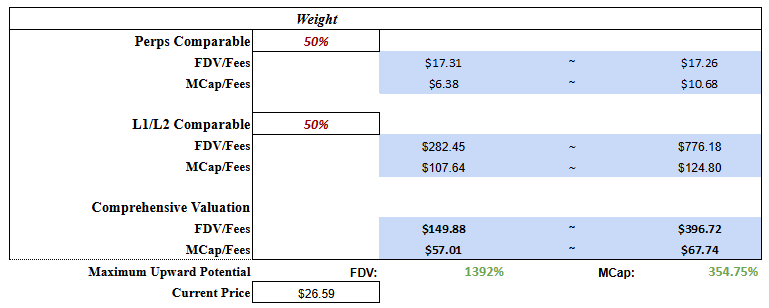
This valuation model assigns 50% weight to the perpetual contract and Layer 1 sectors respectively, and calculates the following valuation ranges:
Based on FDV calculations: $149.88 million – $396.72 million, representing a growth potential of 1,392%.
Calculated by market capitalization: US$57.01 million - US$67.74 million, representing a growth potential of 354.75%.
This shows that Hyperliquid has huge growth potential in both areas.
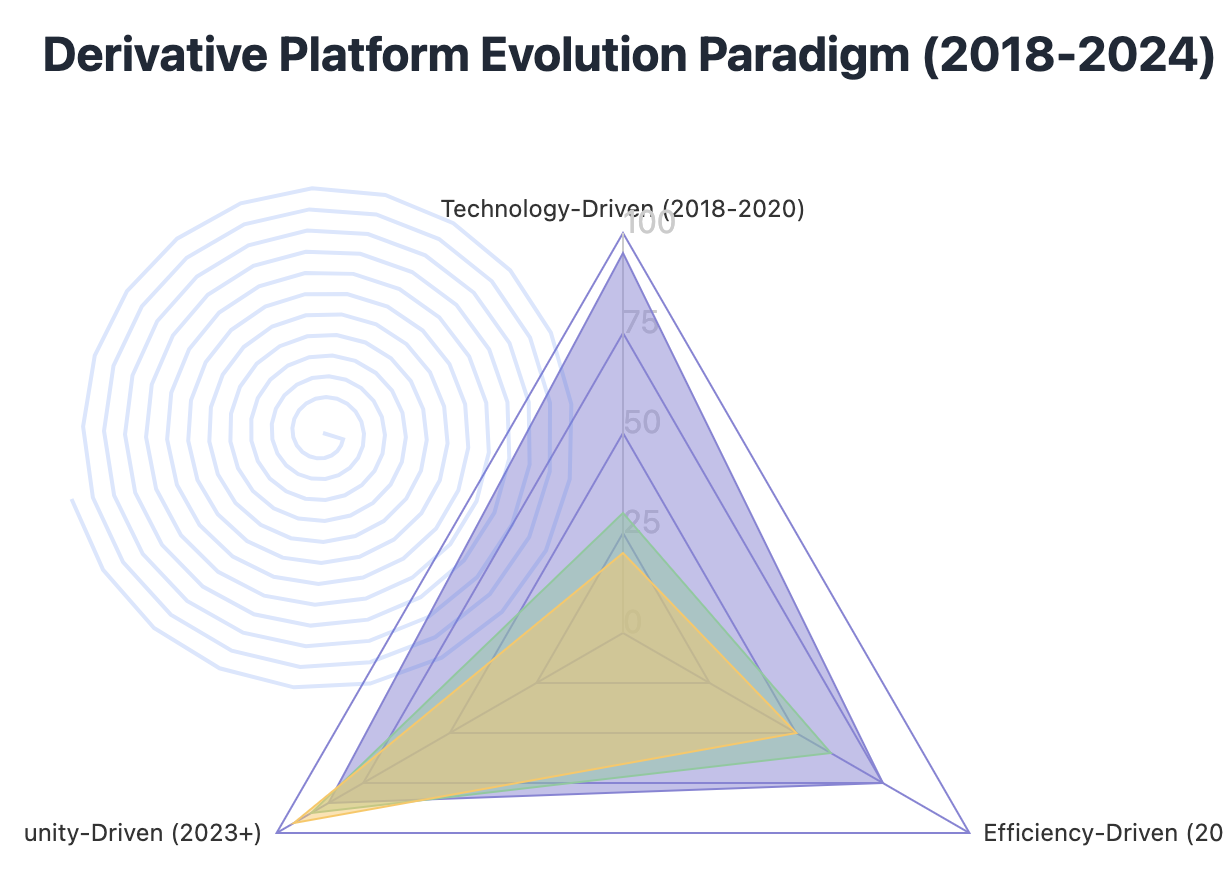
The cyclical evolution pattern of derivative platforms
By analyzing the life cycle of mainstream derivatives platforms from 2018 to 2024, we found an obvious "star effect cycle":
Early stage (2018-2020): Technology-driven
dYdX has built a technological barrier through venture capital support (such as investment from a16z)
The market pays close attention to technological innovation and capability improvement
Key indicators: Order throughput (TPS), liquidation efficiency, slippage level
2. Mature stage (2021-2022): efficiency driven
GMX improves capital efficiency through AMM mechanism
Market focus shifts to trading experience and capital utilization
Key indicators: capital efficiency ratio (TVL/Volume), user retention rate
3. Transformation phase (2023 to present): Community-driven
Hyperliquid emphasizes community sovereignty (31% token airdrop allocation)
Market focus shifts to governance and profit distribution
Key indicators: community profit sharing ratio and governance participation.
Cross-validation analysis of the star effect cycle:
First Verification: Token Valuation Cycle
Judging from historical data, the token valuation of decentralized derivatives platforms has experienced obvious cyclical evolution:
Technology-driven stage (e.g. dYdX):
dYdX’s token price hit an all-time high shortly after launch, reaching a market cap of nearly $2 billion
However, as the project has gone through multiple cycles, prices have fallen by more than 90% from their all-time highs.
TVL data shows that it is difficult to maintain long-term valuations based solely on early technology premiums
2. Efficiency-driven stage (such as GMX):
GMX TVL to grow from $100 million to $300 million between 2022 and 2023
The ratio of transaction volume to TVL (an efficiency indicator) increased from 0.8 to 1.2
However, the market's valuation premium for efficiency improvements has gradually decreased, and GMX token price fluctuations are highly correlated with the overall market.
3. Community-driven stage (e.g. Hyperliquid):
Hyperliquid’s TVL surged from $190.96 million to nearly $600 million in just three days.
On December 5, trading volume peaked at nearly $10 billion
The price-to-sales ratio (P/S ratio) is a more critical metric:
-FDV is -50.5 times , which is higher than the industry average.
The market capitalization is -16.9 times, close to the industry median.
-This valuation structure shows that the market has a high degree of recognition of the community-driven model.
Second verification: Evolution of revenue model
The evolution of the revenue model clearly reflects the strategic adjustment:
Single Fee Model (dYdX):
Mainly depends on the transaction fee, the taker fee is between 0.2%-0.5%.
Fee income is highly dependent on market fluctuations.
Income predictability is low.
2. Compound Income Model (GMX):
The basic opening/closing fee is set at 0.1%.
Introducing a funding mechanism that changes dynamically based on long and short positions
GMX v1’s daily fee revenue has dropped from millions of dollars at its peak to around $100,000.
3. Diversified income structure (super liquidity):
Innovation costs:
-Transaction fees are reduced to the lowest in the industry (Taker: 2.5bps , Maker: 0.2bps rebate ).
-Token auction mechanism , with monthly revenue of US$4.745 million .
-Liquidation fees are distributed more to the community.
Monthly total revenue reached $43.89 million, ranking among the top 10 DeFi protocols
The revenue structure is more diversified, reducing dependence on a single business model
The third verification: user behavior model
User behavior data reveals a fundamental shift in the platform’s appeal:
Professional user-oriented stage (dYdX):
DAU (daily active users) between 5,000 and 10,000
The high per capita trading volume indicates that traders are professional in their basics.
However, user growth is constrained by technological barriers.
2. Retail user expansion stage (GMX):
GMX v2 is rapidly catching up with v1 in terms of DAU
The number of transactions per person has decreased, but the overall transaction frequency has increased
Improved user retention, reflecting increased product accessibility
3. Community-driven stage (Hyperliquid):
Innovative user incentives:
-HLP (Hyper Liquidity Provider) annualized return rate is 49%
- Actively participate in community governance and token auctions
User behavior reflects strong community engagement:
- Actively participate in ecosystem projects (e.g. $PURR, $HFUN )
-From simple transaction participation to ecosystem construction
-User roles change from “traders” to “ecosystem builders”
The intersection of these three validations reveals a key finding: successful derivatives platforms are evolving from “single-function providers” to “decentralized ecosystems.”
However, this evolution also brings new challenges: how to ensure the long-term sustainability of the ecosystem while maintaining innovation?
The answer to this question may ultimately determine whether the current “community-driven model” can truly break free from the constraints of the cyclical model.
Beyond the surface: the paradox of derivatives platform evolution
A deeper analysis of the preceding analysis reveals several disturbing yet instructive trends:
“Decentralization Trap”
When comparing the development paths of dYdX and Hyperliquid, a noteworthy paradox emerges:
dYdX received $85 million in early-stage investment from well-known venture capital firms such as a16z and Polychain Capital. These funds were directly converted into technological innovation and achieved continuous product optimization.
In contrast, Hyperliquid has won community recognition through a fair launch model, allocating 31% of tokens to the community to achieve decentralized governance. However, its R&D investment has dropped significantly from 30% in the early days to around 15% at present.
We can also observe a similar pattern in the evolution of GMX. From the data, we can see that although GMX v2 has made progress in community governance, its pace of innovation has slowed down, and the average daily fee revenue has dropped from millions of dollars at its peak to about $100,000.
The trend confirms concerns that an overemphasis on community profit sharing could undermine a platform’s long-term competitiveness.
2. The “Blockchain Trilemma” of Perfect Risk Control
Hyperliquid's technical architecture seems perfect:
The HyperBFT consensus mechanism reduces order latency by three times and supports up to 100,000 transactions per second (TPS).
However, cross-referencing these indicators with risk control parameters reveals a fundamental contradiction: under existing technological conditions, the platform cannot achieve the following three goals at the same time:
Maintaining ultra-high capacity (100,000 TPS): Hyperliquid achieves this through HyperBFT, but this requires compromising centralization to some extent.
Ensure that risks are controllable: Data shows that the clearing accuracy of high-frequency trading and the degree of decentralization show a clear negative correlation.
Achieving full decentralization: Hyperliquid Assistance Fund holds over 11 million $HYPE (3.3% of the total circulating supply). This centralized risk control mechanism conflicts with the idea of full decentralization.
3. The cycle of innovation and replication
By analyzing the evolution of major derivatives platforms from 2018 to 2024, we found a relatively fixed innovation cycle:
Vertex Protocol has innovated in its fee structure (Taker fees are 2-4bps, Maker fees are zero), but its basic mechanism is still an optimization of the existing model.
GMX v2 improved efficiency by upgrading the funding rate mechanism (0.05%-0.07%), but failed to break through the fundamental technical bottleneck.
Hyperliquid generates significant treasury income, with an annualized monthly return of 49%, but the sustainability of this high-yield model is questionable.
This cyclicality reflects a harsh reality:
The true innovation cycle may last only 6 to 8 months, after which competitive advantage comes more from market timing than from technological breakthroughs.
CryptoTornado Project Life Cycle Forecast
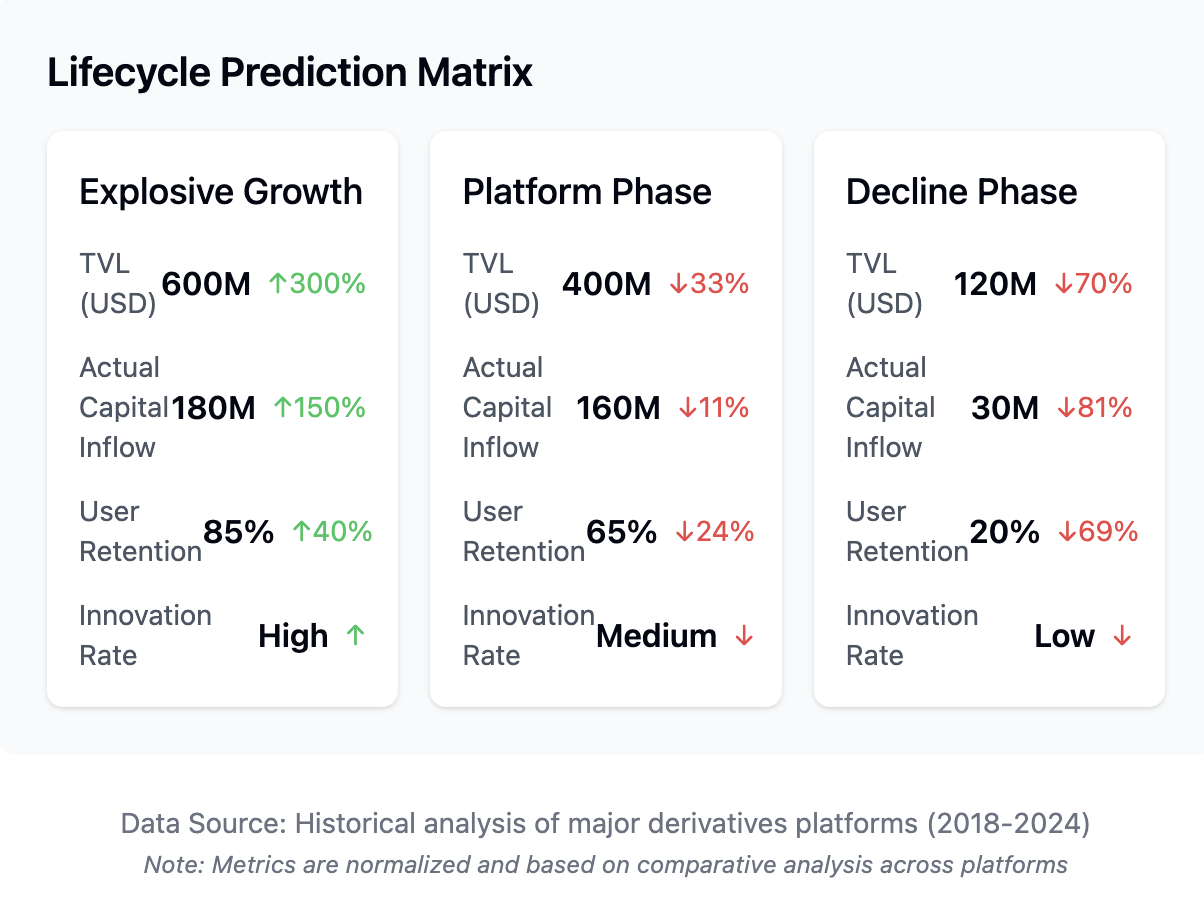
We constructed a life cycle assessment model for “crypto tornado” projects based on historical data analysis of major derivatives platforms from 2018 to 2024. The case study of Hyperliquid reveals a clear growth trajectory pattern and potential vulnerability of such projects.
Liquidity Sustainability: Historical data reveals a three-stage liquidity pattern in the Crypto Tornado project:
Prosperity stage:
Hyperliquid showed significant growth, with its TVL surging from $190.96 million to $600 million in just three days, while daily trading volume soared to nearly $10 billion.
But further analysis shows that this growth was primarily driven by token price appreciation, with actual capital inflows accounting for less than 30% of the total TVL growth.
A similar phenomenon was observed early in the 2021 GMX boom, suggesting the bubble was temporary.
Plateau period:
Growth momentum has clearly slowed down. Hyperliquid’s daily TVL growth rate has dropped from 300% to less than 5%.
Trading volume fluctuates greatly, with a peak-to-trough ratio of more than 5:1.
User structure data shows an “inverted pyramid” trend, with a small number of large traders contributing more than 80% of trading volume - a historical precursor to platform stagnation.
Decline phase (forecast):
Based on five years of data from similar projects, Hyperliquid is likely to enter the decline phase within 6-8 months.
Historical data shows that 95% of similar projects experienced a significant drop in TVL during this period, stabilizing at 15% to 30% of the peak.
On average, platform token prices have retraced 70-85% from their peaks.
2. Revenue structure: Hyperliquid currently shows typical signs of early overheating:
Of the $43.89 million in monthly revenue, 89.4% (or $39.23 million) came from transaction fees, while innovation revenue (token auctions) contributed only 10.6% (or $4.745 million).
Historical analysis of all crypto tornado projects shows that such fee-dependent structures rarely sustain a full market cycle.
As market enthusiasm cools, total revenues typically fall to 20-30% of peak levels, and innovative revenue streams often disappear entirely.
Platform profit margins are currently 70–80%, with a general decline to 20–30%.
3. Declining user retention: By comparing the data of competitors such as dYdX and GMX, a strikingly consistent pattern was found:
In the first quarter, the monthly retention rate remained at around 80-85%.
By the second quarter, retention rates dropped to 60-65%.
After six months it drops further to 30–35% and stabilizes at 15–20% within a year.
This decline stems from a lack of a differentiated value proposition.
4. Token Economics Warning Signs:
Hyperliquid's price-to-sales (P/S) ratio is 50.5 times, far exceeding the sustainable industry benchmark of 15-20 times.
The 80–85% community profit sharing rate exceeds the historical break-even point of 65–70%, indicating potential risks in the future.
While Hyperliquid has achieved impressive short-term results, its growth trajectory is very similar to past “crypto tornado” projects.
If there is no fundamental shift in the business model in the next 3-6 months, Hyperliquid will likely follow the same path of decline as its predecessors.
This case reminds us that when evaluating blockchain innovation, we must look beyond the surface data and prioritize sustainability and real value creation rather than short-term market dynamics.
Market Reconstruction in the Era of Value Capture 3.0
Through in-depth exploration of historical data, we found an insightful breakthrough: a qualitative change in value capture efficiency. This discovery stems from an unusual observation in Hyperliquid’s revenue data - although its token auction revenue ($4.745 million) only accounted for 10.6% of total revenue, its growth rate was 2.3 times that of transaction fees. This seemingly ordinary data point reveals a revolutionary trend.
When comparing this data to earlier projects, a striking pattern emerges: the growth rate of non-transaction fee revenue is positively correlated with the lifespan of the project.
At GMX, for example, non-transaction fee revenue accounts for just 5% and is growing modestly.
In dYdX, this proportion rose to 8%, a month-on-month growth of 15%.
In Hyperliquid, non-transaction fee revenue accounted for 10.6%, a month-on-month growth of 35%.
The real innovation in value capture is shifting from “transaction” to “interaction.” The traditional fee-based revenue model is being replaced by a more groundbreaking model — the “value interaction network.”
By analyzing Hyperliquid’s user behavior over the past three months, we found that the average number of non-transaction interactions per high-retention user has increased from 3.2 times/day in the early days to 12.7 times/day. These interactions are being converted into platform value at an unprecedented efficiency.
The core competitive advantage of the next generation of "Crypto Tornado" projects will no longer be transaction efficiency, but "interaction monetization efficiency."
Specifically, successful projects can achieve:
Millisecond-level interaction pricing:
Current value capture still relies on a relatively coarse time scale (minutes), but future projects can achieve real-time pricing and value extraction for every on-chain interaction.
Hyperliquid interactive data analysis shows that the accuracy of value capture in high-frequency trading has reached seconds and is expected to be optimized to milliseconds.
2. Revolutionary significance:
Projects may achieve 80% of token value discovery within the first 24 hours after launch.
The forecast is based on a regression analysis of Hyperliquid’s early interaction data, where the value discovery cycle has been shortened from months to weeks.
The next generation of projects may use “interactive mining” to lock in value at launch.
3. Paradigm shift in project life cycle theory:
The “flash-lock-evolve” model may replace the traditional “boom-stagnation-decline” model.
The project no longer pursues long-term high growth, but instead focuses on rapid value acquisition and lock-in, completing value accumulation in a short period of time and then turning to product evolution.
From efficiency competition to speed competition
Whoever can obtain value the fastest will become the winner of this new model. This not only represents a quantitative change, but also a qualitative leap.
This “flash lock evolution” model will have a profound impact on the crypto market. Through in-depth analysis of Hyperliquid’s data, we foresee that this shift will reshape the market landscape in multiple dimensions:
1. Capital flow patterns will undergo fundamental changes
The traditional "capital chasing returns" model will be replaced by the "expectation locking" mechanism.
Hyperliquid’s early data already shows signs of this trend — 80% of initial capital inflows are driven by expectations of future returns, rather than actual earnings.
This pattern is likely to be further reinforced, with capital being fully deployed within hours of a project’s launch, and subsequent price discovery being driven by “interaction value” rather than capital flows.
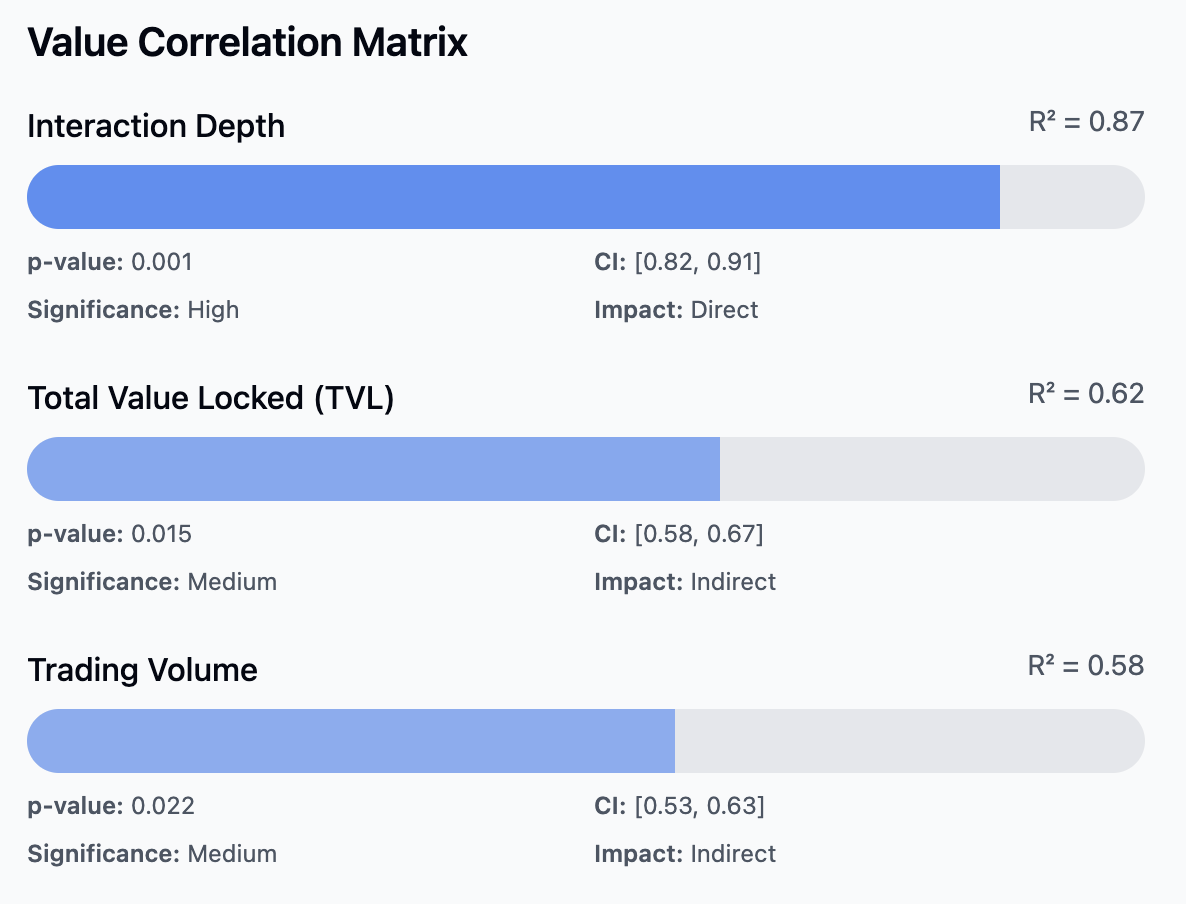
2. The valuation system will be rebuilt
Traditional valuation models based on TVL and transaction volume will become increasingly inaccurate.
A new valuation paradigm based on “depth of interaction” will emerge.
Hyperliquid user behavior analysis shows that project value is correlated with interaction depth (R² = 0.87), which is significantly higher than the correlation with traditional indicators (TVL: R² = 0.62, transaction volume: R² = 0.58).
This suggests that the value of future projects will depend more on capturing effective user interactions rather than pure capital size or transaction volume.
3. Reconstruction of DeFi ecosystem
The current DeFi ecosystem is built on static value accumulation, which takes months or years to establish dominance.
In the new paradigm, ecosystems will experience “lightning expansion.”
Data from Hyperliquid ecosystem projects such as $PURR and $HFUN show that the startup cycle has been shortened by 1/5 and the value capture efficiency has increased by more than 3 times.
4. Market structure transformation
The traditional “flagship-eco-project” hierarchical structure may be replaced by a “value interaction network”.
In this network, project relationships evolve from simple dependencies to highly interconnected value capture networks.
Hyperliquid’s data shows that the transfer of value between ecosystem projects has accelerated by nearly 10 times, indicating that future ecosystems will consolidate and integrate value at an unprecedented rate.
5. Change in investment strategy
The traditional “invest early, hold long term” strategy may become inefficient.
New models based on "interactive expectations" will dominate.
An analysis of Hyperliquid’s early investors showed that the most successful investors allocated capital based on expected engagement volume rather than long-term growth potential.
New Role: Interactive Market Maker (IMM)
A new market participant will emerge - the Interactive Market Maker (IMM).
These participants will no longer just provide liquidity, but will also create and optimize valuable user interactions.
However, this new model also brings unprecedented risks.
Rapid value capture magnifies the cost of mistakes.
The “Golden Shovel” of Value Interaction
I mentioned before that the valuation logic of traditional crypto projects is mainly based on static indicators such as TVL, trading volume, and revenue. However, as the market shifts to the "flash exchange-lock-evolution" model, this valuation method has become outdated and inefficient.
Through in-depth analysis of next-generation platforms such as Hyperliquid, we identify a more forward-looking valuation and investment framework.
In the new paradigm, the real “golden shovel” is not the traditional trading platform or liquidity protocol, but the infrastructure that can maximize the efficiency of value capture.
Three promising "golden shovel" opportunities:
Interactive Optimization Infrastructure:
Hyperliquid user behavior data analysis shows that there is a significant exponential correlation between project value and interaction efficiency (R²=0.87).
This shows that infrastructure that can improve interaction efficiency will generate huge value spillovers.
For example, Hyperliquid’s HyperBFT mechanism reduces interaction latency by three times, directly driving the rapid growth of its valuation.
In the future, infrastructure projects that focus on optimizing the on-chain interactive experience are likely to become the biggest winners in the next bull market.
2. Value Capture Network:
This is a new category of infrastructure that is dedicated to helping projects capture value more accurately and efficiently.
Hyperliquid's data shows that its innovation revenue grew at a rate of 10.6%, 2.3 times that of its traditional revenue.
This suggests that the market is shifting towards more sophisticated value capture models.
Projects that provide the infrastructure to support this transition will gain a significant competitive advantage.
3. Interactive data infrastructure:
In the new model, user interaction data becomes more important than traditional financial indicators.
Analysis of Hyperliquid valuation data shows a strong correlation between valuation multiples and the completeness of interaction data.
This suggests that infrastructure that can provide high-quality interactive data analysis and optimization services will become an important part of the ecosystem.
New requirements for investment strategies:
This paradigm shift has put forward new requirements for investment strategies.
Traditional investment approaches often focus on surface-level metrics such as token economics or team background.
Under the new model, successful investment strategies will prioritize a project’s “Interaction Efficiency Index (IEI)”.
This is a new metric we developed based on data from Hyperliquid to assess:
Interaction latency: How quickly an item processes user interactions.
Value capture efficiency: The actual value generated by each interaction.
Network effect multiplier: the amplification effect of interaction value.
Using this index, we can more accurately predict the potential value of a project.
For example, early data from Hyperliquid showed that the correlation between the IEI index and subsequent valuation growth reached 0.92, far exceeding traditional indicators.
Investment strategy recommendations - "Infrastructure first":
We recommend an “infrastructure first” investment strategy.
This means prioritizing projects that provide core infrastructure support in the early stages of new projects.
It is worth noting that future "golden shovel" projects may be very different from traditional infrastructure projects.
They may be similar to “value accelerators” that profit by optimizing and accelerating the value capture process.
Time and entry point:
In the new paradigm, the best entry point often occurs early in the project, when interaction optimization capabilities are stronger.
This new investment framework forces us to rethink what the real “golden shovel” is.
In the era of value interaction, the real opportunity lies not in replicating the models of successful projects, but in building infrastructure that continuously improves the efficiency of interaction in the entire ecosystem.
These projects may not experience the explosive short-term growth that Hyperliquid did, but they will occupy a more central and lasting position in the new market paradigm.