

Bit (BTC) has decreased by nearly 5% in the past seven days, struggling to regain momentum as it trades below the $90,000 level for nearly a week. The technical outlook remains negative, with BTC's EMA lines reinforcing the downward pressure and the critical support at $81,500 at risk of being broken.
However, the DMI chart shows that selling momentum is waning, and a trend reversal may be approaching if buyers step in. If BTC reclaims the $84,800 level, this could signal the start of an uptrend, with the potential to push up to $92,910 in the coming sessions.
Bitcoin's DMI shows sellers still in control, but that could soon change
Bitcoin's Directional Movement Index (DMI) shows the Average Directional Index (ADX) has slightly decreased from 31 to 28, indicating the strength of the trend is weakening.
ADX measures the overall strength of a trend. Values above 25 are generally considered to indicate a strong trend, while values below 20 suggest a weak or directionless market, as some analysts suggest this cycle may be different from previous ones and whether BTC has already peaked for this cycle.
A declining ADX after reaching a high can mean the current trend—whether up or down—is losing momentum, opening the possibility of a market direction change.
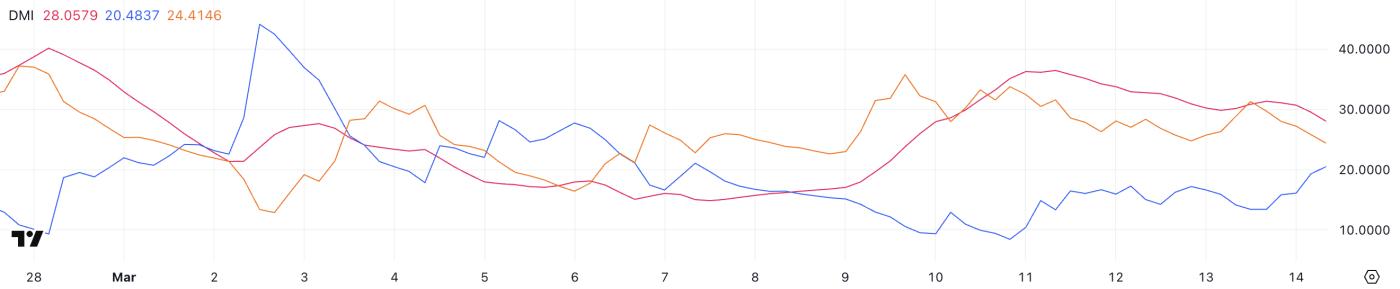 BTC DMI. Source: TradingView.
Meanwhile, +DI (positive directional index) has increased from 13.4 to 20.48, while -DI (negative directional index) has decreased from 31.3 to 24.4. This shift suggests selling pressure is decreasing while buying momentum is increasing.
Although BTC is still in a downtrend, the narrowing gap between the two directional lines and the rising +DI indicate the possibility of a trend reversal. If this trend continues and +DI crosses above -DI, this will confirm a shift to an uptrend, signaling a change in market sentiment.
However, with ADX still above 25, sellers maintain some control, making the following sessions crucial in determining whether Bitcoin can fully reverse its downtrend.
BTC Ichimoku Cloud shows a mixed picture
Bitcoin's Ichimoku Cloud chart shows a mixed outlook, with the price currently attempting to break above short-term resistance levels.
The Tenkan-sen (green line) and Kijun-sen (red line) are closely following the price action, indicating a battle between buyers and sellers.
Although BTC has pushed slightly above the Kijun-sen, the Ichimoku Cloud remains red and above the current price, signaling that the broader trend is still bearish.
Until Bitcoin can clearly break above the cloud, any upward moves will remain fragile, and resistance around the $84,000 level may be a significant challenge for the bulls.
 BTC Ichimoku Cloud. Source: TradingView.
Looking ahead, BTC needs to maintain a move above the lower boundary of the Ichimoku Cloud to establish the potential for a trend reversal.
However, the presence of a thick red cloud ahead suggests sellers still have the upper hand, making a move above it challenging.
If BTC is rejected at the cloud, a correction to the $81,000 support level is possible. Conversely, a successful breakout above $84,000 would shift market sentiment in a more positive direction, potentially leading to a push towards $86,000 and beyond.
Will Bitcoin hold above $80,000?
Bitcoin's EMA lines remain in a downward arrangement, with the short-term moving averages below the long-term ones, signaling continued downward pressure.
If the current trend persists, Bitcoin's price may test the $81,500 support level, an important area that has been held in recent sessions. A breakdown below this level could trigger additional selling pressure, potentially pushing the price down to $76,635, a level not seen in several weeks.
The EMA structure shows sellers are still in control, and without a clear reversal signal, the potential for further declines remains.
 BTC Price Analysis. Source: TradingView.
However, BTC's DMI chart suggests that a trend change may be approaching, implying that upward momentum could soon be reinforced.
If Bitcoin reverses course, the first resistance level to watch is $84,718, which may act as a significant barrier before any sustained upward move.
A successful breakout above this level could confirm the trend change, paving the way towards $92,910 if the uptrend gains more strength.


