

Bitcoin (BTC) has risen almost 5% over the past 10 days and is currently attempting to recover to the $90,000 level. Recent increases in whale activity and strong technical indicators are fueling optimism about a potential breakthrough.
The bullish pattern across the Ichimoku Balance Sheet and moving average structure suggests that the market is preparing for higher movements. As momentum builds, traders are carefully watching whether BTC can reach $100,000 in the coming weeks.
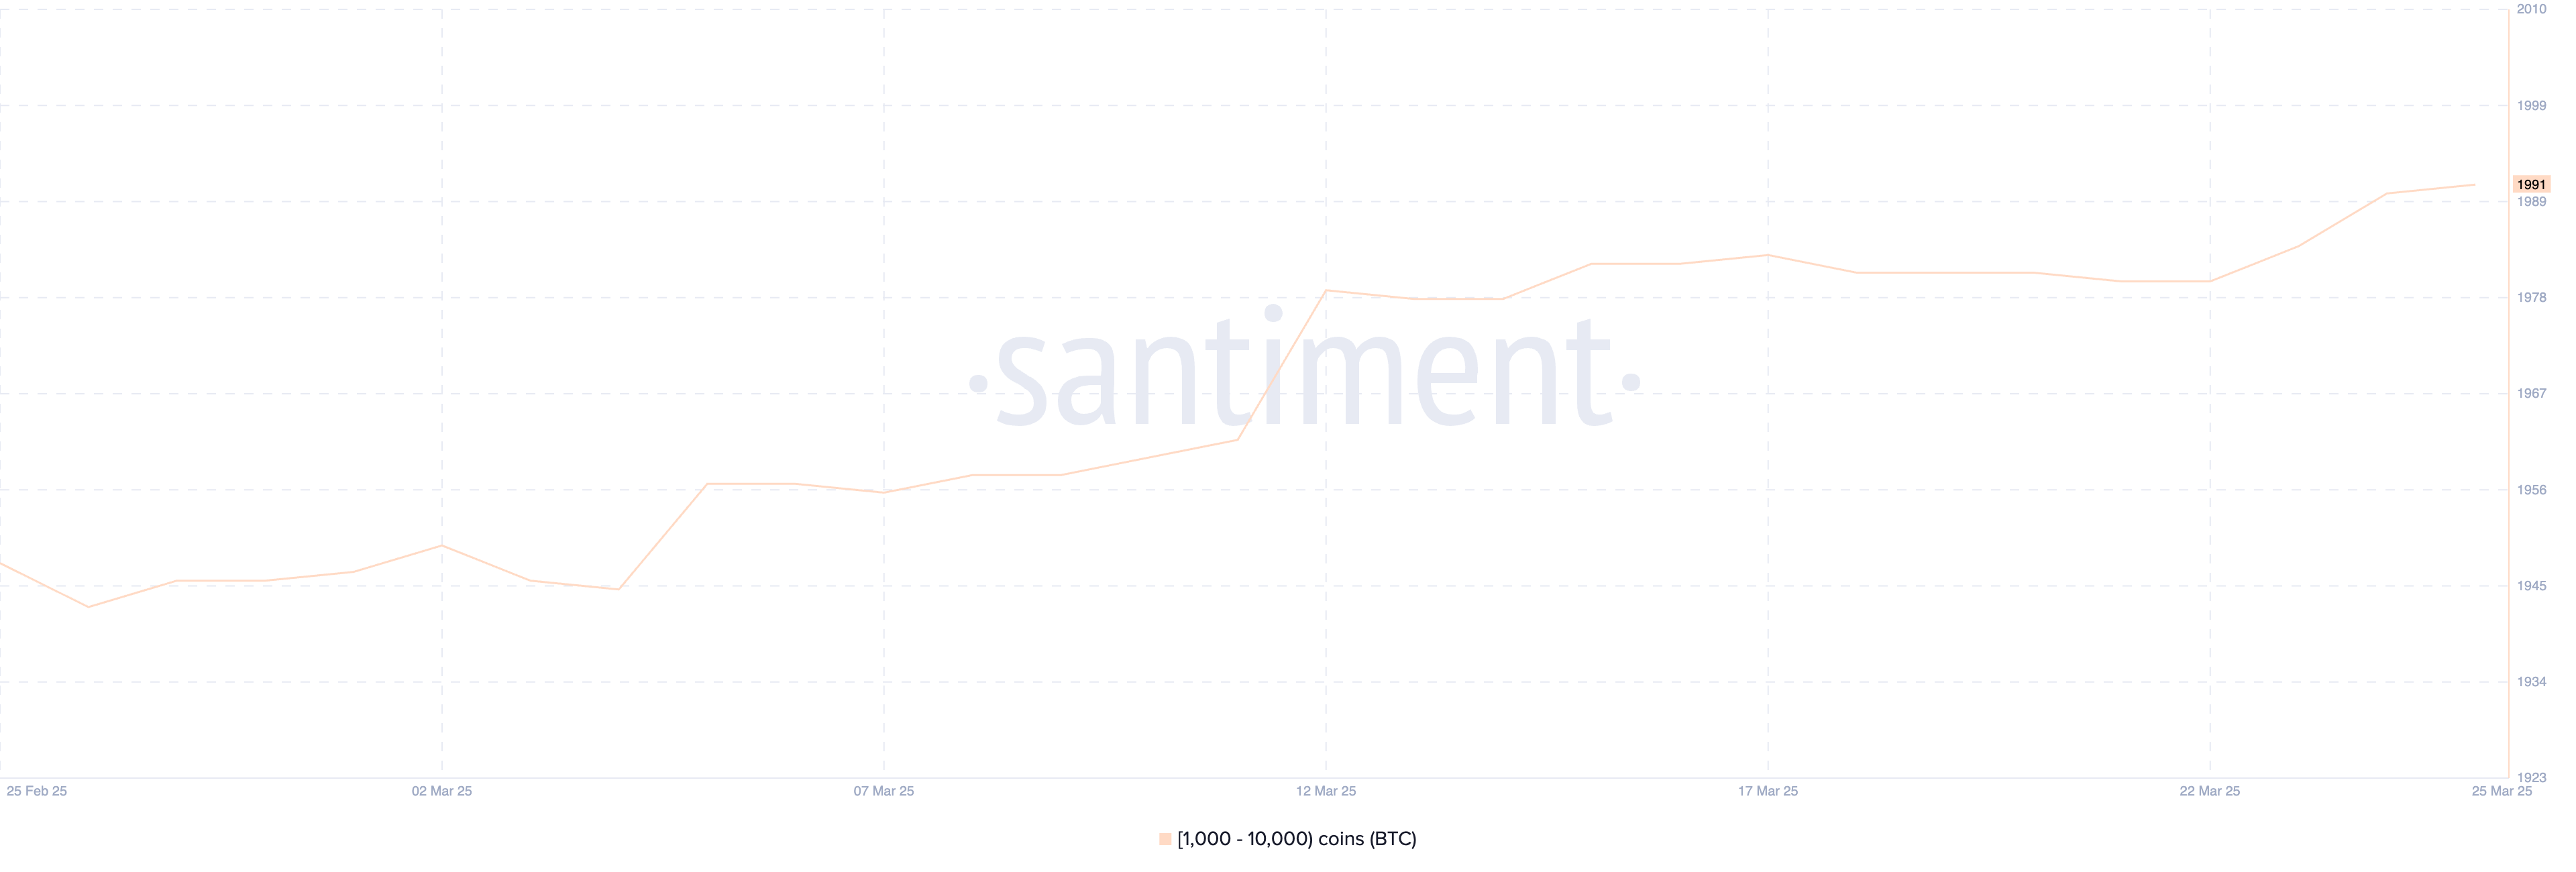
BTC Whales at Highest Since December 15
The number of Bitcoin whales, or wallets holding 1,000 to 10,000 BTC, increased from 1,980 on March 22 to 1,991 on March 25, reaching its highest level since December 15.
Although slight, this increase is significant as it reflects the re-accumulation by large holders following over three months of subdued activity.
Tracking whale wallets is important. These large players often move the market, and their accumulation or distribution patterns can serve as early signals of broad sentiment changes or major price movements.
Whales are generally considered "smart money", and an increase in their number indicates growing confidence in the market's short-term outlook.
While the growth rate of new whales has slowed in recent days, the fact that their number has reached a months-high level indicates fundamental strength.
This could mean that institutional investors or high-net-worth individuals are positioning themselves in anticipation of a potential bullish movement, which could add weight to Bitcoin's current support level and open the way for further increases if momentum continues.
Bitcoin Ichimoku Chart, Good Momentum
The Bitcoin Ichimoku chart shows a bullish structure, with price movements clearly positioned above the cloud and the cloud itself turning green and rising.
The conversion line (blue) is above the base line (red), indicating that short-term bullish momentum is still in effect. However, the two lines are beginning to flatten, suggesting a potential pause or correction.
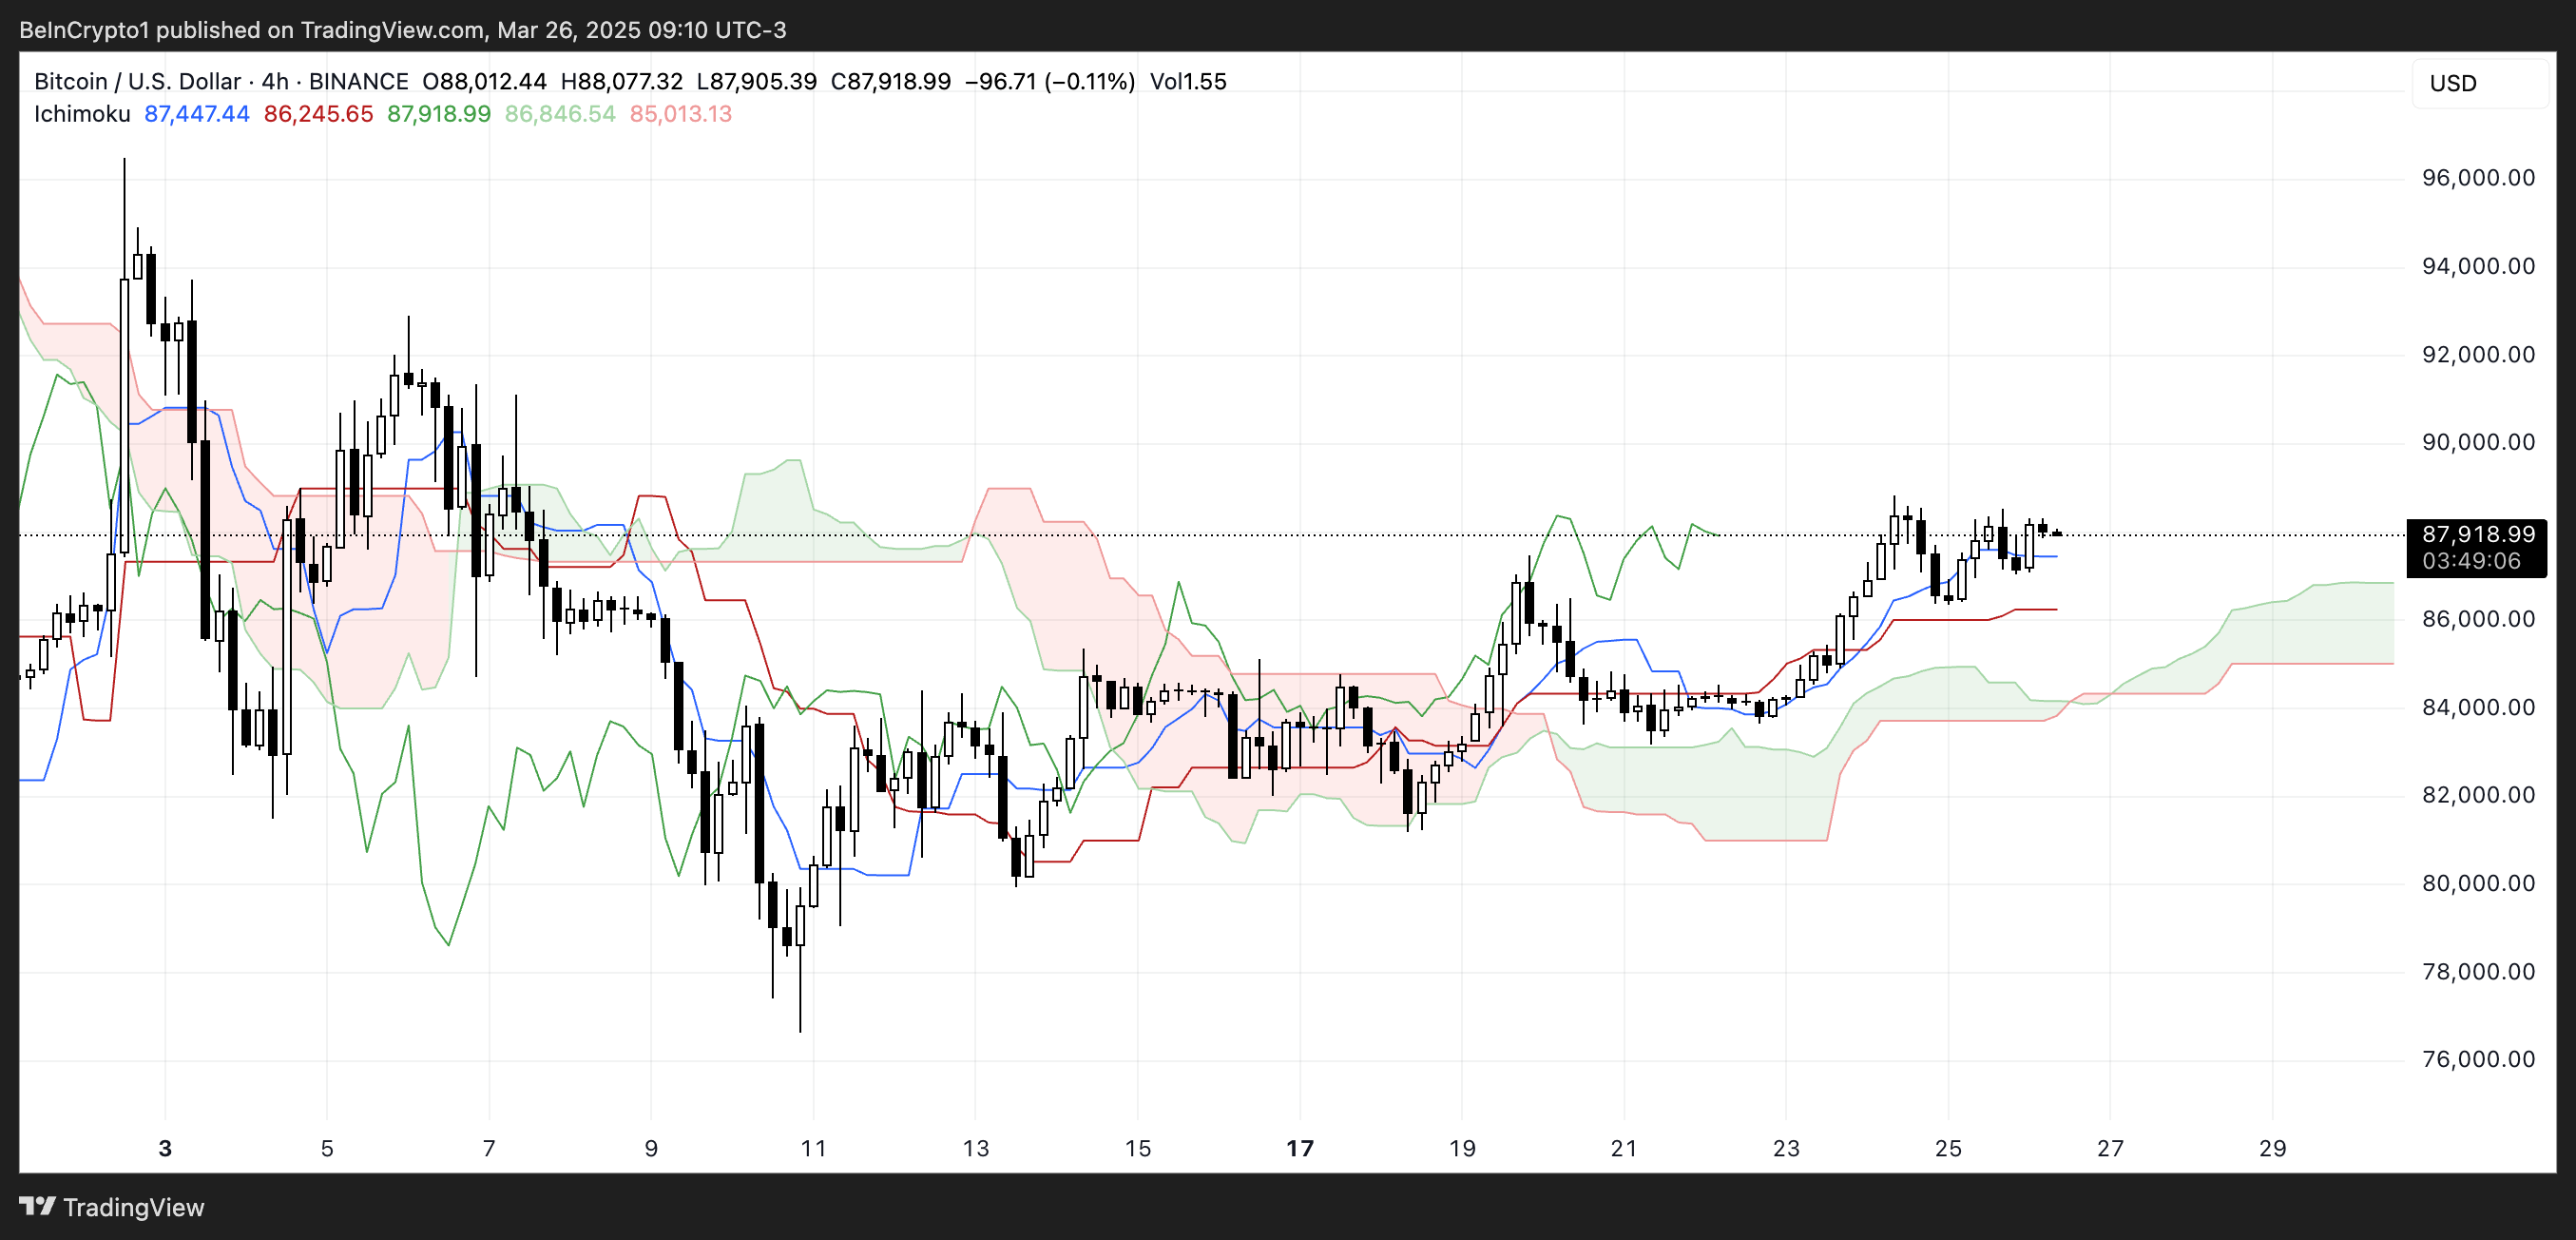
The future cloud (Kumo) is wide and tilted upward, indicating solid fundamental support and increasing trend strength. Additionally, the indicator line (lagging line) is well-positioned above past price movements, further confirming bullish sentiment.
While there may be some sideways movement in the short term, the overall Ichimoku setup continues to support bullishness unless a drop below the cloud changes the outlook.
Will Bitcoin Recover to $100,000 in April?
Bitcoin's moving averages are aligning for a potential golden cross, which could signal the start of a new bullish phase. If this crossover occurs and Bitcoin's price breaks through the $88,807 resistance, it could trigger a move to $92,928.
If the upward trend continues strongly, Bitcoin could test $96,503 and $99,472, and with accelerating momentum, it might even break through $100,000.
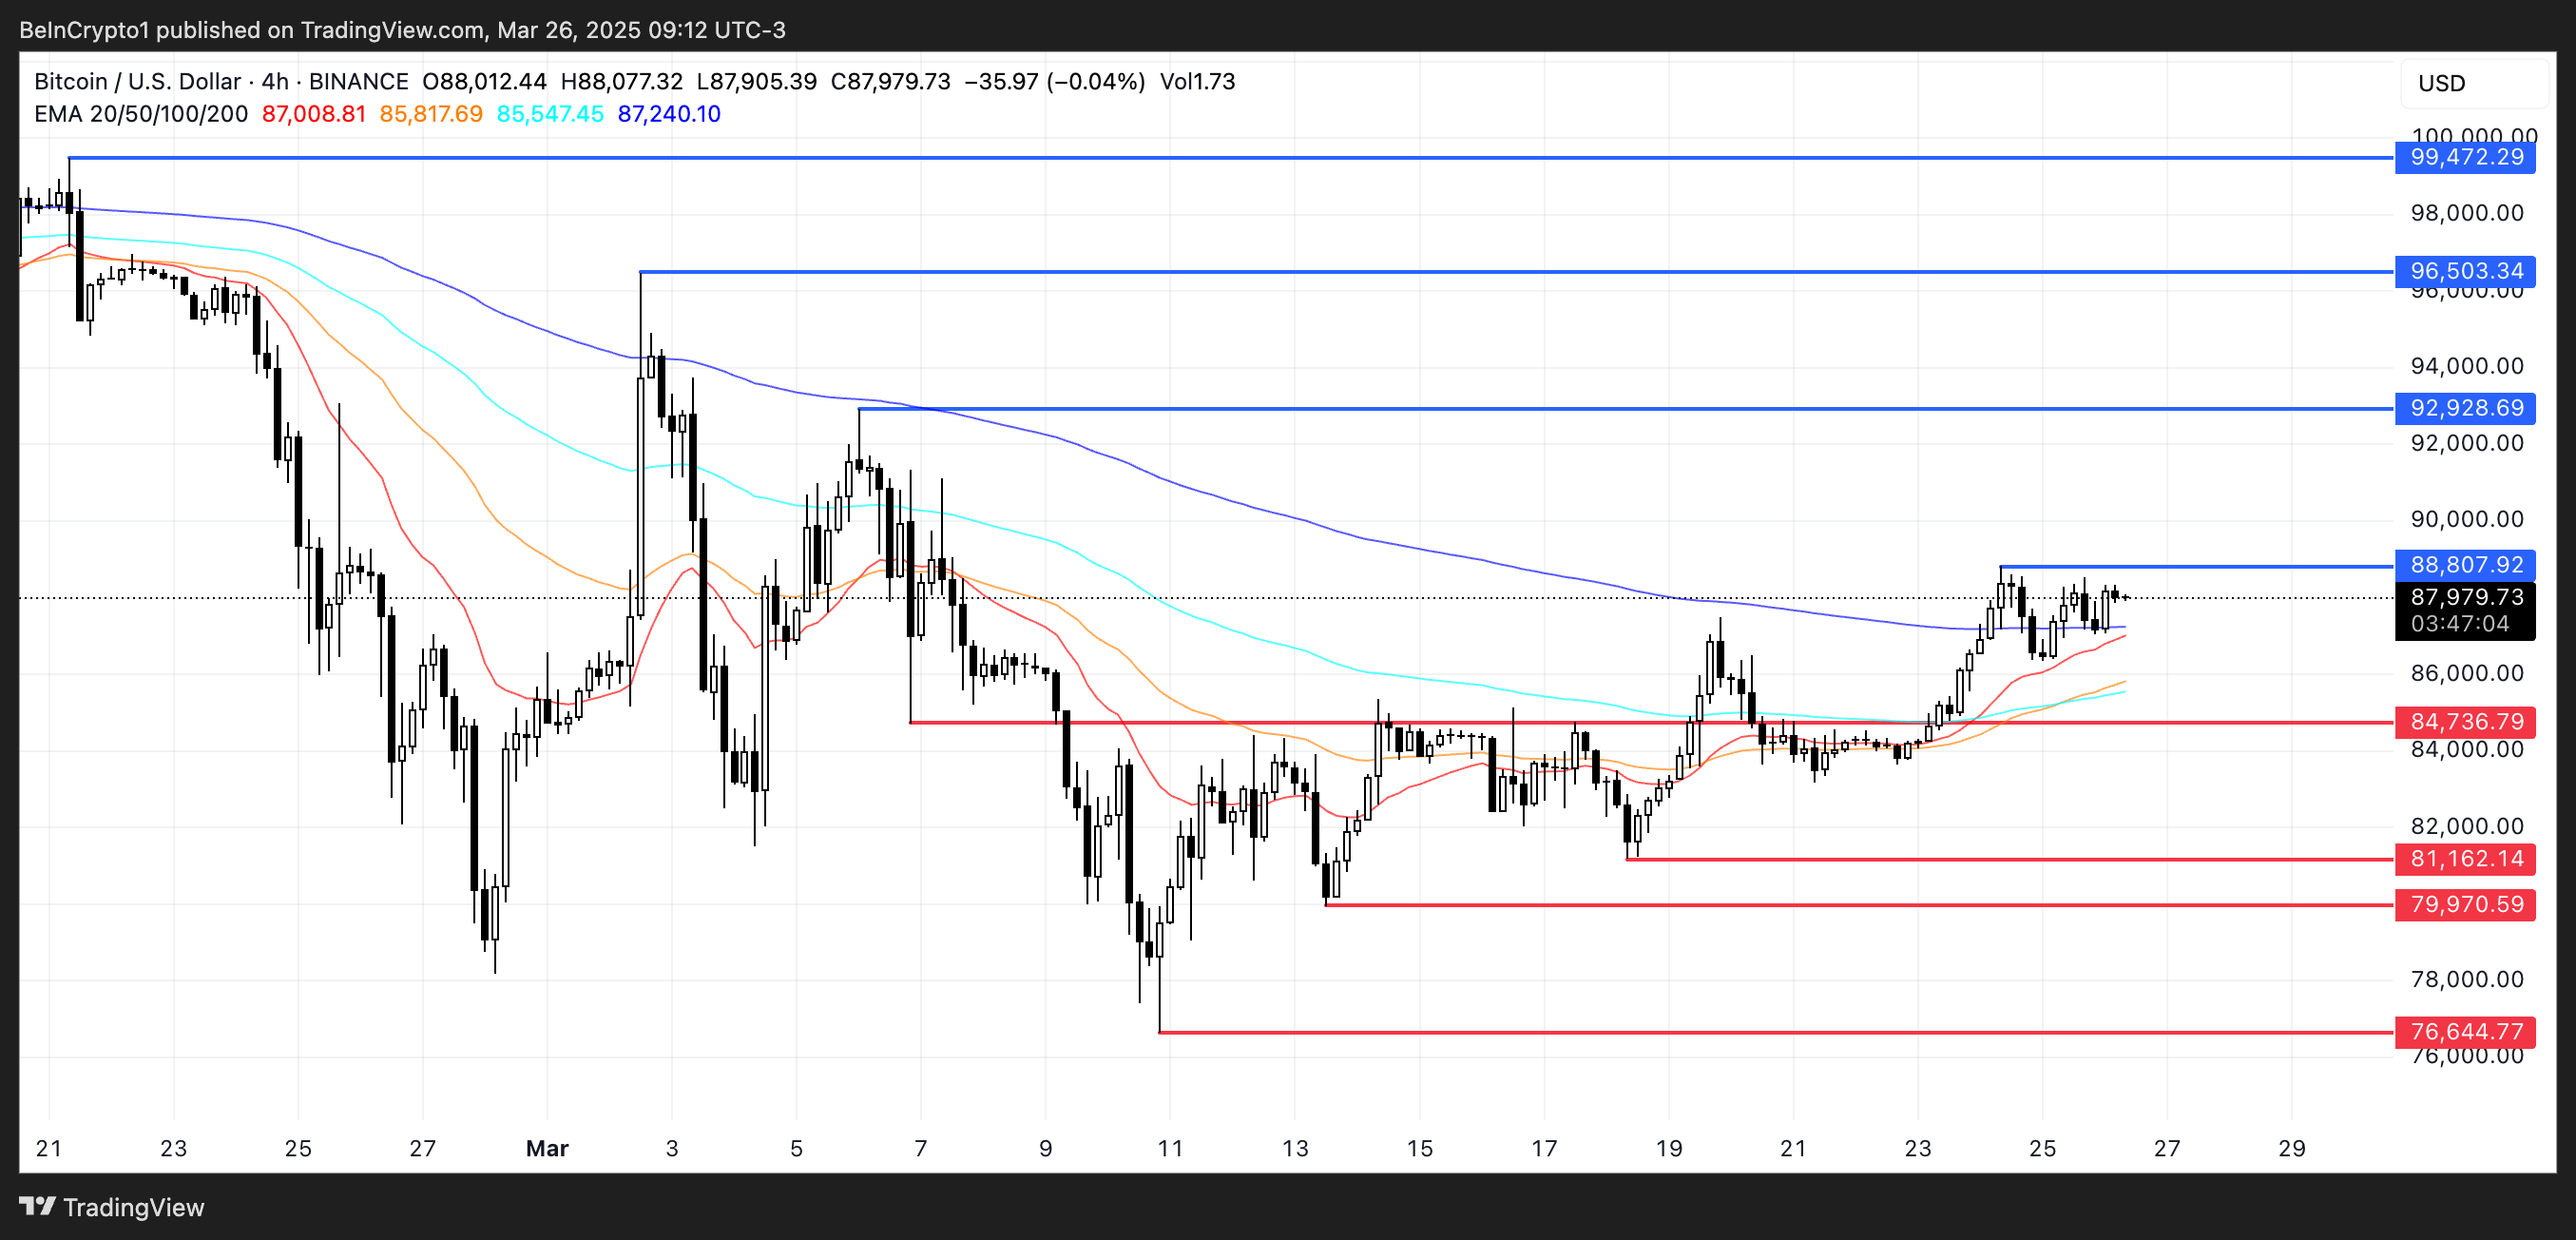
Conversely, if Bitcoin fails to break through $88,807 and experiences a trend reversal, it could test support at $84,736. A drop below this level could lead to a further decline to $81,162.
If selling pressure continues, BTC could revisit $79,970 and $76,644, potentially falling below $80,000 again.


