Source: glassnode; Compiled by Bai Shui, Jinse Finance
Abstract
New demand inflow continues to weaken, with the market's absorption of profits and losses sharply contracting as clear evidence.
The scale of investor-locked profits and losses is now similar to the late stage of accumulation in 2024, with prices between $50,000 and $70,000.
The number of tokens at a loss for short-term holders has reached its highest level since 2018, indicating that most new investors are currently in a loss-making position. However, the dollar value of losses held by these tokens remains consistent with previous bull market conditions.
The supply of long-term holders has begun to grow again, highlighting investors' preference for holding and accumulating supply.
Weakening Demand
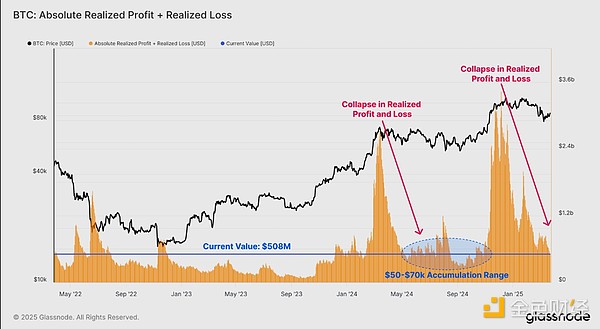
Currently, demand-side pressure is relatively small, with Bitcoin price continuing to fluctuate within a newly established trading range centered around $85,000. One method of quantifying demand is to assess the realized profits and losses locked by investors, which provides key information about sell-side forces in the spot market.
We can explore this phenomenon through two key concepts:
Capital Inflow: New buyers purchase tokens at a price higher than the original cost of sellers (thus locking in realized profits), with new capital entering the network.
Capital Destruction: Holders sell at a loss (realized losses), with new investors buying tokens at a price lower than the original purchase price.
Ultimately, this indicator describes the premium or discount at which sellers are willing to trade, and the market price that buyers on the other side are willing to accept.
Currently, since the historical high of $109,000, total realized profits and losses have experienced a significant contraction, plummeting from $3.4 billion to $508 million (-85%). The indicator now records a value similar to the accumulation zone between $50,000 and $70,000 in 2024, indicating similar demand conditions.
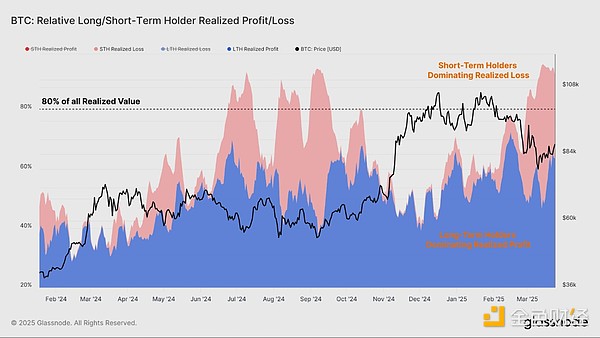
We can also note differences in consumption behavior between long-term and short-term holder groups.
It is worth noting that all losses come from the short-term holder group, who represent the most recent buyers and are therefore most likely to have bought at higher prices. The recent unpredictable and volatile market conditions are clearly a challenging environment for new investors.
In contrast, most profit-taking is realized by the long-term holder group, who have been in the market longer and have remained in a fully profitable state.
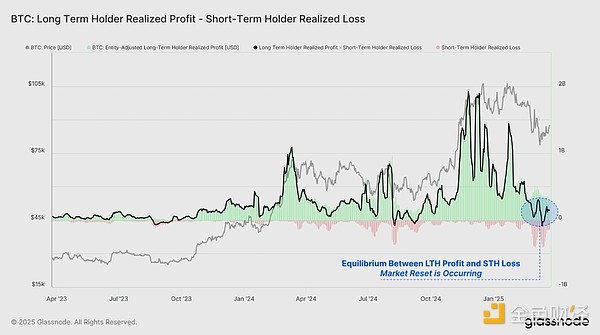
A typical characteristic of a sustainable bull market is continuous new capital flowing into the network, with capital inflow events far exceeding capital loss events.
When assessing the difference between long-term holders' profit-taking and short-term holders' loss realization, we can see that this indicator has returned to a neutral zone. Long-term holders' profits are now offset by an equivalent amount of short-term holders' losses.
This indicates that new capital inflow is relatively stagnant, demand-side forces are weakening, profit-taking volume is slowing but still significant, creating resistance.
Top-Heavy Market?
The short-term holder group is the main culprit for most losses during a bull market. This typically occurs during local market adjustments and during the final wave of selling when the market transitions to a long-term bearish structure. Therefore, they become the primary analytical group when measuring the severity and potential depth of market declines.
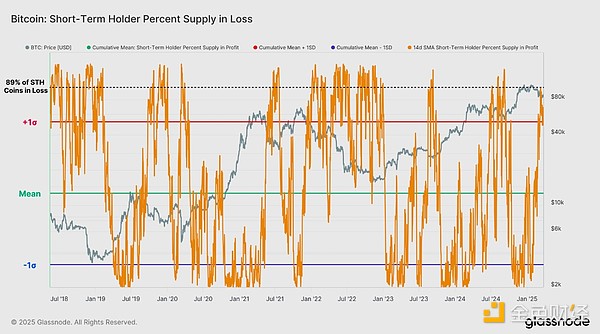
Recent downward fluctuations have created difficult conditions for new investors, with the supply of losses for short-term holders surging to 3.4 million BTC. This is the largest STH supply loss since July 2018.
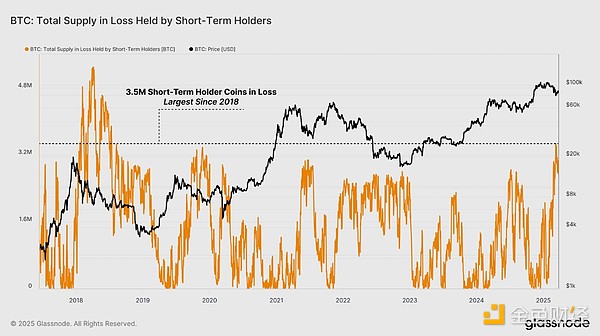
From a relative perspective, the loss supply percentage indicator has now broken through its +1SD interval, with over 90% of short-term holder supply currently underwater.
In our current bull market, this level of short-term holder losses has only occurred twice: during the downturn in August 2023 and during the Japanese arbitrage trading liquidation in August 2024.
This highlights the severity of the pressure faced by new investors and increases the likelihood of a market-wide selling event.
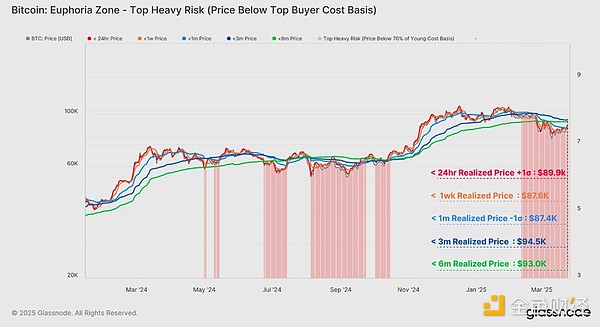
Another way to assess short-term holder stress is to evaluate the cost basis for each age subset within the group. We can view these as a banded momentum indicator with cost basis levels from fast to slow:
< 24 hours: $89,900
< 1 week: $87,600
< 1 month: $87,400
< 3 months: $94,600
< 6 months: $93,000
A key conclusion can be drawn from this insight: Most short-term holders who have held for at least 1 month are at a loss. Unrealized losses are spread across the entire short-term holder group, creating significant financial pressure and stress for investors.
Unrealized Potential
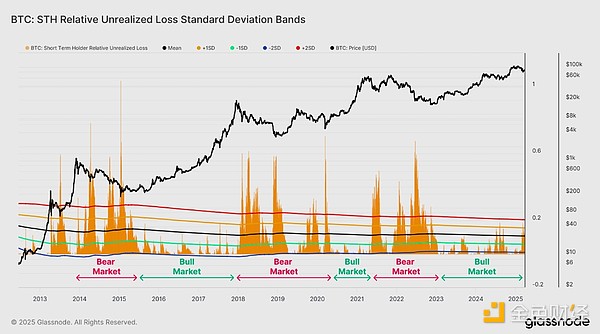
In the previous section, we identified that a large number of short-term holders now hold tokens at a loss. To complement this analysis, we can also evaluate the total dollar value of unrealized losses (book losses) held by these tokens.
Using these two indicators, we can better understand the extent of financial losses suffered by recent buyers and compare them across two related dimensions.
From the perspective of the unrealized loss indicator (book losses), short-term holders' losses are relatively high, being one of the largest losses in this cycle. However, the scale of book losses still remains close to the upper limit we typically see during most bull markets.
This suggests that while the financial pressure investors are experiencing is enormous, it has not yet reached levels considered unexpected or atypical within a bull market's upward trend.
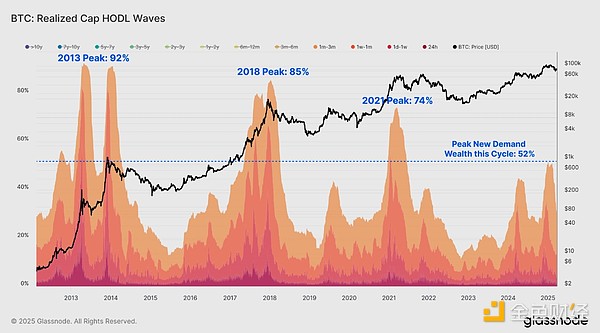
Historically, bull markets peak after most network wealth transfers from long-term investors to new, increasingly price-sensitive speculators. These speculators ultimately hold most of the supply at a high cost, making them highly sensitive to price declines.
Currently, short-term holders hold about 40% of network wealth, reaching a peak of 50% in early 2025. This peak is still significantly lower than previous cycles, where new investors' wealth reached peaks of 70-90% near the cycle's peak.
There are several possible explanations:
So far, the 2023-25 cycle has experienced a longer period of sideways consolidation. This has allowed supply to be gradually reallocated, with investors subsequently adapting to new price levels.
Bitcoin in 2025 will be better understood by retail and institutional investors. Therefore, long-term holders may be more likely to hold more supply for a longer time, having formed a more solid conviction.
The presence of large institutional investors and potentially longer time horizons and allocation preferences of ETFs. Thus, a larger proportion of supply may be held long-term.
Many factors may influence this dynamic, highlighting the evolution of Bitcoin investment arguments for new and old Bitcoin holders.
Building Long-Term Holders
Periods of significant BTC price increases are often accompanied by rising selling pressure as investors realize profits. Historically, long-term holders have been the primary group to leverage high prices during bull markets.
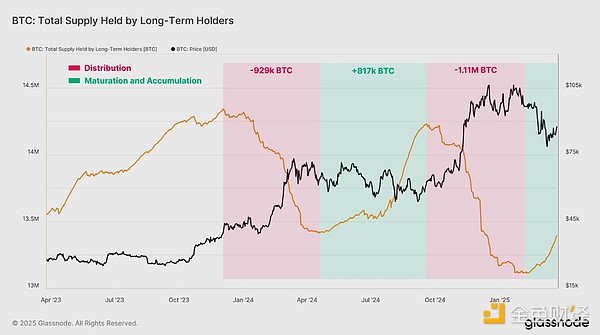
In the current cycle, a unique market dynamic is forming, with LTH distribution followed by accumulation periods, creating a more controlled and stable market environment. So far, there have been two waves of distribution and accumulation:
Distribution 1: LTH distributed -929k BTC
Accumulation 1: LTH accumulated +817k BTC
Distribution 2: LTH distributed -1.11M BTC
Accumulation 2: Currently +278k BTC
Across these two distribution waves, selling pressure has exceeded 2 million BTC. Generally, such a selling quantity would be sufficient to end the previous bull market. However, the subsequent re-accumulation period has offset most of the distribution to date.
This balance between distribution and accumulation periods may be the key factor leading to the orderly price structure we are experiencing, where price surges lead to intense distribution and profit-taking, followed by a lateral price movement as investors re-accumulate supply.
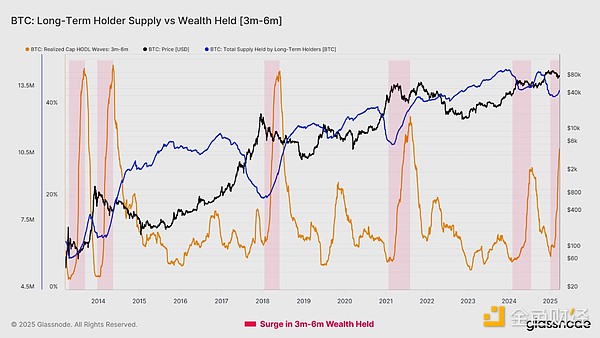
Token wealth held for 3-6 months provides further evidence of the second accumulation wave. This is a very special group, existing at the transitional boundary between short-term and long-term holder groups. It captures the supply pool most likely to migrate to LTH status in the coming weeks and months.
Currently, the total held wealth of the 3-6 month group is increasing significantly, indicating that tokens acquired when the market first traded at $100,000 are beginning to enter this range.
This group represents top buyers who have not yet capitulated under market conditions, highlighting investor confidence and patience. As long as this group continues to hold, such behavior can be seen as a precursor to long-term holder supply growth.
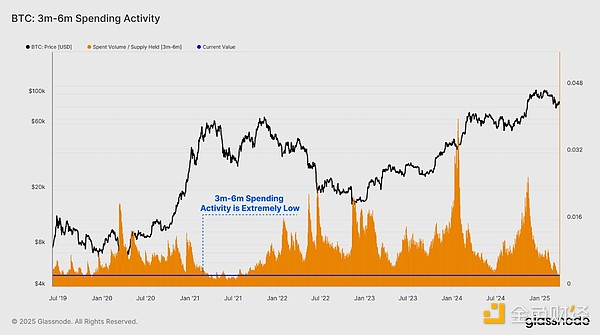
Moreover, when we normalize their spending amount, we can see that their spending activity has been most subdued since the economic downturn in May 2021.
This confirms the dominance of inactivity among these investors, indicating that the HODL motivation remains quite strong, and many have not been deterred by paper losses and volatile market conditions.
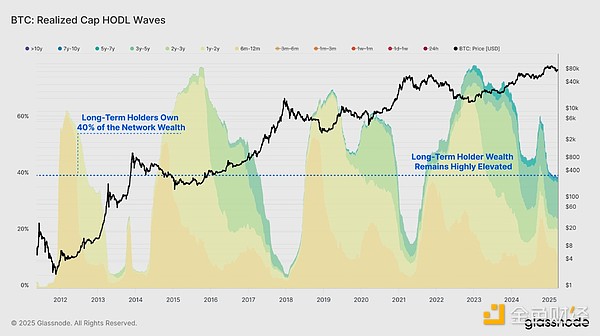
The other side of these observations is that the long-term holder group still retains a considerable portion of network wealth, holding nearly 40% of investment value.
These holding and accumulation periods may gradually constrict the supply side, which over time could create conditions for a new wave of demand, thereby establishing the next upward trend.
Summary
The BTC market is trading in a new range between $78,000 and $88,000. The scale of on-chain profit and loss events is declining, highlighting weak demand conditions and minimal selling pressure.
Short-term holders are currently facing significant financial pressure, with most of their assets being at a loss relative to their original cost basis. While the STH group is predominantly at a loss, the long-term holder group is re-entering an accumulation period, and we anticipate their total supply will grow in the coming weeks and months.


