

Movement Network (MOVE) is gaining attention after announcing a $38 million share buyback in response to inappropriate activities by Binance market makers. After a sharp price increase and subsequent correction, MOVE has still risen by over 13% in the past 7 days.
Key indicators such as RSI and DMI suggest that the upward momentum is cooling down. However, a new trend may form depending on market sentiment.
Is MOVE Overbought in the Market?
MOVE's Relative Strength Index (RSI) is currently at 56, significantly down from 83 two days ago. This occurred after announcing a $38 million share buyback following the discovery of inappropriate activities by Binance market makers.
RSI is a momentum measurement indicator that measures the speed and magnitude of price movements on a scale from 0 to 100.
Over 70 indicates an overbought state and potential correction. Below 30 indicates an oversold state and potential rebound. Between 30 and 70 is considered neutral, with 50 being the midpoint.
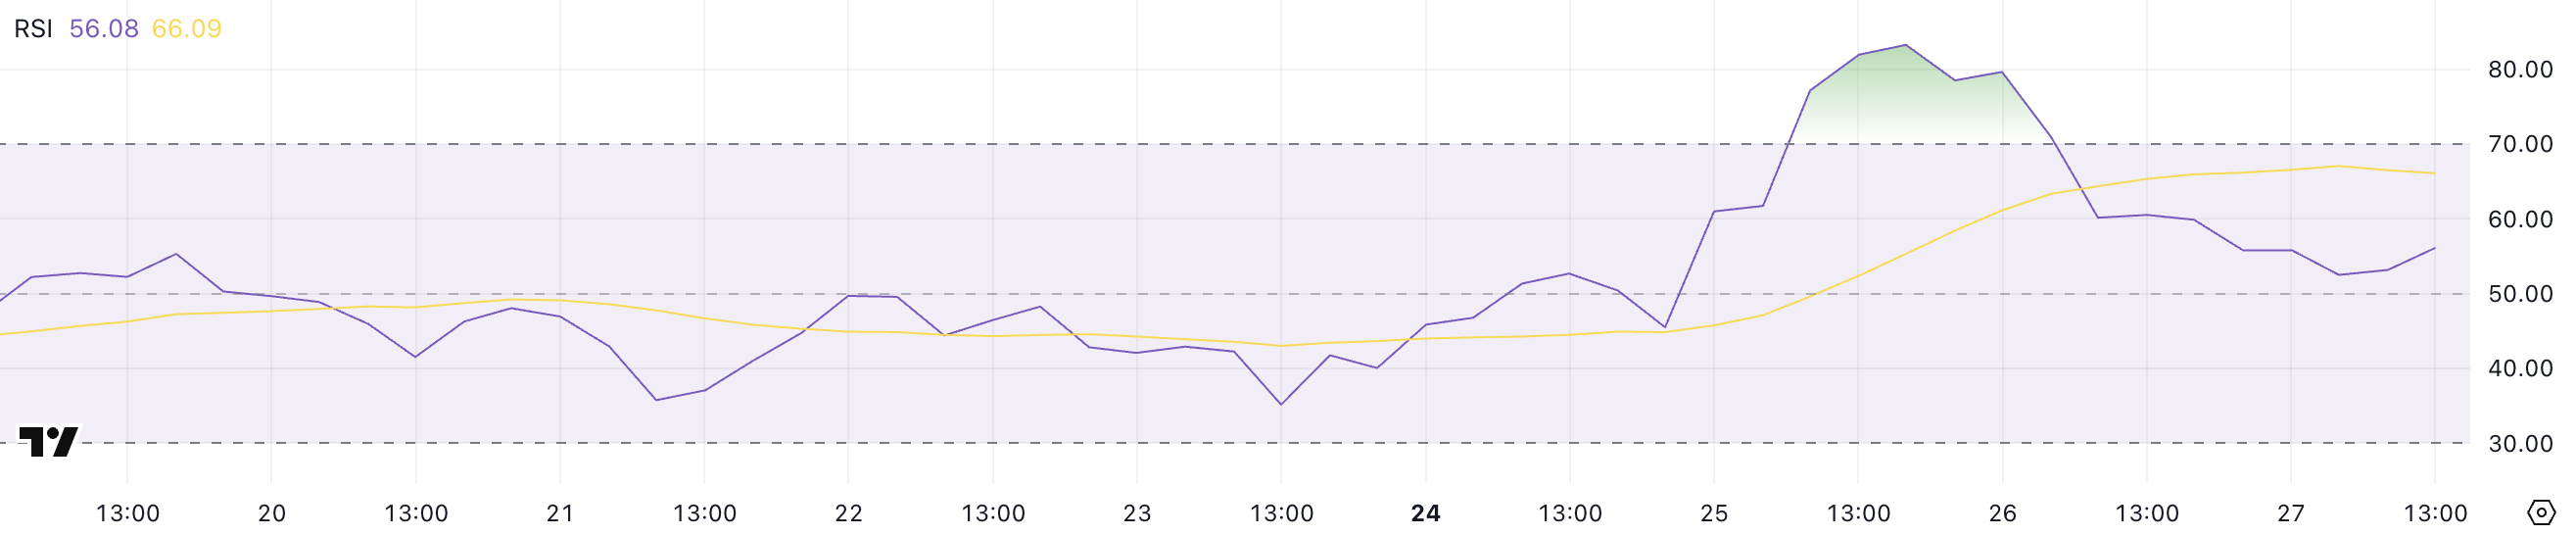
Before the recent surge, MOVE's RSI remained in the neutral zone for 23 consecutive days, reflecting low momentum and price stability.
After pushing the RSI into the overbought zone, it has been adjusted to 56, indicating that extreme upward momentum is cooling down.
At 56, it is still in the neutral zone but shows a slight upward trend, suggesting that altcoins may be consolidating for their next move. If buying interest returns, the current RSI level technically provides room to rise further without being overbought.
DMI Suggests Potential Loss of Buyer Control
MOVE's DMI chart shows the Average Directional Index (ADX) is currently at 32.97, having sharply increased from 9.74 two days ago and remaining stable since yesterday.
ADX measures trend strength on a scale from 0 to 100. Values below 20 indicate weak or non-existent trends. Between 20 and 25 implies a trend is beginning to form, and above 25 confirms a strong trend.
With MOVE's ADX now exceeding 30, it indicates that recent price movements have formed a definitive trend.
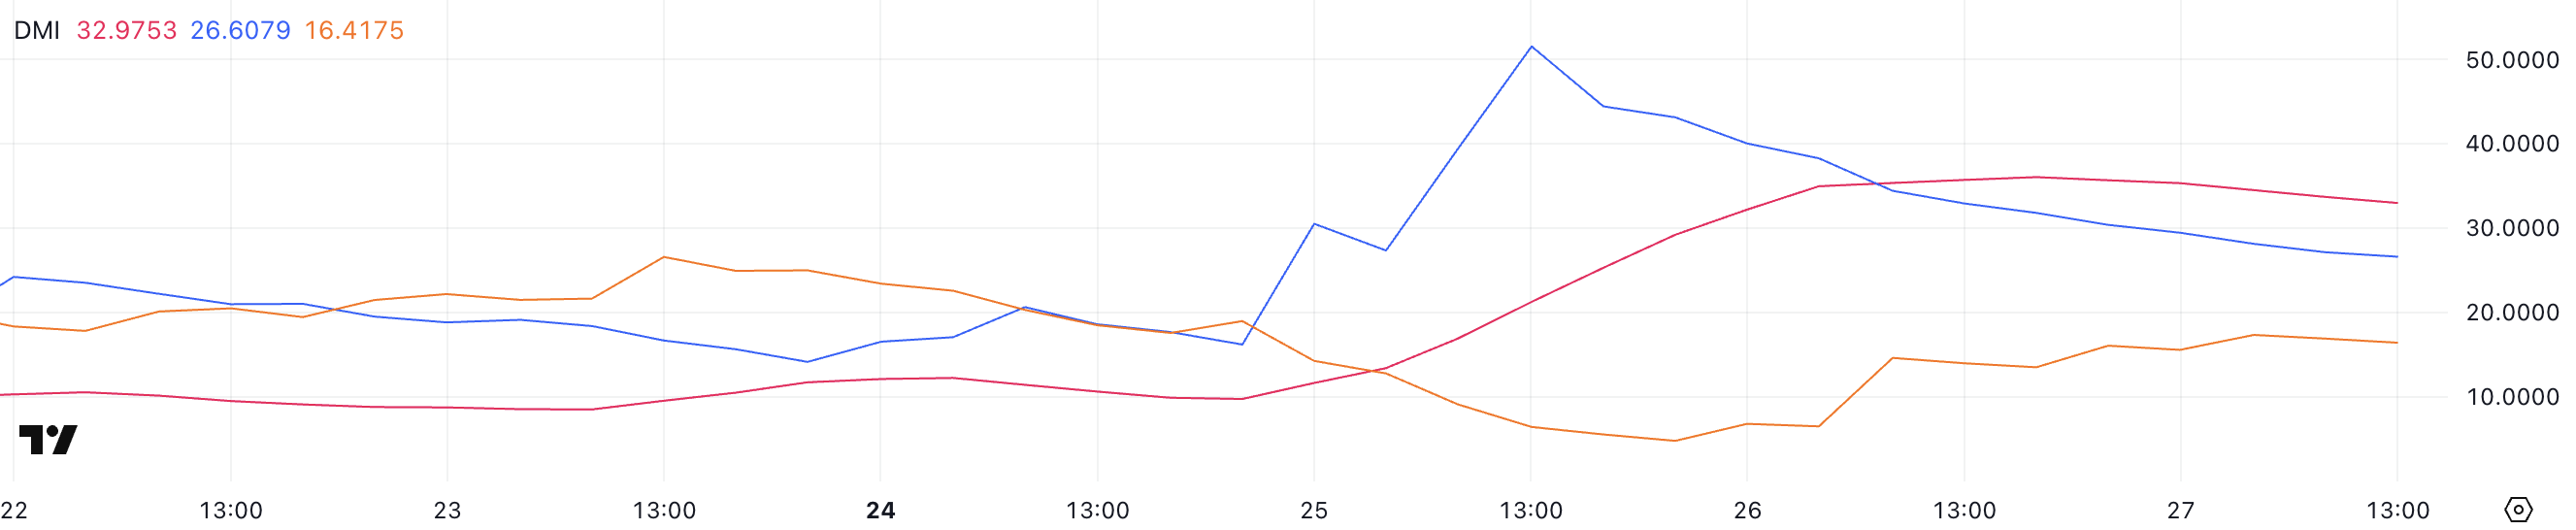
Along with ADX, +DI (positive directional indicator) and -DI (negative directional indicator) provide insights into trend direction.
Currently, +DI is 26.6, down from 51 two days ago. Meanwhile, -DI has risen from 6.43 to 16.41 during the same period.
This indicates that upward momentum has cooled after the recent surge and downward pressure is gradually increasing. While ADX shows strong trend intensity, the narrowing gap between +DI and -DI suggests weakening upward momentum, which could mean the trend might weaken or reverse.
According to these indicators, MOVE may enter or experience a correction unless new buying pressure emerges.
Will MOVE Drop Below $0.40 in April?
After a 30% surge on March 25th, becoming one of that day's top-performing altcoins, MOVE has entered a correction phase. The altcoin has fallen 11% from its recent peak.
Such correction is common after sharp movements as traders realize profits and momentum cools. The current correction is focusing on several key support levels, with the first at $0.479.
If this level doesn't hold, MOVE could further decline to $0.433 and $0.409. Additionally, if downward momentum continues into April, a deeper drop to $0.37 could be possible.

However, if sentiment in the MOVE ecosystem improves and trust is restored, the current correction could be short-term.
If a rebound occurs, MOVE could retest the $0.539 resistance. A successful breakthrough could open the way to $0.55 and potentially $0.60, which was not breached yesterday.


