

1/14
How bad off is the US consumer?
This is kind of horrifying when you consider:
-An all time high in credit card debt
-A low personal savings rate
-An explosion in BNPL loans (Klarna etc)
-Barely any increase in personal expendable income
-Exploding personal interest twitter.com/unusual_whales/sta...
2/14
Add in the fact that we've got a dicey economic outlook, potentially more inflation, and a decline in the US dollar, and having such a large portion of US wealth sitting in volatile assets could put consumers in a tough spot.
So how bad off are consumers?
3/14
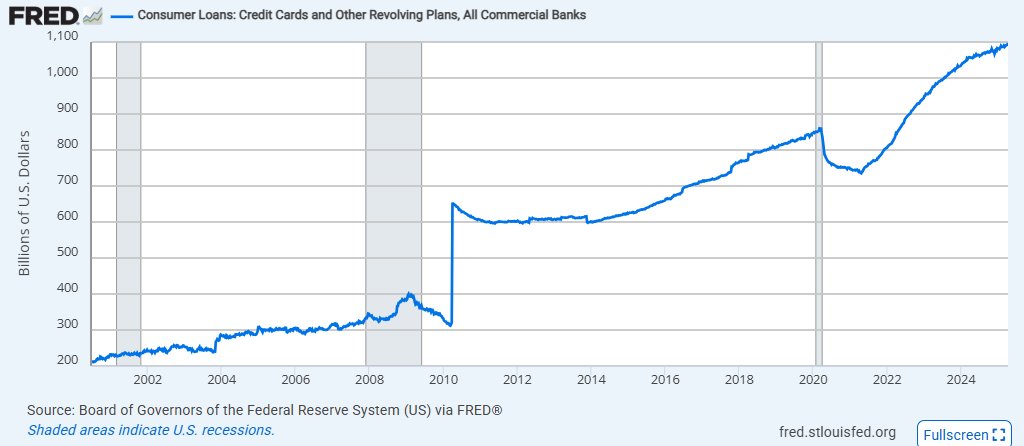
Total consumer loans:
This chart represents total loans out to consumers, in billions, mostly driven by credit card debt, which is seeing a near record high in missed payments, and is at the high end of historical interest rates.
So we have more debt than ever.
4/14
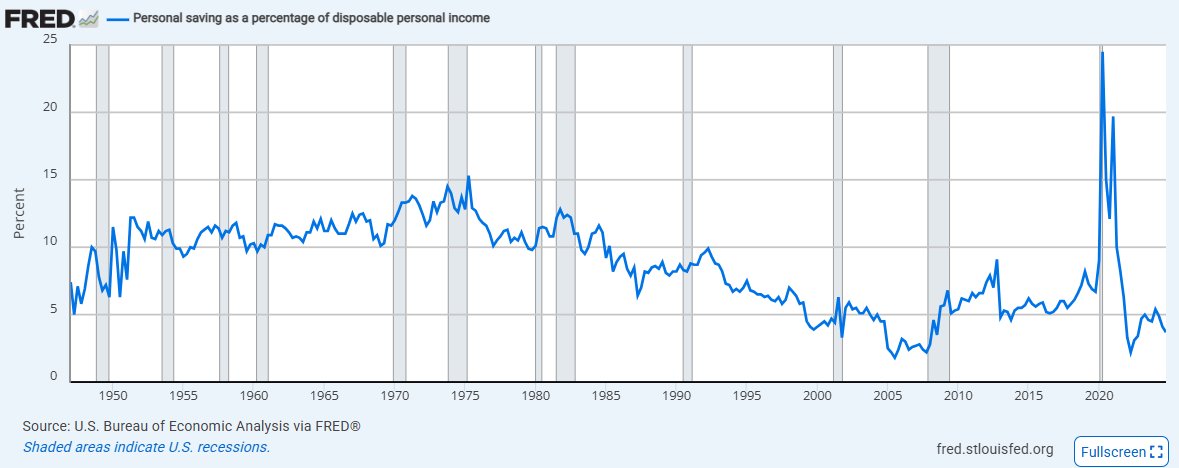
Personal savings as % of disposable income:
We're also saving less of our income than almost any time in history excluding the era after the 2008 market crash.
Meaning most American's are barely keeping their head above water.
5/14
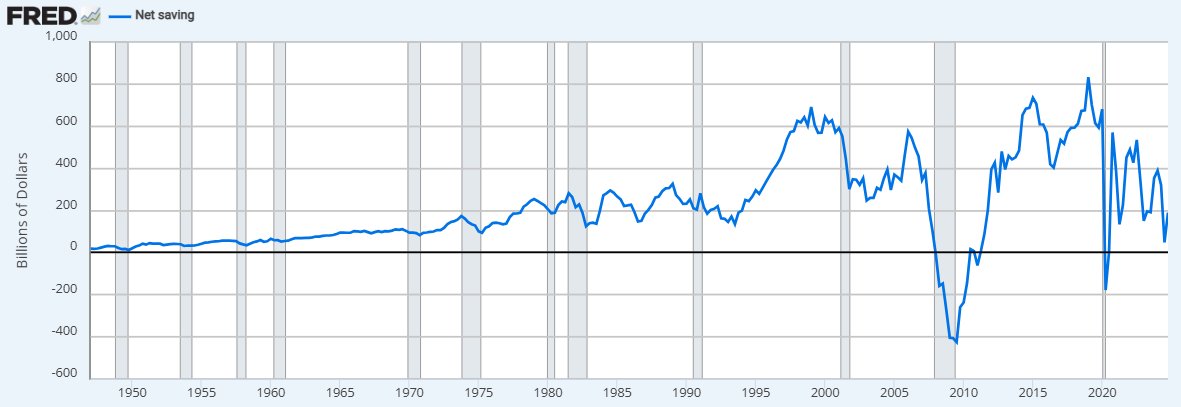
Personal savings net:
The personal net savings rate is so low that it means a large portion of American's are starting to draw on their savings to make payments on every day life.
This has only gone negative in the worst economic conditions like 2008 and covid.
6/14
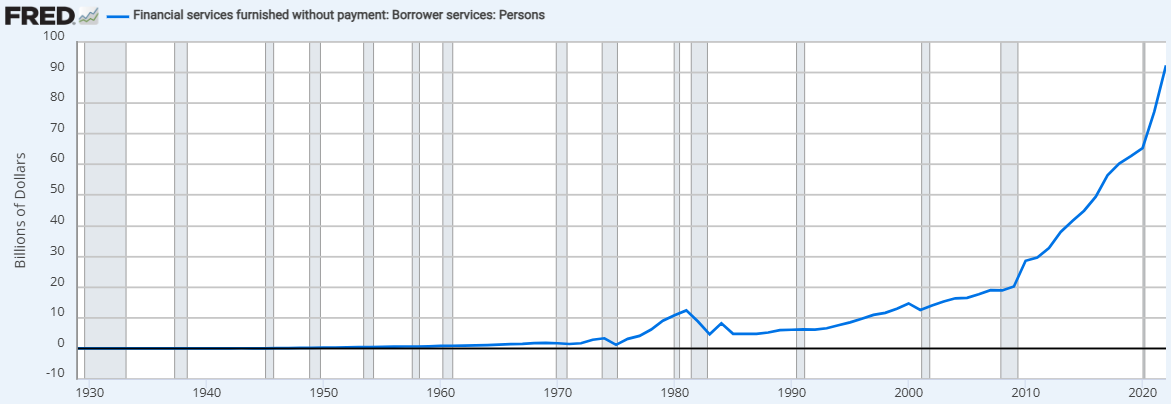
Borrows without payment (incl BNPL):
There has also been a huge increase in the rate of unfurnished zero payment borrowing including buy now pay later.
With changing regs the Fed stopped tracking this in 2022 before it even really took off. We think this number is close
7/14
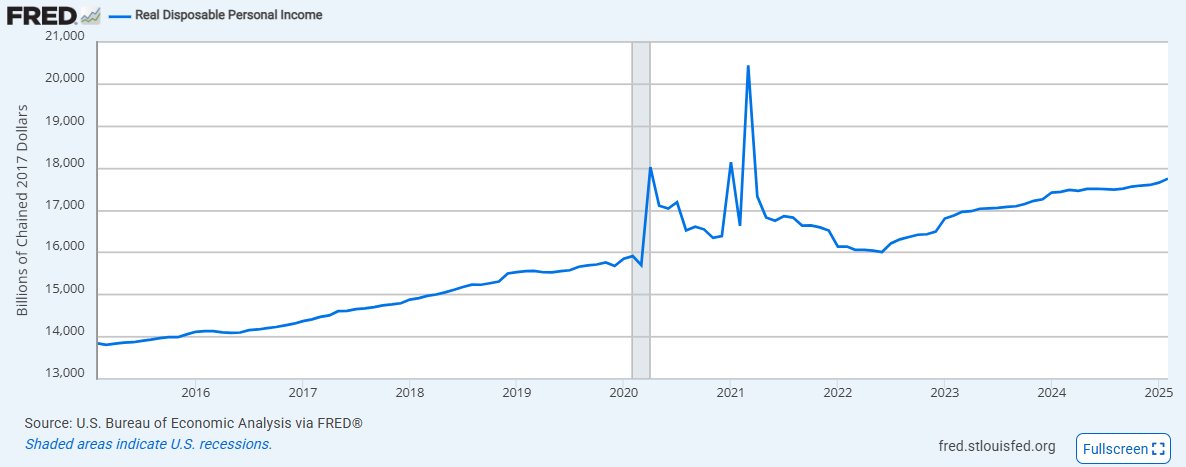
Personal expendable income:
Meanwhile the US consumer has barely seen an increase in their personal expendable income - it certainly isn't keeping up with the rapid changes in expenditure.
8/14
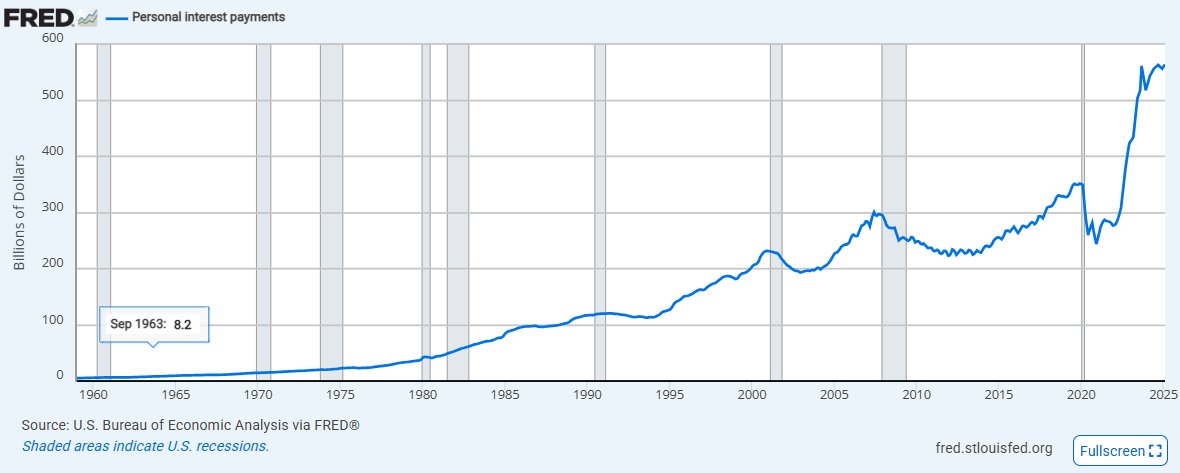
Personal interest payments:
And with shifting rates and more access to debt, American's are paying exponentially more in interest payments than ever before.
More than 2x than we were just 5 years ago.
9/14
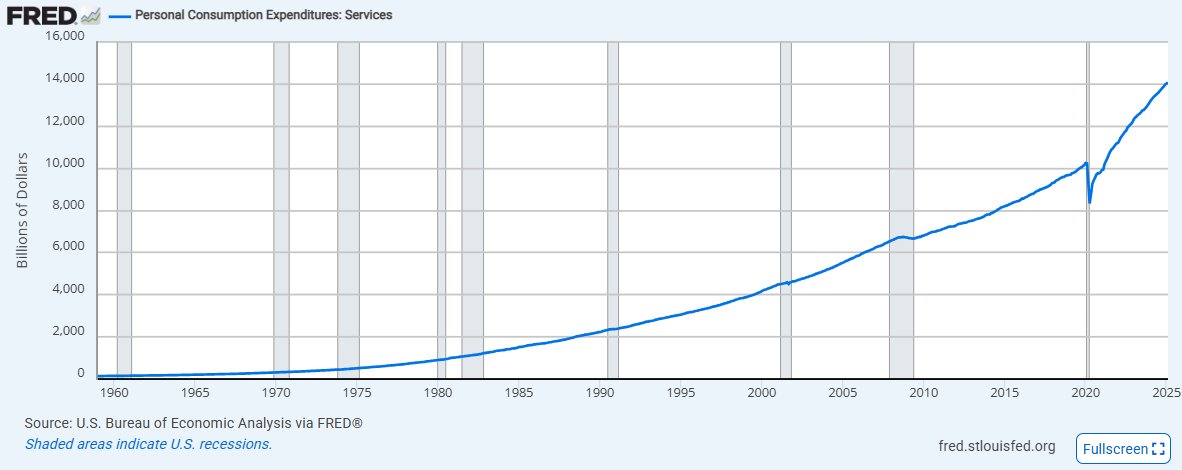
Personal consumption expenditure - services:
Meanwhile inflation remains sticky, less so in goods, but more in services as we continue to see a steady and sharper incline in the cost of services, but less and less of that making its way to the worker.
10/14
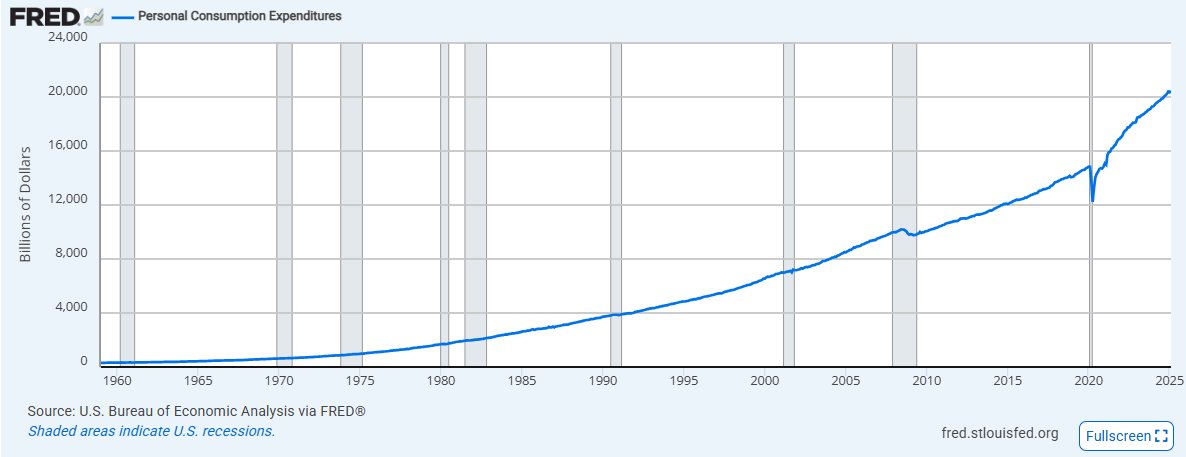
Personal consumption expenditure aggregate:
And our overall cost of living continues to increase at a rate much steeper than the Fed's targeted background rate of inflation.
Meaning each day life gets a little more expensive.
11/14
Factor these out and we have higher costs, more debt, and less spendable income and savings than ever.
So why are we seeing a higher portion of that in stocks?
Desperation.
12/14
Just like with crypto memecoins, memestocks, gambling and the overall "Squid Game-ification" of the world, fewer and fewer households see a way out of their financial predicament through hard work and savings.
Meaning they move further and further out the risk curve.
13/14
Which when the US has a negative economic outlook, and bills still need to get paid, and there is a mountain of hidden high-interest debt out there, creates systematic risk.
14/14
So it'd be easy to think that more stock ownership than ever is a good thing.
But in this financial condition, it's a major risk factor unless the market finds stable footing soon!
Sector:
From Twitter
Disclaimer: The content above is only the author's opinion which does not represent any position of Followin, and is not intended as, and shall not be understood or construed as, investment advice from Followin.
Like
Add to Favorites
Comments
Share


