

Ethereum (ETH) is under pressure as it attempts to recover from one of the poorest performing years among major cryptoassets, dropping nearly 50% in 2025. Despite signs of improving momentum, with RSI rising and EMA lines suggesting a potential breakout, ETH continues to lag behind competitors like Solana across various metrics.
The ETH/BTC ratio has dropped to its lowest level in years amid strong institutional selling. As ETH approaches an important resistance level, the market remains divided, with optimists targeting a breakout and skeptics questioning the long-term relevance of the chain.
Ethereum Becomes Worst-Performing Cryptoasset in Top 5 for 2025
Ethereum is currently the worst-performing large cryptoasset in 2025, with prices dropping nearly 51% YTD, far behind Bitcoin (-5%), Solana (-25.5%), BNB (-13.5%), and even XRP, which is up 1%.
This severe underperformance has raised increasing concerns about Ethereum's future, especially as alternative chains like Solana and Base continue to grow strongly.
Solana is currently leading the industry in key on-chain metrics such as DEX volume, application revenue, and user activity, while Base is quickly attracting developer attention.
As these competitors emerge, Ethereum's dominance is being increasingly challenged both narratively and in usage, with some analysts even suggesting that XRP's market capital could soon surpass Ethereum.
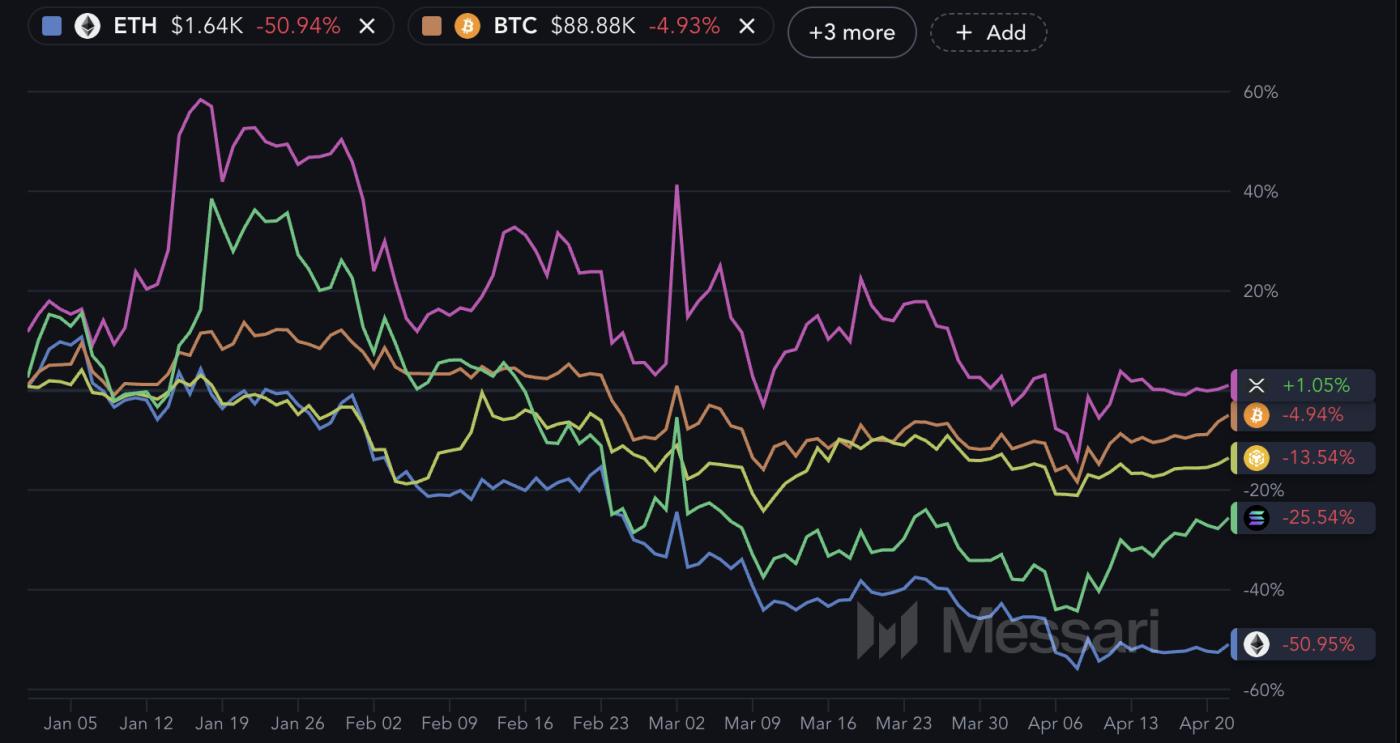 Performance of the largest cryptoassets in 2025. Source: Messari.
The ETH/BTC ratio has dropped to 0.01791 — its lowest level since 2020 — emphasizing the scale of Ethereum's decline relative to Bitcoin.
This decline has been accelerated by large sell-offs from institutions, including Galaxy Digital, which sold over $100 million in ETH in just one week. The Ethereum and Paradigm funds have also made significant transactions, contributing to investor anxiety. Additionally, Solana has recently surpassed Ethereum in staking market capital.
The issue becomes more serious as Ethereum's staking ratio remains low and Bitcoin's increasing dominance both shift market sentiment and capital away from ETH.
As a result, Ethereum's position as a leading smart contract platform is being questioned more seriously than ever before.
Ethereum Shows Recovery Signs, But Momentum Remains Limited
Ethereum's Relative Strength Index (RSI) has risen to 57.26, up from 42.43 just a day earlier, indicating a significant increase in short-term momentum.
RSI is a technical indicator measuring the speed and magnitude of recent price changes to assess whether an asset is overbought or oversold. It oscillates from 0 to 100, with values above 70 typically indicating overbought conditions and values below 30 indicating oversold levels.
Indices from 50 to 70 often suggest moderate price momentum, while indices from 30 to 50 lean towards a declining or neutral trend.
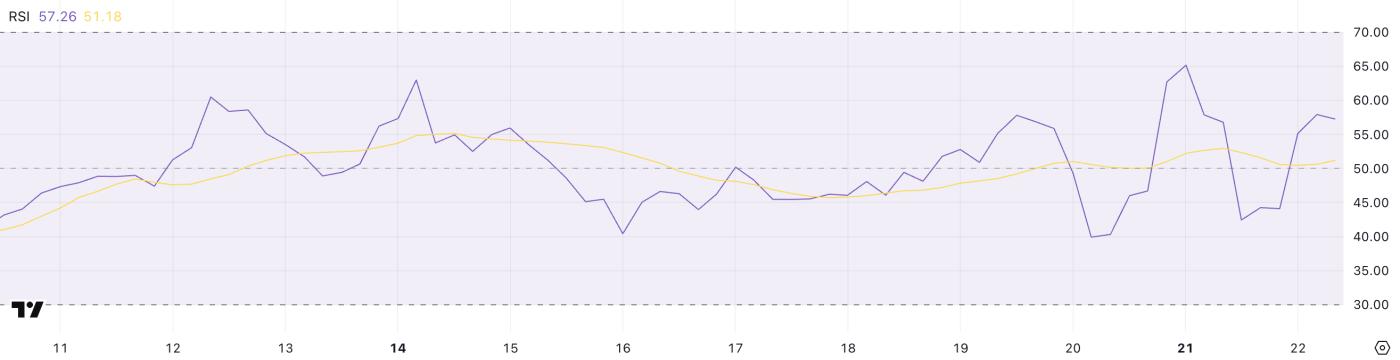 ETH RSI. Source: TradingView.
With ETH's current RSI at 57.26, the asset is in a neutral to bullish zone. It indicates improving momentum but not strong enough to indicate overheating.
Importantly, Ethereum hasn't seen an RSI above 70 since March 24 — nearly a month ago — suggesting that despite recent recovery, it hasn't entered an overbought zone or shown signs of a sustainable breakout.
This suggests cautious optimism: while buyers are regaining control, Ethereum still lacks the strong momentum typically driving significant price increases. If RSI continues to rise and surpasses 70, it could indicate a return of stronger bullish sentiment.
Ethereum Faces Resistance as Market Questions Its Future
Ethereum's EMA lines are beginning to show signs of a potential price reversal. The price is currently approaching an important resistance level at $1,669. If this level is broken, Ethereum's price could target the next level at $1,749.
With strong momentum, it could even reach $1,954 — its first time above $1,900 since April 2. Short-term EMA lines are moving closer to long-term lines, a setup supporting this price increase prospect. Increasing trading volume would further reinforce this case.
A successful breakout could help restore some investor confidence in a challenging year for ETH.
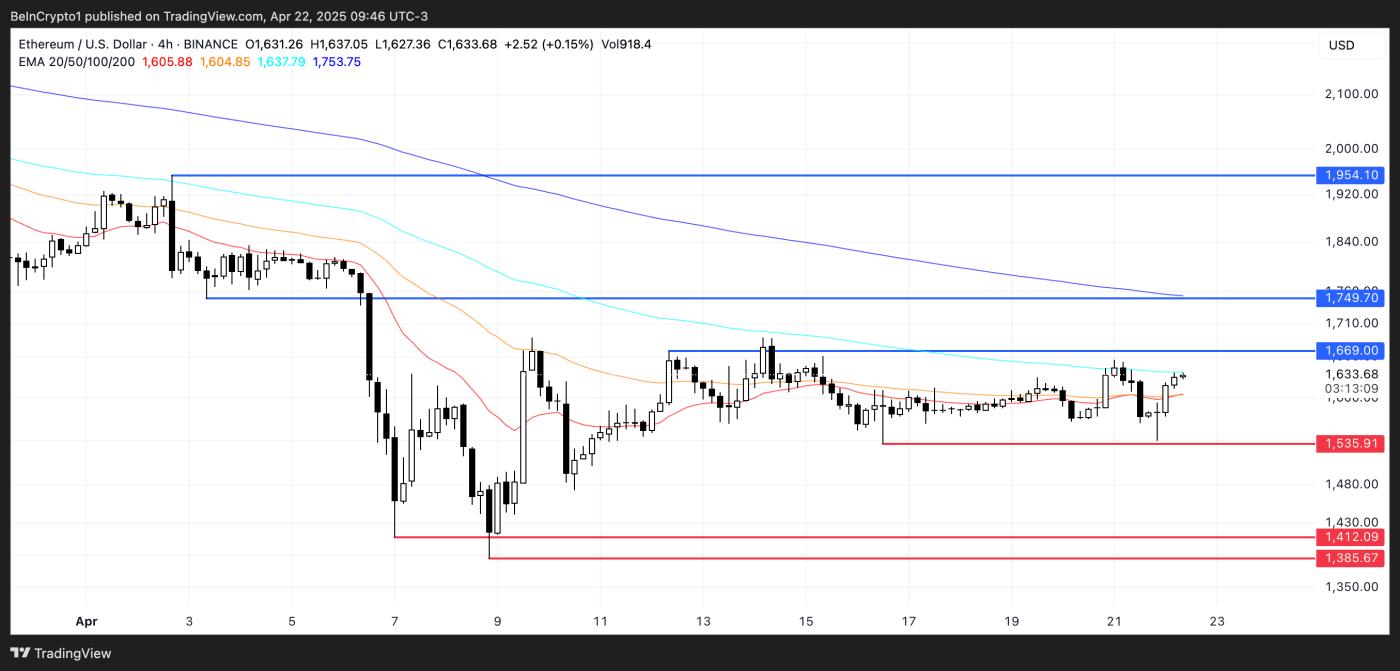 ETH Price Analysis. Source: TradingView.
However, skepticism about Ethereum's long-term position continues to grow in the crypto community, especially as competing chains increasingly attract attention.
If ETH cannot maintain its momentum, it may retest the support zone at $1,535. If it breaks below this level, the structure will shift to a downward trend, opening price decline targets at $1,412 and potentially $1,385.
In such a case, Ethereum's failure to reclaim important levels could further increase doubts about its competitive advantage, especially as faster and cheaper alternatives are increasing their activity.


