

Hedera (HBAR) enters May with a fragile but potentially explosive technical setup, as futures activity cools down and price volatility closely tracks Bitcoin's momentum. HBAR Futures volume remains low, indicating a decline in speculative interest compared to earlier this year.
Meanwhile, HBAR continues to track Bitcoin's performance with increasing volatility. As BTC fluctuates around $100,000 and sentiment shifts to optimistic, HBAR could break critical resistance levels and rise to $0.40—or face deeper correction if technical support fails.
Low HBAR Futures Contract Volume Suggests Declining Speculation
Current HBAR Futures volume is $118 million, increasing from the recent low of $76 million on 04/19—the lowest in three months.
This follows a steady decline from much higher levels seen earlier this year.
Notably, HBAR Futures open interest peaked at $1.3 billion on 03/01 but has not exceeded $300 million since 04/12, indicating a significant drop in speculation around this token.
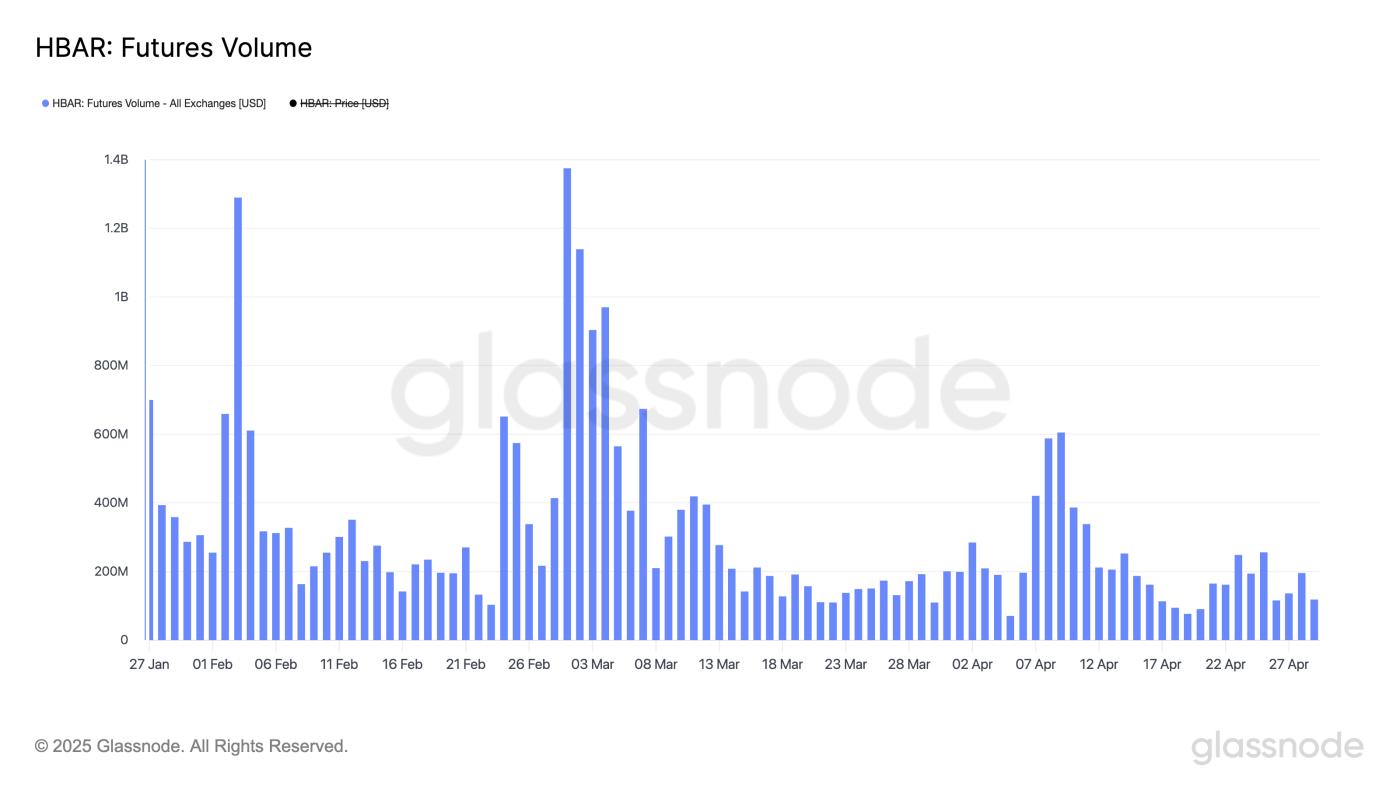 HBAR: Futures Volume. Source: glassnode.
Hedera Futures refers to derivative contracts allowing traders to speculate on HBAR's future price, the native token of the Hedera network. Both retail and institutional investors typically use these contracts for hedging or leveraged positions.
Futures volume and open interest are crucial market sentiment and liquidity indicators—higher volume often suggests stronger confidence or increased trading activity. Conversely, declining numbers may reflect reduced interest or belief in short-term price action.
Current low levels suggest recent HBAR price movements may have been more influenced by spot demand than leveraged speculation.
Hedera's High Correlation with BTC Could Drive Next Price Surge
HBAR has recently shown a high correlation with Bitcoin (BTC), often amplifying movements of the broader cryptocurrency market leader.
When BTC rises, HBAR tends to surge more strongly; conversely, HBAR typically experiences deeper corrections during market pullbacks. This pattern reflects Hedera's sensitivity to market sentiment and its position as a higher beta asset in the crypto space.
Consequently, changes in Bitcoin's trajectory, especially during periods of strong momentum, can significantly impact HBAR's price action.
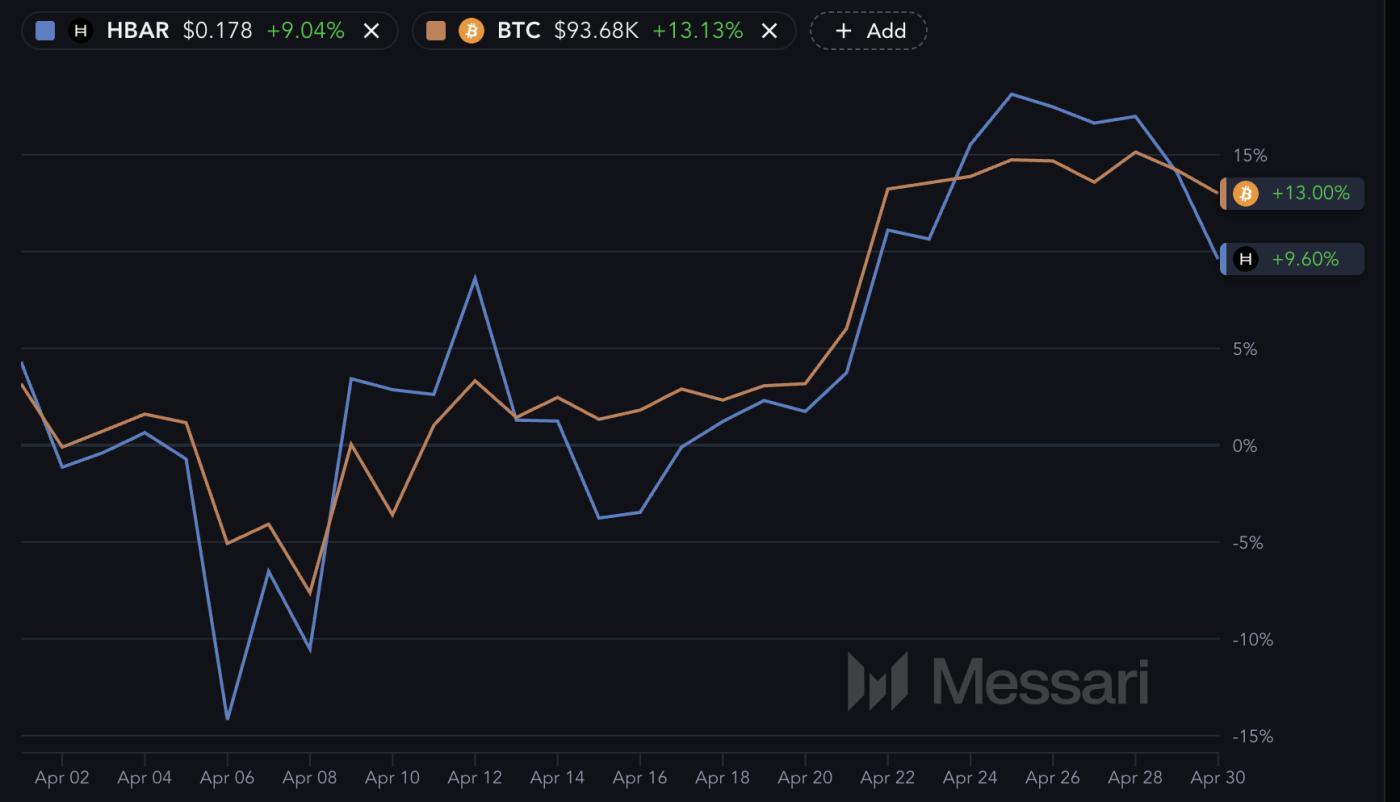 BTC and HBAR Performance in the Past 30 Days. Source: Messari.
With Bitcoin up 13% in the past 30 days and just 6.3% away from $100,000, the next surge could have a powerful spillover effect on HBAR.
On-chain data shows a clear recovery in BTC demand, while institutional sentiment is gradually improving, with ETF capital flows showing early recovery signs. If Bitcoin breaks $100,000, HBAR could benefit from new capital inflows and increased market excitement.
Given HBAR's tendency to outperform BTC during price increases, a decisive Bitcoin breakout could be a powerful catalyst for a broader Hedera movement.
Key Levels to Watch as HBAR Faces Potential Price Surge or Death Cross
HBAR price is facing a critical technical setup entering May, with potential for strong movement in either direction. On the upside, if HBAR can attract strong buying pressure and establish a sustainable uptrend, it could surge 123% to reach $0.40.
To achieve this, the token must overcome a series of critical resistance levels at $0.20, $0.258, $0.32, and $0.37—each of which has previously been a rejection point during past rallies.
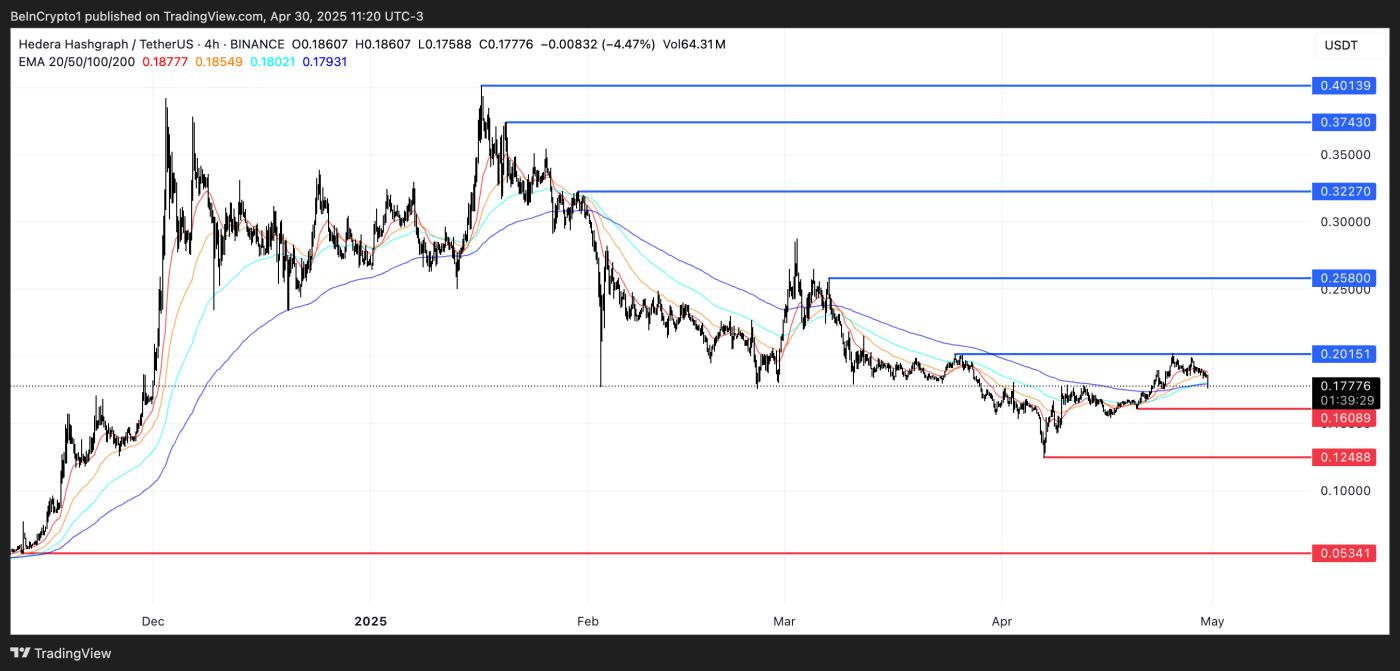 HBAR Price Analysis. Source: TradingView.
A successful breakout through these levels could signal new momentum and broader market confidence in Hedera.
However, downside risks remain present. HBAR's EMA lines show signs of an imminent Death Cross—a bearish pattern where the short-term medium moves below the long-term medium, suggesting a potential deeper correction ahead.
If this pattern is confirmed, HBAR might test initial support at $0.16. Failing to hold that level could lead to additional losses to $0.124, and in a more severe downtrend, prices could drop to $0.0053.


