Article source: Talk Li Talk Outside
Now, many people seem to be watching the market prices every day, especially those who are fully invested in Altcoins. Some are considering whether to cut their losses, while others are still hoping for a price increase to break even...
Recently, most messages received in the backend are about prices and what to buy, such as: Will Bitcoin really rise to $150,000 next? Do I have a chance to break even with my Ethereum at a cost of $3,800? I heard the Altcoin season is coming, what coins are recommended to buy now? And so on.
By looking at the user information in the public account backend, I found that most of these questions come from new followers of Talk Li Talk Outside who may not be confident about their investments, and thus place their hopes of making money (or breaking even) directly on others' opinions or suggestions.
At the same time, I also noticed an interesting phenomenon: since the new market trend restarted last month (April), the average number of unfollows per day is greater than new followers. In other words, the total number of followers in the backend has not only not grown but has slightly decreased over the past month.
However, I think this is good. Everyone should make choices suitable for themselves and reduce interference from others on their investment strategies. To be honest, Talk Li Talk Outside has always insisted on long-form content output, which may not be suitable for everyone. In the current context of massive information, fewer people can quietly and patiently spend time reading long articles. Some prefer fast food, some prefer sit-down meals - it's just a matter of choice. We will continue to output in a Buddhist-like manner, and everyone can follow as they wish.
Learning is often a process of going from many to few. For example, many people initially follow dozens or even hundreds of bloggers, or join dozens of different circles. Then, as they slowly form and establish a set of investment strategies or methodologies suitable for themselves, they may choose to start filtering and blocking most ineffective information interference and exit most circles, thereby maintaining better personal thinking and focus.
In short, everyone's background, experience, risk tolerance, thinking models, knowledge, observation angles, and interest demands are very different. Different perspectives may lead to different views on issues. Therefore, many problems do not need to be judged as right or wrong. Different people should make different choices, and only what suits oneself is the best. Especially in the investment field, we should not always fantasize about pursuing a universal, lazy-friendly, and instantly profitable money-making model. Real money-making models all have certain thresholds, such as capital thresholds, time thresholds, cognitive thresholds, and so on.
In the previous article (May 12th), we mainly discussed some macroeconomic factors affecting market trends. But regarding market trends, some people like to focus on macro factors, while others prefer to focus on some data or indicators. Next, let's list some dimensions from the data/indicator perspective:
For example, we can pay attention to changes in Funding Rates, as shown in the following figure.
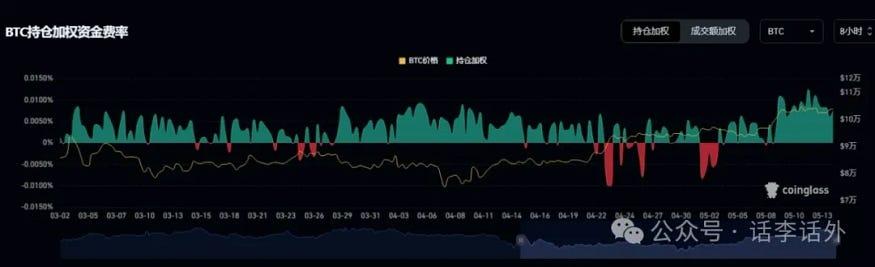
As the market has recently warmed up, more traders are bullish and willing to pay fees to bearish traders, so we can observe short-term market trends by tracking changes in funding rates.
For instance, we can also focus on changes in Open Interest, as shown in the following figure.
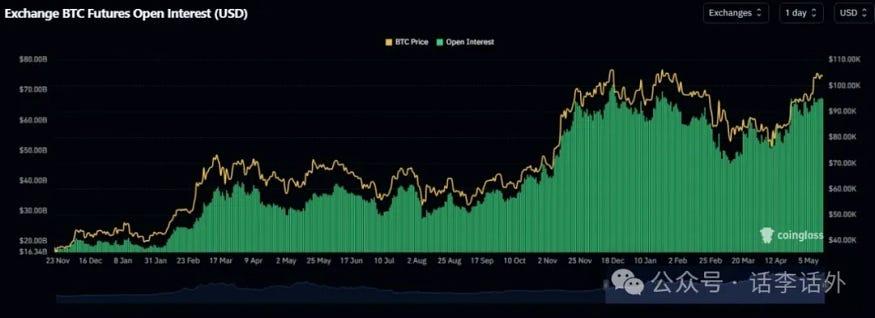
Open Interest can be an observation dimension of trading activity, and we can observe whether traders still have short-term trading interest by tracking changes in the maintained Open Interest range.
For example, we can observe changes in Stablecoin Inflows, as shown in the following figure.
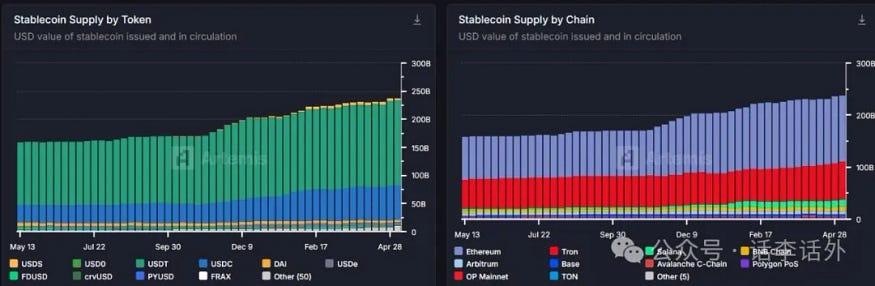
If there is no obvious fund outflow (negative inflow), it may mean that traders are still rotating funds between different projects, and there is no need to worry about short-term market fluctuations.
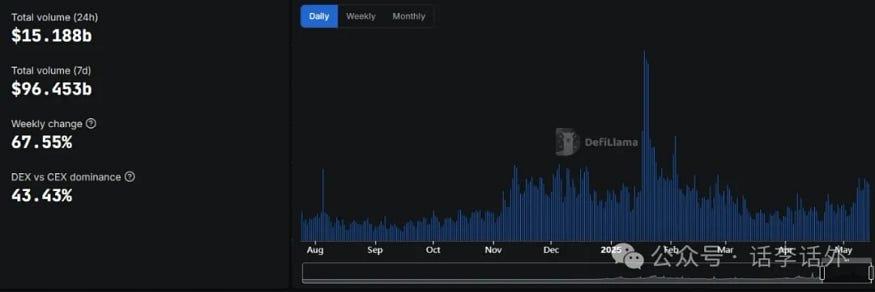
Or, we can judge market changes through trading volume changes between CEX and DEX, checking whether DEX trading volume has recently increased. An increase usually means strong current market demand and upward momentum, as shown in the following figure.
In short, different risk appetites correspond to different investment styles, and different investment styles have various information or data dimensions that can be used as auxiliary references, including long-term and medium-to-short-term investment perspectives.
The funding rates, open interest, and stablecoin inflows mentioned above can be used as medium-to-short-term reference dimensions. Additionally, you can record and summarize many other reference dimensions, such as the ETH/BTC ratio, BTC.D, USDT.D, Fear & Greed Index, Altseason Index, Speculative Sentiment Index, etc., which we have previously shared and introduced.
If you are interested in long-term Bitcoin indicators, you can directly use the "Bitcoin Indicator Template" we previously compiled, which includes over 35 comprehensive indicator data to observe and guide long-term Bitcoin trading, as shown in the following figure.

Of course, most people currently prefer to guide their trading directly through candlestick charts, which is perfectly fine. We have also organized some basic candlestick knowledge in previous articles, and interested readers can search and review Talk Li Talk Outside's historical articles.
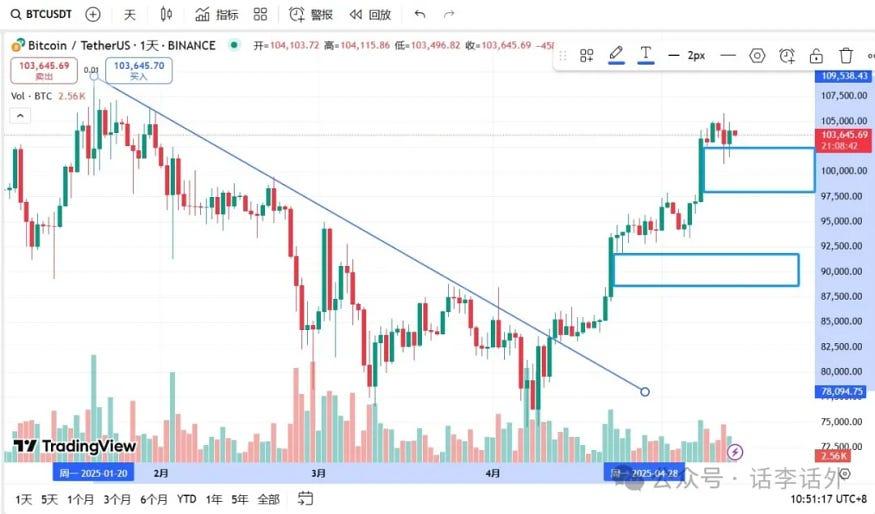
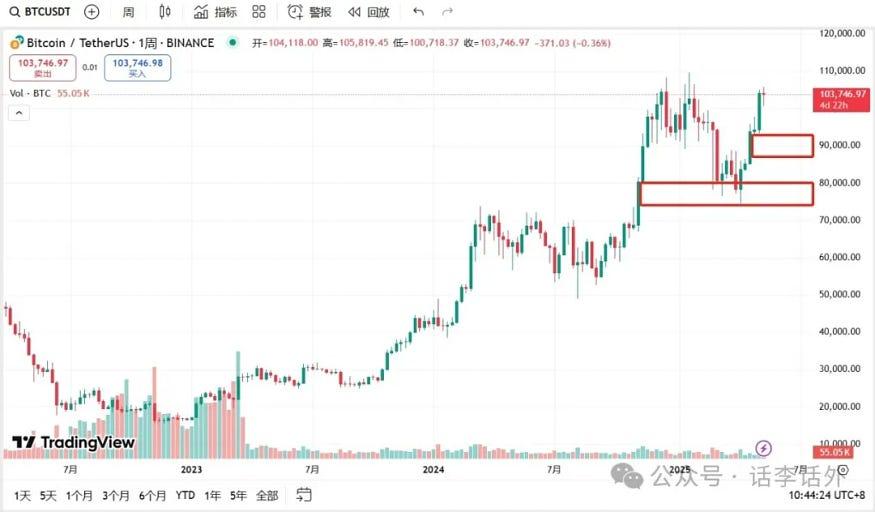
Here, let's take BTC as an example to look at the candlestick trend:
From the weekly level, MACD has crossed, showing a good upward trend, and Bitcoin is currently trying to touch its historical high. Considering the current comprehensive market sentiment, Bitcoin may enter a sideways consolidation after touching or breaking through the historical high in the short term, while BTC.D may continue to decline. However, the weekly level has formed an FVG gap (the red box I marked in the figure), and the $93,000 position needs attention. But it seems unlikely to drop to the next FVG position (around $80,000) in the short term, as shown in the following figure.
Continuing to look at the 4-hour level, the area around $98,000 is a position to watch. However, if it pulls back to this position, it will likely rebound again, and then the area around $93,000 may need to be filled. As shown in the following figure.