XRP has increased 10% over the past seven days but corrected by 4.6% on Thursday, indicating a potential change in momentum. The RSI has dropped below 50, Ichimoku indicators show prices sliding below important support lines, and EMA distances are narrowing – all pointing to short-term weakness.
Although XRP's broader trend remains technically bullish, current indicators reflect increasing vulnerability. Whether the recent correction will be deeper or form a foundation for recovery will depend on how XRP performs around current support zones.
XRP's Momentum Declines as RSI Slides Below 50
XRP's Relative Strength Index (RSI) has significantly decreased, from 65.13 yesterday to 46.95 today.
This decline clearly shows a loss of upward momentum in the short term and brings XRP back to the lower half of the neutral RSI zone.
This decline reflects a shift in sentiment, with traders potentially withdrawing from strong buying after recent price fluctuations.
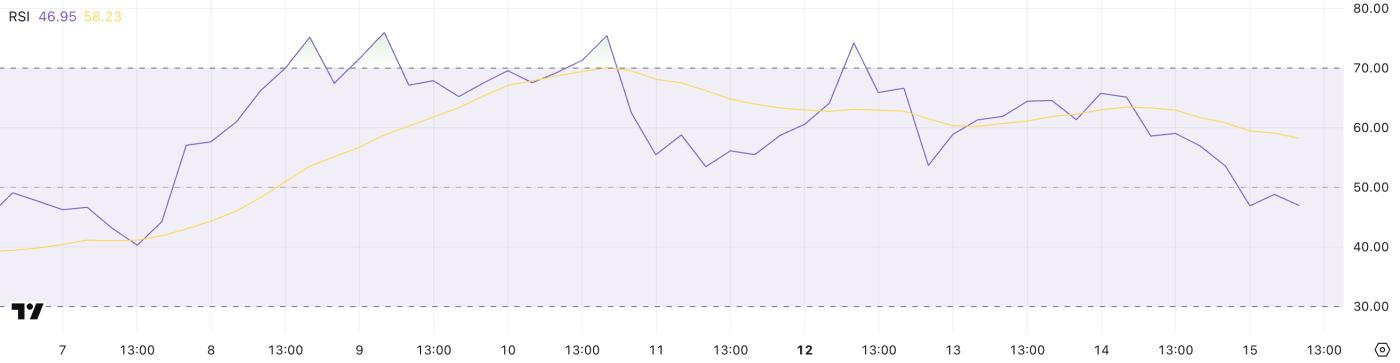 XRP RSI. Source: TradingView.
RSI is a momentum oscillator measuring price movement speed on a scale from 0 to 100. Indices above 70 typically indicate an asset is overbought and may need correction, while levels below 30 suggest oversold conditions that could lead to recovery.
XRP's current RSI of 46.95 shows no extremes, but the downward trend may signal weakening demand.
If RSI continues to drop towards 30, it could indicate increasing downward pressure; however, a recovery from current levels might help XRP stabilize and attempt a rebound.
XRP Faces Pressure as Price Slides Below Ichimoku Lines
The Ichimoku Cloud chart for XRP shows a change in momentum as price action has moved below both the green Tenkan-sen and red Kijun-sen lines.
This downward crossover is typically viewed as a short-term bearish signal, especially when confirmed by trading prices below the Kijun-sen.
The forward cloud (Senkou Span A and B) is currently green, indicating long-term prospects remain bullish. However, cloud narrowing suggests weakening trend strength and increases the likelihood of trend reversal.
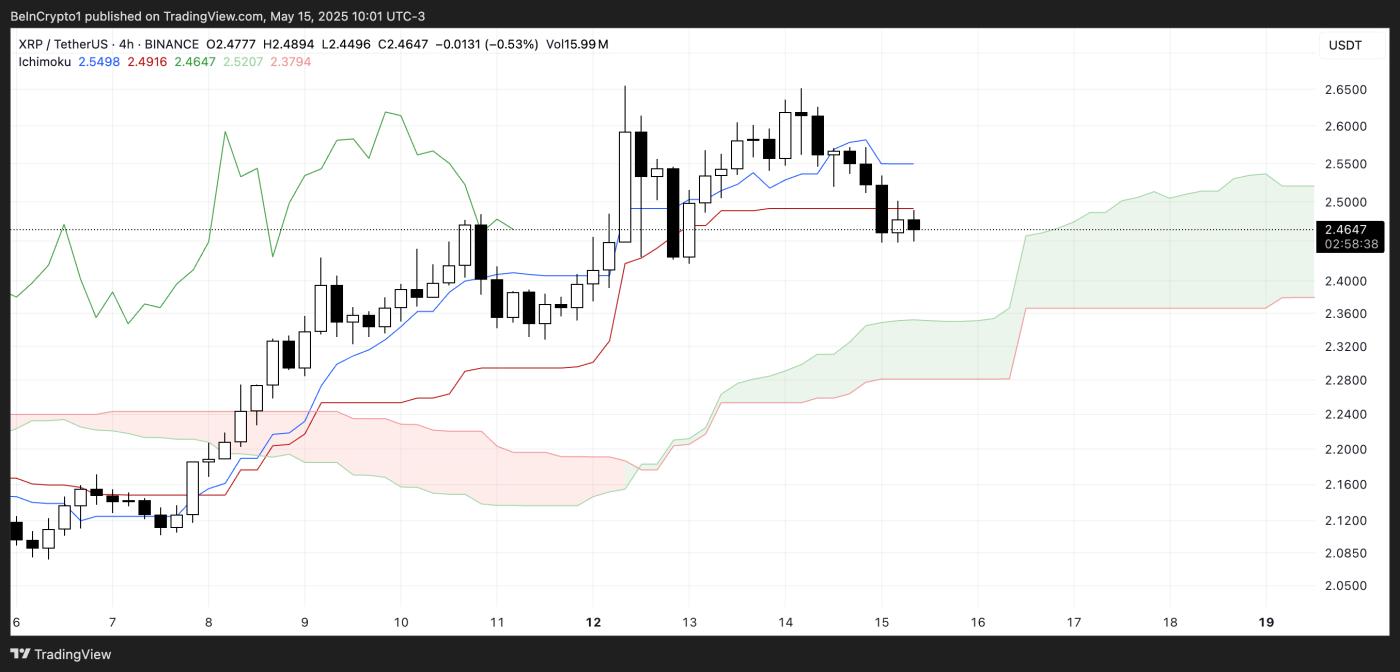 XRP Ichimoku Cloud. Source: TradingView.
Price is currently approaching the edge of the green cloud, which acts as an important support zone. If this support holds, XRP might consolidate or attempt recovery.
However, a definitive price break below the cloud would mark a bearish structural change. Additionally, the Chikou Span (lagging green line) has lost its previous price action bullish separation, indicating momentum is no longer clearly tilting upward.
Overall, this structure reflects a market at a crossroads – still maintaining structural support, but showing increasingly evident weakness.
XRP's EMA Lines Narrow as Market Awaits Next Move
XRP's EMA lines maintain an upward trend, with short-term moving averages still positioned above long-term lines – indicating the broader trend remains intact.
However, the distance between these lines has narrowed, signaling potential momentum weakness. This compression suggests bulls are losing control, and if XRP fails to maintain nearby support at $2.42, it could open opportunities for a deeper correction.
In such a scenario, subsequent price decline targets include $2.32, followed by $2.25 and $2.15 if downward pressure accelerates.
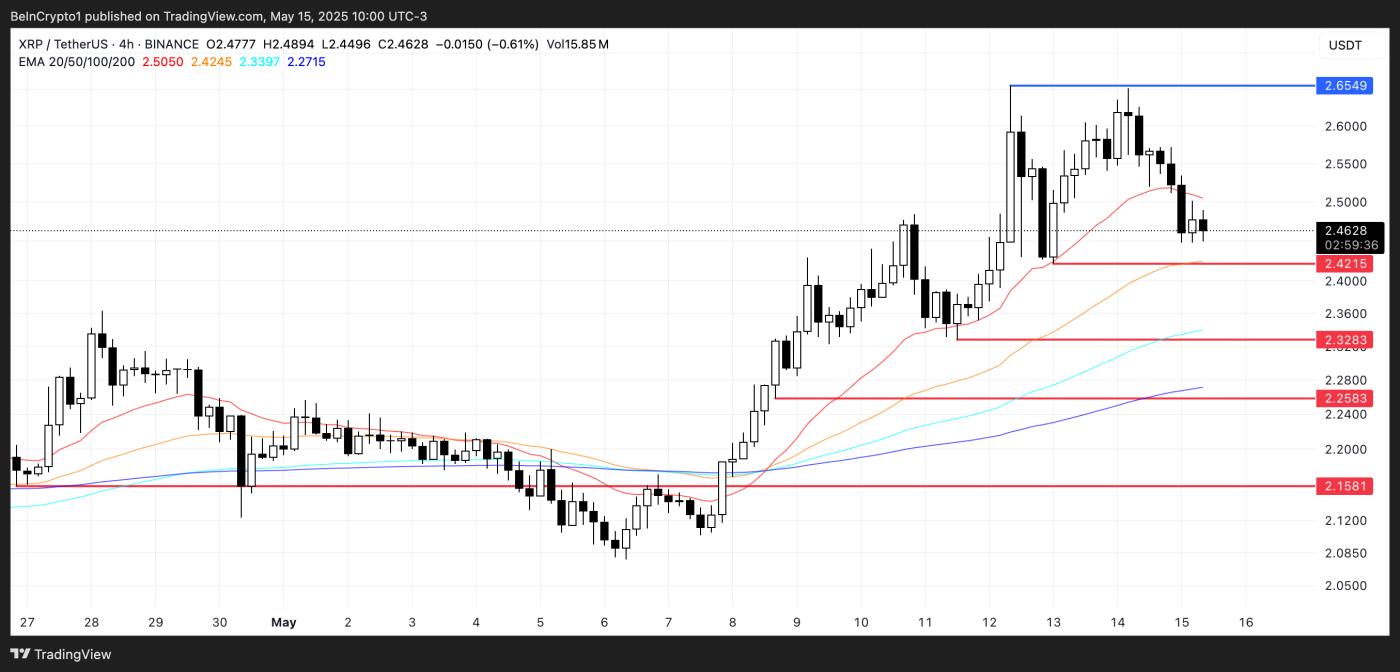 XRP Price Analysis. Source: TradingView.
Despite this vulnerability, XRP has increased 11.7% over the past week, indicating recent buying interest.
If positive momentum continues, XRP might once again challenge the $2.65 resistance level.
A successful breakout above that could pave the way for a move past $2.70 – a price not seen since March 2nd.