

The top cryptocurrency Bitcoin surged above $107,000 yesterday. It reached a daily high of $107,108, just 2% away from its ATH of $109,588, before pulling back.
Although the top cryptocurrency slightly decreased to $104,976 at the time of writing, market sentiment remains very optimistic, with on-chain indicators showing continued upward momentum.
Bitcoin Season is Happening Intensely
According to data from Blockchain Center, the cryptocurrency market is still in a "Bitcoin Season", a period when BTC significantly outperforms the broader altcoin market.
 Altcoin Season Index. Source: Blockchain Center
At this point, only 16 (32%) of the top 50 altcoins are outperforming BTC in the past 90 days, much lower than the 75% threshold needed to be considered an "Altcoin Season."
Moreover, the increase in Bitcoin's dominance reinforces this position. Since dropping to a two-month low of 61.89% on 05/16, BTCD, an index tracking BTC's market share in total cryptocurrency market capitalization, has been steadily increasing.
At this point, the index stands at 63.92%.
 BTC Dominance. Source: TradingView
Interestingly, since 05/14, TOTAL2, the index measuring the total market capitalization of all cryptocurrencies except BTC, has been trending downward. Currently standing at $1.18 trillion, it has decreased by $83 billion in the past week.
This difference indicates that investors are increasingly shifting capital into BTC rather than altcoins.
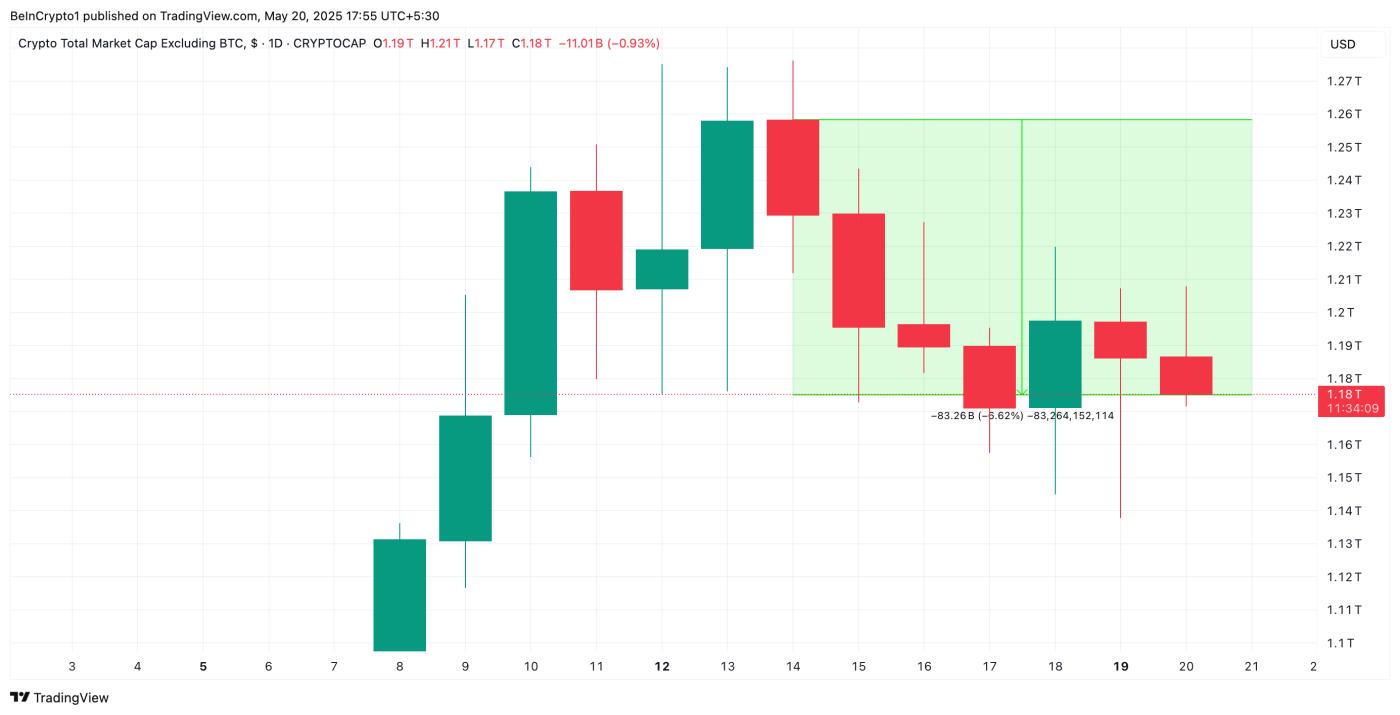 TOTAL2 Market Capitalization. Source: TradingView
The current trend shows traders are heavily betting on BTC's resilience, especially as the king coin attempts to stabilize above the critical price level of $105,000.
BTC's DMI Indicates Strong Buying Pressure
On the daily chart, Bitcoin's Directional Movement Index (DMI) confirms upward price pressure in the market. At this point, the positive directional index (+DI, green) is above the negative directional index (-DI, orange).
When an asset's DMI is set up this way, it indicates stronger upward momentum than downward momentum. This signals an upward price trend and buying pressure in the BTC market.
If this continues, its price may attempt to break through the resistance level at $107,048 and move towards the ATH of $109,588.
 Bitcoin Price Analysis. Source: TradingView
On the other hand, if selling pressure increases, BTC price could drop to $102,080.


