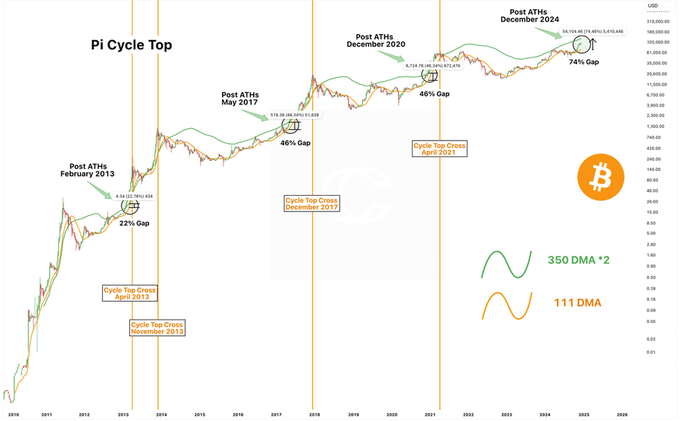
This chart has silently predicted the top of every <$BTC> since 2013, and it has been accurate. Do you see the intersection of these two lines? Their intersection points show the precise market ATH: 2013 - Peak 2017 - Best 2021 - Top Whenever these two lines intersect, the market becomes euphoric, and then the entire market crashes. It has indeed been effective every time. <$BTC> is still far from its ATH. In the coming months, it will reach $130,000 to $160,000, and then the green and orange lines will cross, and I will temporarily exit.
This article is machine translated
Show original
Sector:
From Twitter
Disclaimer: The content above is only the author's opinion which does not represent any position of Followin, and is not intended as, and shall not be understood or construed as, investment advice from Followin.
Like
Add to Favorites
Comments
Share
Relevant content