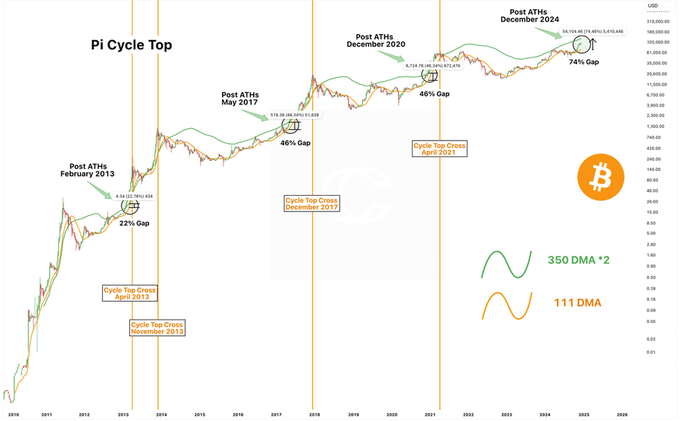
This chart has silently predicted the top of every <$BTC> since 2013, and it has been accurate.
Do you see the intersection of these two lines? Their intersection points show the precise market ATH:
2013 - Peak
2017 - Best
2021 - Top
Whenever these two lines intersect, the market becomes euphoric, and then the entire market crashes. It has indeed been effective every time.
<$BTC> is still far from its ATH. In the coming months, it will reach $130,000 to $160,000, and then the green and orange lines will cross, and I will temporarily exit.