

I'll continue to focus on price instead of narratives.
Here's what I'm seeing right now...
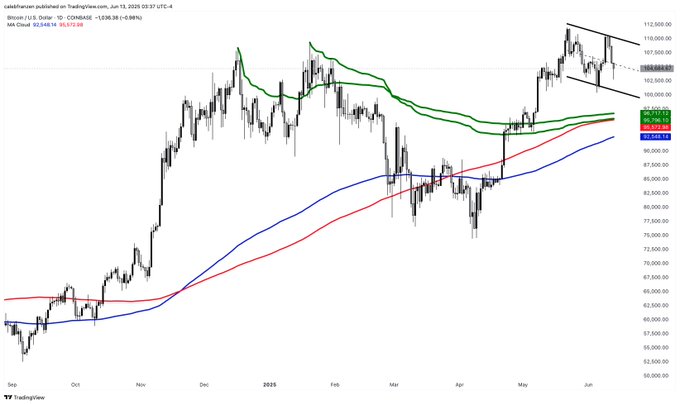
Bitcoin is still trading above its 200-day moving average cloud.
Bitcoin is still trading above the AVWAP from the Q4'24 and Q1'25 highs.
Bitcoin has a regression channel bull flag.
I'm telling you the indicators and structure that I'm following here, but let's also talk about implications.
The significance of the 200-day MA cloud and the AVWAP levels is this...
Price can fall down to $92.6k to $97k AND STILL RETAIN BULLISH PRICE STRUCTURE, STATISTICALLY.
Maybe we don't dip that far...
Maybe we "only" retest the lower-bound of the regression channel, which could push prices below $100k.
These declines would feel bad.
They would wreck leveraged long traders.
But they wouldn't invalidate any of the bullish dynamics that are currently still in the market.
Here's something else...
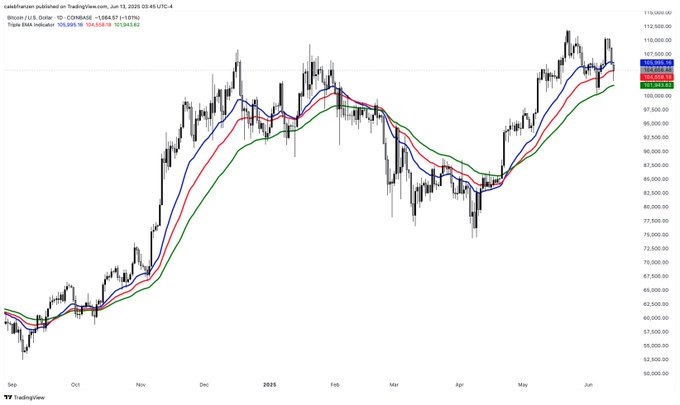
Look at these short/medium-term EMAs:
🔵 21-day EMA
🔴 34-day EMA
🟢 55-day EMA
Look at how well this EMA band works as dynamic resistance and support.
For all we know, this is just another valid support retest that could produce new highs.
Sector:
From Twitter
Disclaimer: The content above is only the author's opinion which does not represent any position of Followin, and is not intended as, and shall not be understood or construed as, investment advice from Followin.
Like
Add to Favorites
Comments
Share
Relevant content


