

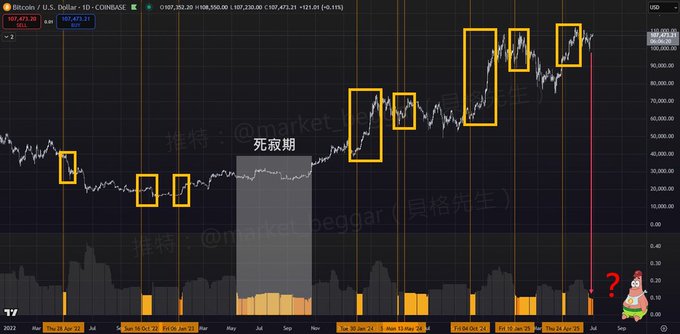
Calm Before the Storm: The Terrifying Balance Before a Breakout ⚖️ There are plenty of volatility indicators out there—DVOL, BitVol, and more. As mentioned in the quoted post below, I also shared a custom volatility indicator I use back in late April. If you’re interested, you can grab it for free in the comments of the quoted post below 👇 Back to the main point—the sideways daily candles are screaming dead market vibes right now, and my indicator is flashing signals again... ⚠️ // In financial markets, when an asset’s volatility converges to low levels, it means both bulls and bears are charging up, and the market is walking a tightrope in a perfect balance. This state never lasts long—once one side makes a move and breaks the equilibrium, we could see a sharp breakout in either direction‼️ As you can see from the chart, the volatility indicator I introduced earlier is lighting up again in recent days‼️ The formula is super simple and straightforward: 📝 Volatility = (Highest price in n days - Lowest price in n days) / (Highest price in n days + Lowest price in n days) Combining this with yesterday’s weekly report URPD section: over 1.62 million BTC are currently piled up in the tight 104~106K range. Both signals are screaming that something BIG is coming... As for up or down—nobody can predict for sure. But if you’re asking for my bias, based on my previous TA (x.com/market_beggar/status/193...…), I still think the odds of a new ATH aren’t low, so I’m leaning slightly bullish; If you’re familiar with options, you might want to consider opening some long vol positions 📈 // A quick note on the indicator: The default “n” is 60 days, and to make tracking easier, I set two thresholds: 🟡 Below 0.13 = Yellow 🟠 Below 0.10 = Orange If you’ve got the indicator, feel free to tweak the parameters and experiment 🎮 Indicator link & full instructions: x.com/market_beggar/status/191...… That’s it for today—hope this helps! If you picked up the indicator, don’t forget to smash that like ❤️
This article is machine translated
Show original

貝格先生
@market_beggar
04-30
一個原理超簡單的波動率指標〽️
先前提過:如果波動率逐漸收斂、位於低值,
通常意味著行情可能即將表態⚠️
其原理在於:
多空兩方的勢力趨於平衡,市場處在等待的狀態。
此時, 一旦突破平衡、資金開始表態,就可能形成強動能,
造成行情朝向某一方突破‼️
今天就來和各位分享一個超簡單的監測方式👇 x.com/market_beggar/…
From Twitter
Disclaimer: The content above is only the author's opinion which does not represent any position of Followin, and is not intended as, and shall not be understood or construed as, investment advice from Followin.
Like
Add to Favorites
Comments
Share
Relevant content


