"74K Incoming": The New Liquidity Magnet Zone Is Here ⚠️
🪧 TL;DR:
This post dives into both liquidity and on-chain analysis, sharing my bias for the coming market moves and a full trading plan.
The weekend’s sudden dump reignited bearish vibes across the market. But maybe you missed it: a new signal is quietly flashing, and a sweep of 74K is now a high-probability event...👇
//
🟡 Quick Recap
Previously, I outlined three scenarios for BTC’s next move:
1️⃣ Stop Hunt at 80.5K, then bottom out
2️⃣ Stop Hunt at 74K, then bottom out
3️⃣ No Stop Hunt at either level, deeper correction
If you’ve been around, you know a proper Stop Hunt needs three things:
✅ Break below the liquidity zone
✅ Reclaim the zone after the break
✅ Strong taker buy on the reclaim
📖 More on Stop Hunt mechanics & live case study:
x.com/market_beggar/status/190...…
When BTC broke 80.5K over the weekend, there was no strong taker buy. Plus, weekend action is often fakeout territory—historically, weekend pumps/dumps get faded. I flagged this in the group right away.
💭 Free group chat: x.com/market_beggar/status/200...…
BTC kept bleeding, no taker buy defense in sight. Scenario 1 invalidated, and the direction is getting clearer.
//
🟡 New Risk Signal Just Dropped
Besides confirming scenario 1’s fail, the weekend crash gave us a major clue:
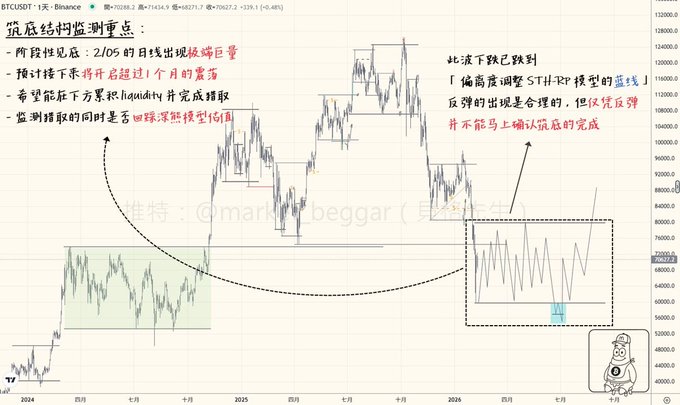
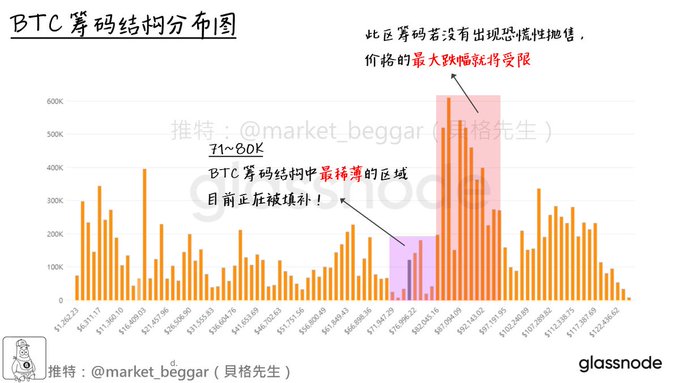
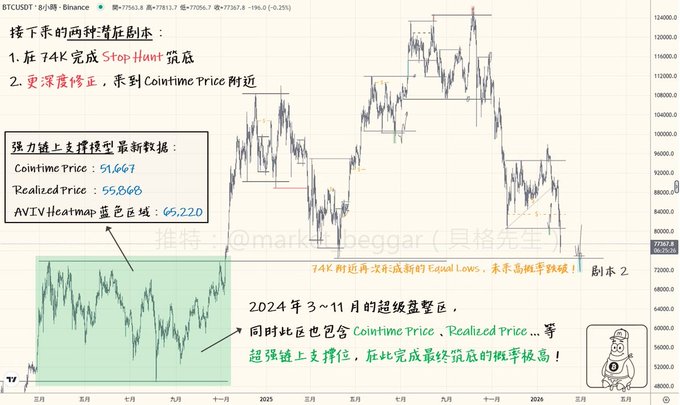
BTC just printed new Equal Lows around 74K‼️
Equal Lows = horizontal wicks that are nearly identical and none dips below the leftmost wick. This signals "liquidity pooling"—and per the “liquidity magnet effect” I’ve been hammering, price has a high chance of revisiting those Equal Lows to sweep liquidity.
See the chart:
Weekend's low now matches the April 2025 low, forming new Equal Lows. No matter what happens next, odds are high we’ll revisit 74K and clear out that liquidity‼️
I’ve shared how to trade these liquidity clusters before. My recent post, "Rising Downside Risk & Calm Before the Storm," was based on exactly this concept—and once again, liquidity proved its power.
📖 BTC TA Update: Downside Risk & Calm Before the Storm
x.com/market_beggar/status/201...…
If you’re skeptical, go back and check BTC’s historical price action. See if any Equal Lows/Highs have never been swept. Anyone doubting this will get the point after a proper backtest.
//
🟡 Next Trading Scenarios
Here’s my current playbook:
🔸1. Stop Hunt at 74K, then bottom out—major cycle bottom confirmed
For a proper Stop Hunt, we need:
✅ Break below 74K
✅ Reclaim 74K after the break
✅ Strong taker buy on the reclaim
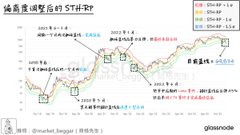
Worth noting: Below 74K sits a super strong support from another on-chain model, the “Deviation-Adjusted STH-RP Model”📊
📖 Short-Term Holder Cost & Support Zone Update
x.com/market_beggar/status/201...…
Blue line on this model is around 70K. If we get a Stop Hunt, it’ll perfectly resonate with this model, setting a solid base for the next leg up📈
-
🔸2. No Stop Hunt at 74K—hunt for support lower
If we break 74K and no taker steps in, price could genuinely break down. Then we look for other bottom signals.
I’ve shared this before; check these posts:
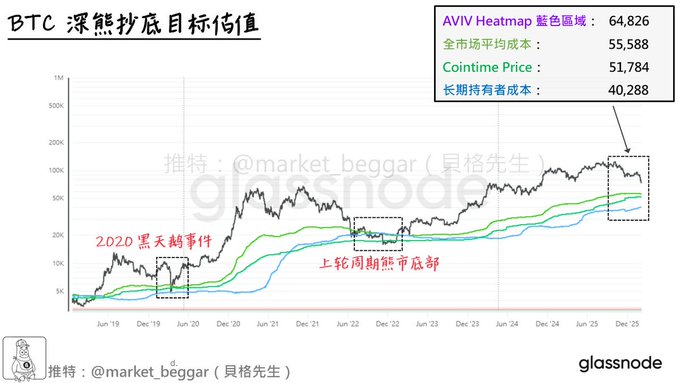
📖 BTC Deep Bear Extreme Valuations
x.com/market_beggar/status/201...…
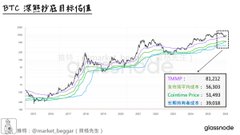
Key metrics/models I’m watching:
➡️ Cointime Price: ~51,667
Details: x.com/market_beggar/status/187...…
➡️ Realized Price (Market Avg Cost): ~55,868
Details: x.com/market_beggar/status/186...…
➡️ AVIV Heatmap Blue Zone: ~65,220
Details: x.com/market_beggar/status/201...…
If price nukes to these levels, I guarantee these are cycle-level golden buying zones. I’ll be deploying the rest of my funds there, maybe even with leverage💰
If you’re unsure, check the indicator explanations above—each time price hit these levels, it marked major cycle bottoms. No exceptions.
//
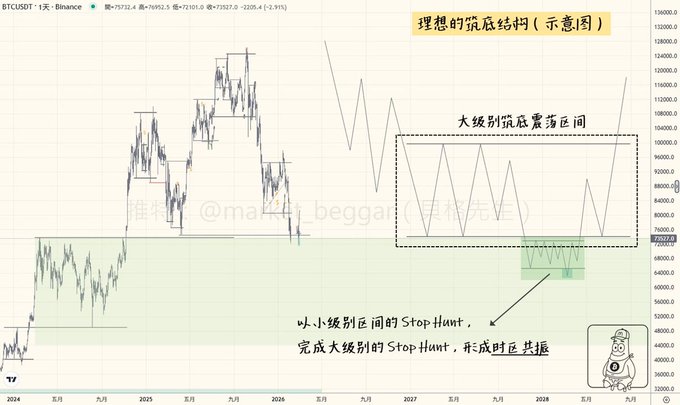
🟡 2024’s Super Consolidation Zone
Let me add another key support zone to watch.
Flashback to 2024: After the first big BTC distribution in March, BTC entered a massive ~200-day chop range. Only after Trump’s win did the next mega rally kick off, but it also triggered another big distribution.
📖 Early 2025 Top Call: Be Ready to Exit
x.com/market_beggar/status/187...…
Most missed it: A 200-day sideways range for BTC is rare. Consolidation is all about churn—longer stays mean buyers can absorb whales’ sell pressure. Tons of capital was willing to buy BTC at those levels.
Normally, a range resolves quickly, since bulls/bears reach a standoff, and any small catalyst can tip the scales🌾
But over 200 days of chop is wild. ETF approval and fresh external money caught all the old whale selling, cementing that range as a solid base. So:
"The consolidation zone (49~74K) is very likely a strong support region."
Notice: All those super strong bear-market valuation zones match perfectly with this big consolidation range.
Bottom line:
"BTC’s cycle bottom this round will likely form between 49K~74K‼️"
Believe it or not, time will tell.
//
🟡 Wrap-Up
Quick summary📝:
🔺 No taker buy at 80.5K breakdown—scenario 1 invalidated
🔺 New Equal Lows at 74K—high odds of a sweep coming
🔺 Scenario 1: Stop Hunt at 74K + STH-RP model blue line confluence
🔺 Scenario 2: No Stop Hunt at 74K—hunt for deeper support
🔺 2024’s 3~11 month mega chop zone is likely the cycle bottom for this round
Some may feel lost/disappointed at scenario 1’s failure, but I see the market getting clearer—not a bad thing.
Trading is all about planning and then validating. Now that scenario 1’s off the table, we’ve got strong support below. If you’re long-term bullish on BTC and believe in its revolutionary value, this dump should get bulls excited—BTC is officially getting cheaper💎
If you thought 100K+ BTC was too expensive, isn’t this the time to be happy?
Bit of a long post, but I wanted to cover all the bases. Hope this helps—good luck trading this week!🫡
twitter.com/market_beggar/stat...