HBAR's price may be losing momentum. Despite a strong 58.77% increase in the past month, HBAR has erased all profits in the week and dropped over 8% in the past 24 hours.
Although this seems like a normal correction, when looking more closely at past price behavior, short-term chart signals, and critical support areas, there might be deeper challenges ahead.
Historical Decline Suggests Familiar Profit-Taking Zone
Why examine price drops now? Because Hedera has entered the zone where profit-taking typically begins. In March 2025, when HBAR rose to $0.26, the decline from the All-Time-High was around 53.74%. That was when a 47% drop occurred, pulling the token down to $0.14 in just one month.
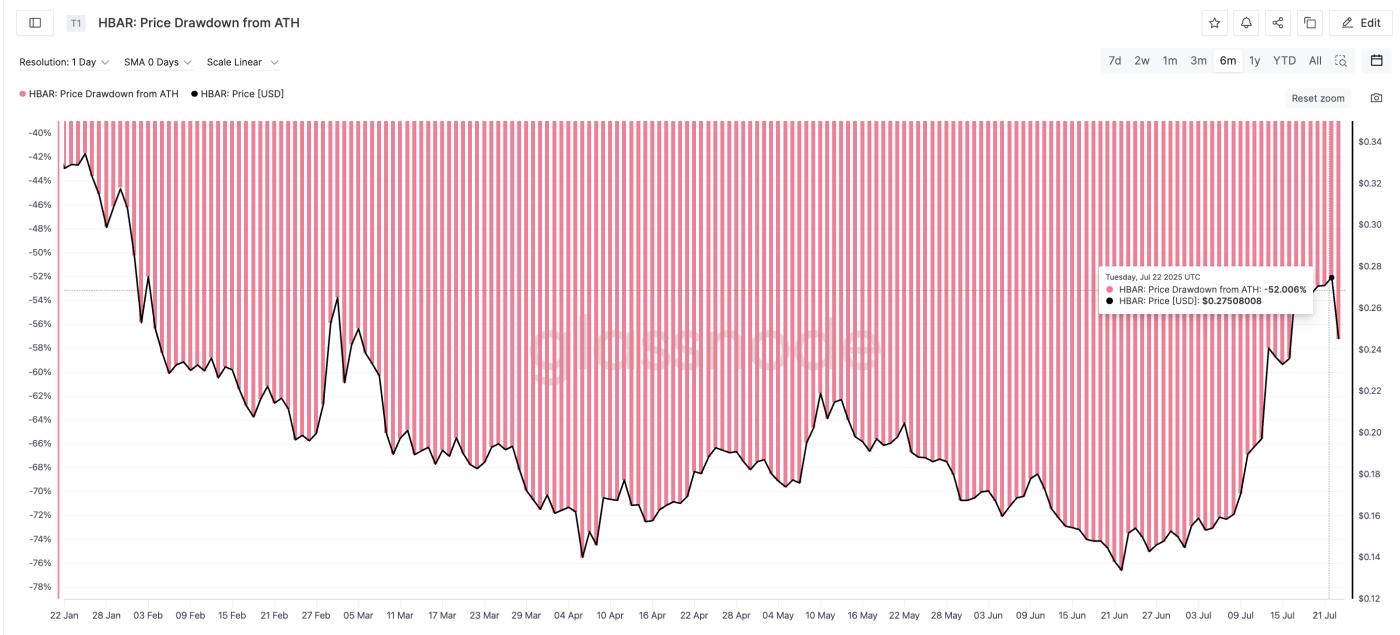 HBAR Price Drawdown and Correction History: glassnode
Fast forward to July 22, the drawdown stands at 52%, with HBAR trading near $0.27. Since then, correction has begun; a sign that traders might again be taking profits in this 50-60% decline zone.
Even if this occurs like March but more gently (thanks to the altcoin season story), a 40% drop from $0.27 would push HBAR's price to around $0.16. Interestingly, this matches an important support level. More information about this in the following analysis!
In summary, historical price decline zones are where traders typically stop. And that pattern seems to be repeating.
The drawdown from All-Time-High measures how much a token's price has dropped from its peak. It helps identify common zones where traders take profits.
Death Cross on 4-Hour Chart Could Accelerate HBAR's Decline
Zooming into the 4-hour chart reveals another price drop warning. The 20-period EMA (red line) is approaching the 50-period EMA (orange line), a classic bearish crossover called a "Death Cross." Although not yet triggered, the setup is almost complete.
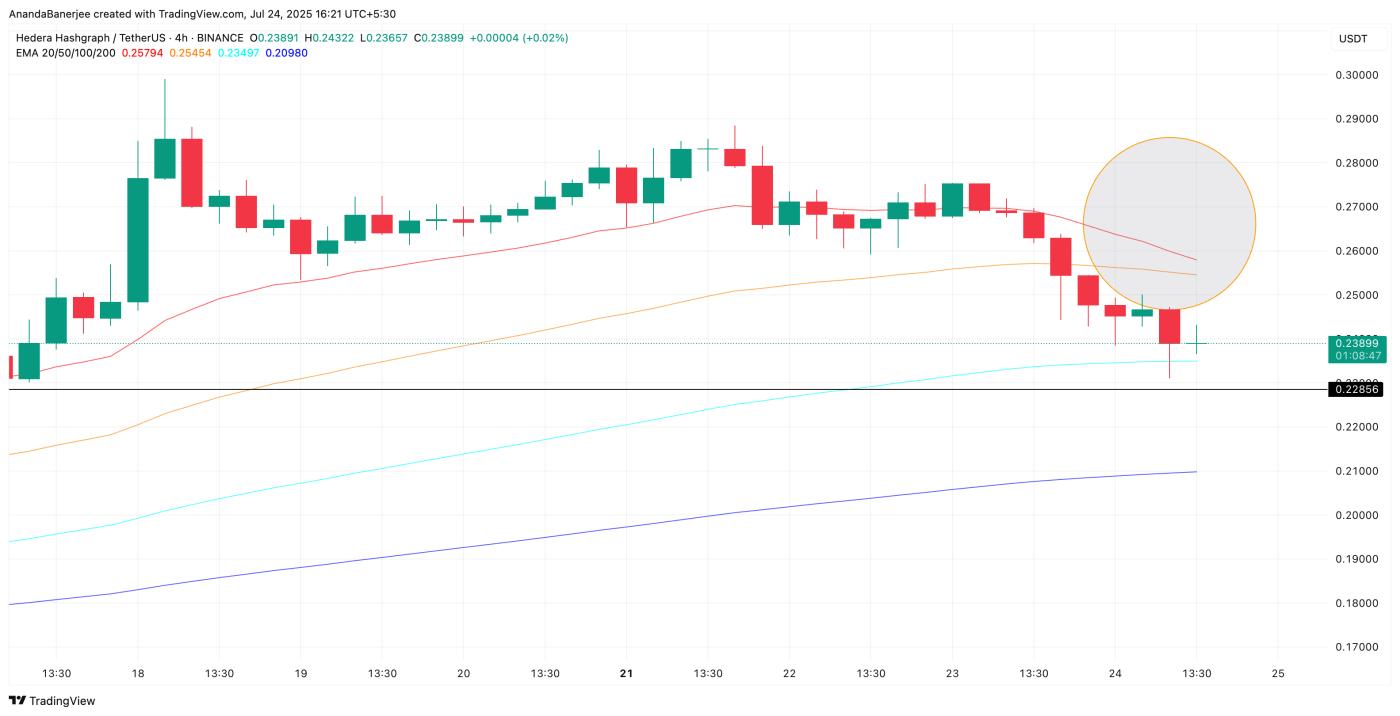 HBAR Price and EMA Crossover: TradingView
We use the 4-hour chart because it often detects trend changes before the daily timeframe. This early signal suggests momentum is shifting to support the bears.
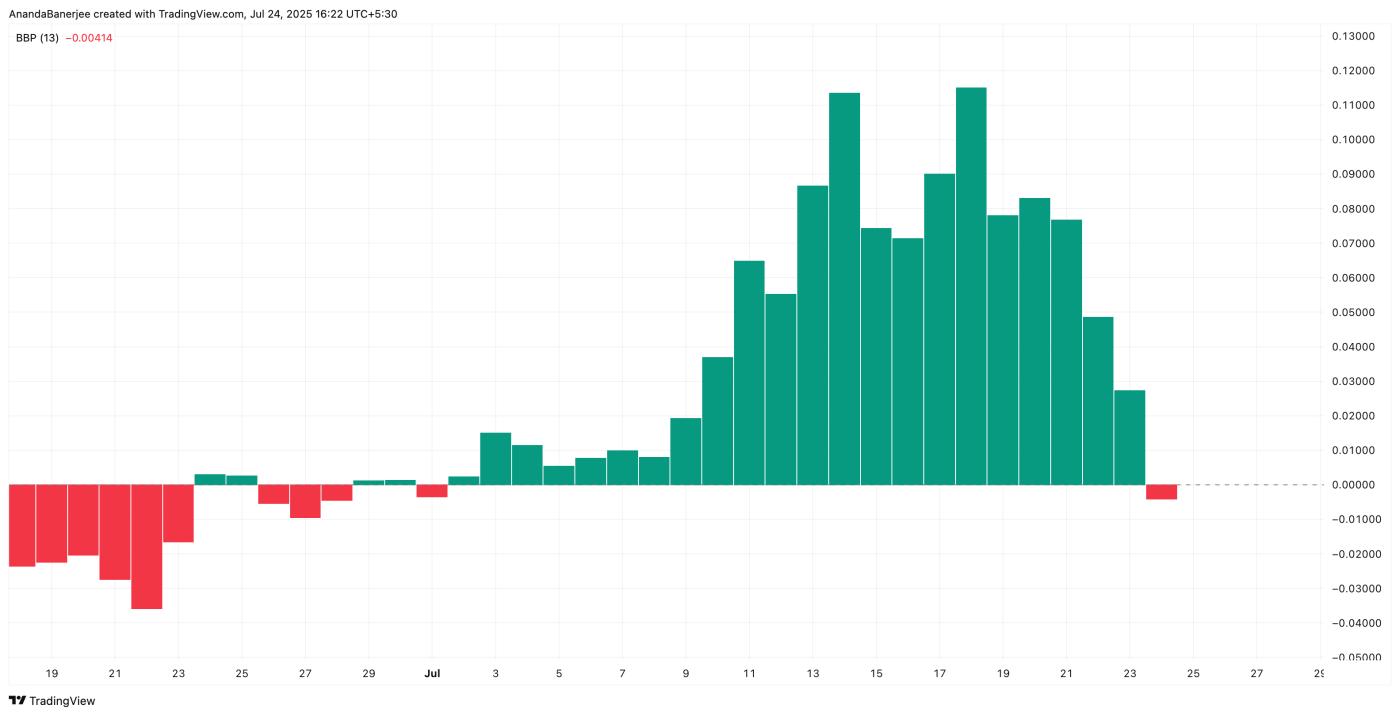 HBAR Bull Bear Strength Indicator: TradingView
Supporting this view, the Bull Bear Strength Index has turned negative. Sellers are dominating; a signal that price decline could accelerate if bulls don't intervene. If the crossover is confirmed, with bears in control, expect momentum selling to push prices lower, especially given historical precedent.
The Bull Bear Strength measures buying versus selling strength. When it turns negative (red), it means bears have taken control.
For TA and token updates: Want more detailed information about tokens like this? Subscribe to Harsh Notariya's Daily Crypto Newsletter here.
Important HBAR Price Support Lies at $0.21
HBAR is currently trading around $0.23, fluctuating just above the 0.382 Fibonacci retracement at $0.23. This line is drawn from the recent low of $0.12 to the high of $0.29.
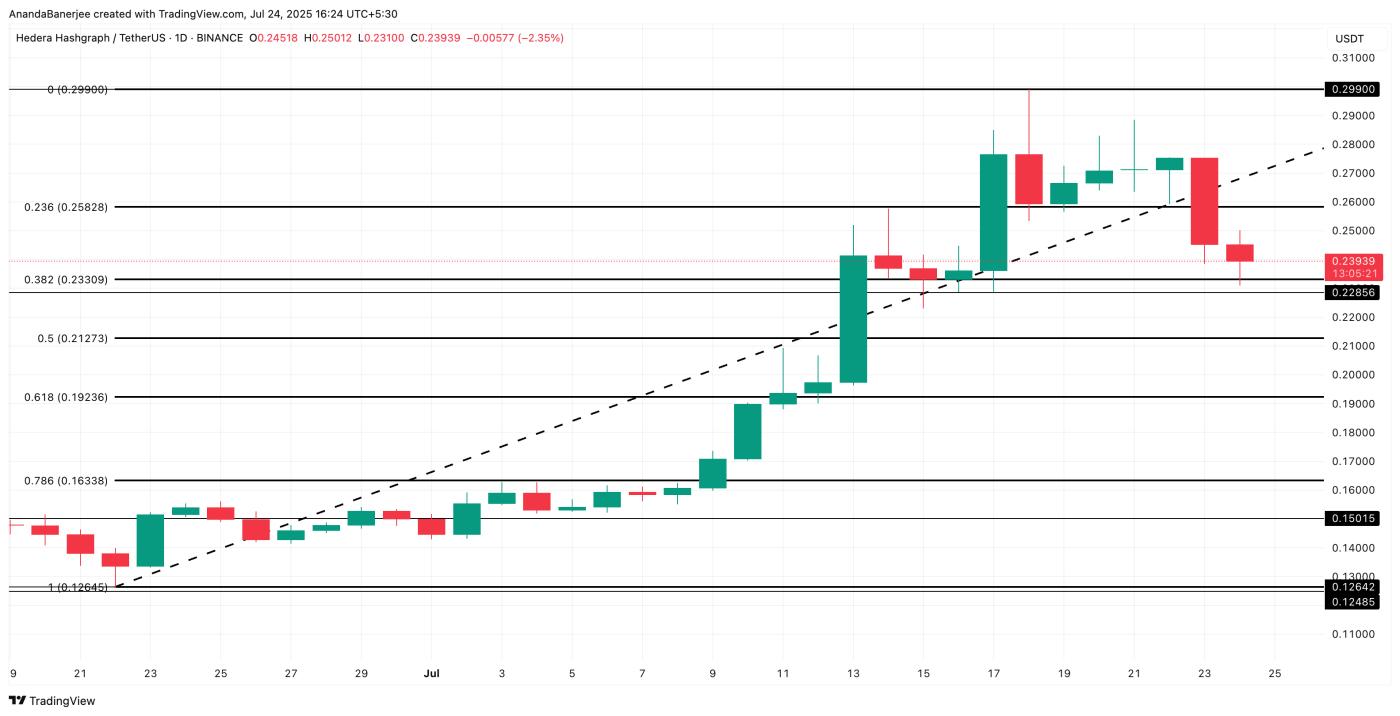 HBAR Price Analysis: TradingView
If the $0.23 level breaks, which is increasingly likely, the next support level is at $0.212 (Fib 0.5). Further out, $0.19 and $0.16 become critical levels to watch; the latter represents a 40% drop from the recent high.
However, if HBAR can reclaim the $0.25 support (now resistance) and the Death Cross doesn't occur, the decline hypothesis could be nullified.